| Citation: | SUN Y,PENG H,JIANG J J,et al.,2023. Development of TY-series high-precision volumetric strain gauge: Analysis and application of its seismic reflection capability[J]. Journal of Geomechanics,29(3):324−338 doi: 10.12090/j.issn.1006-6616.20232903

|
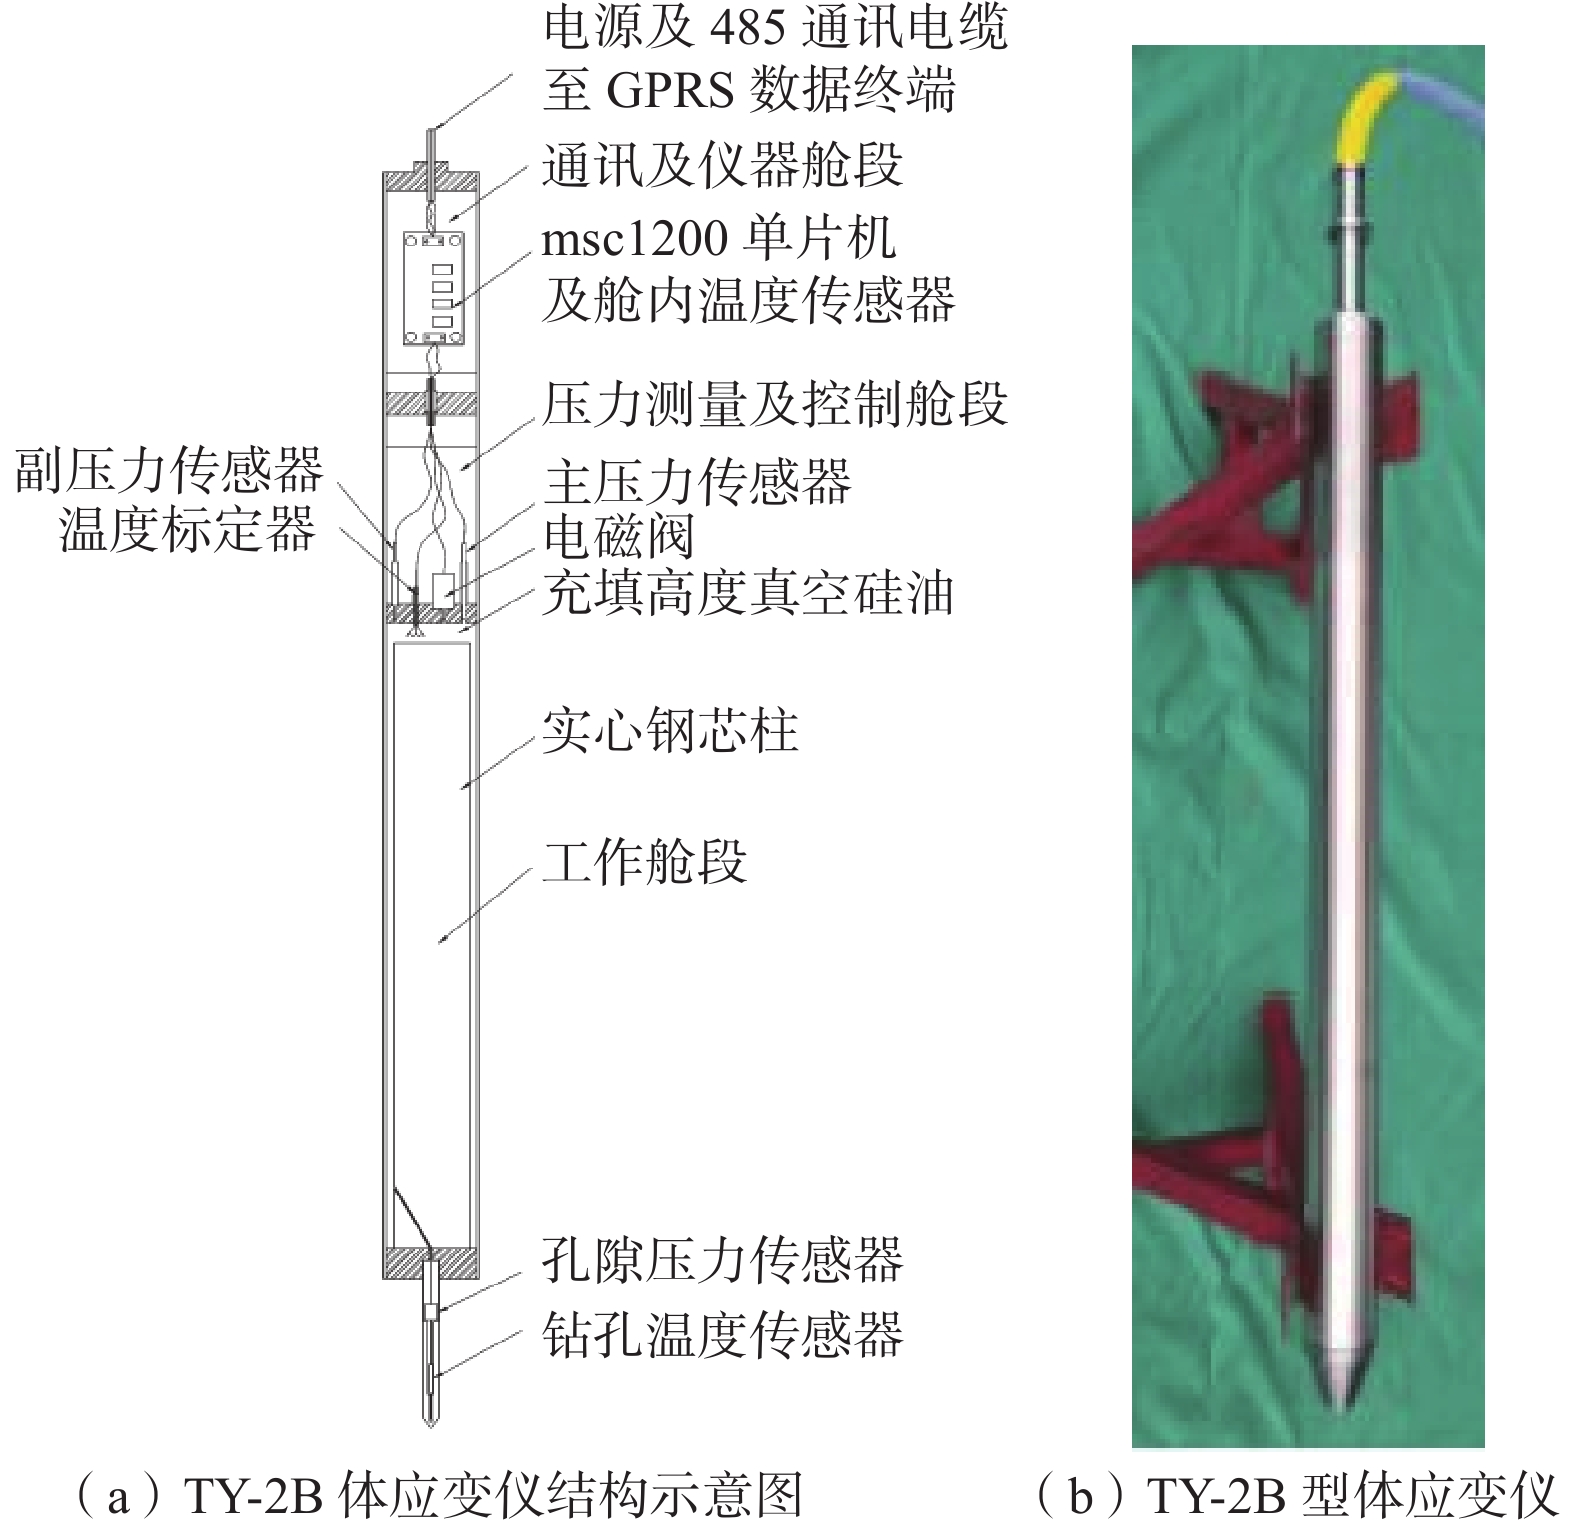
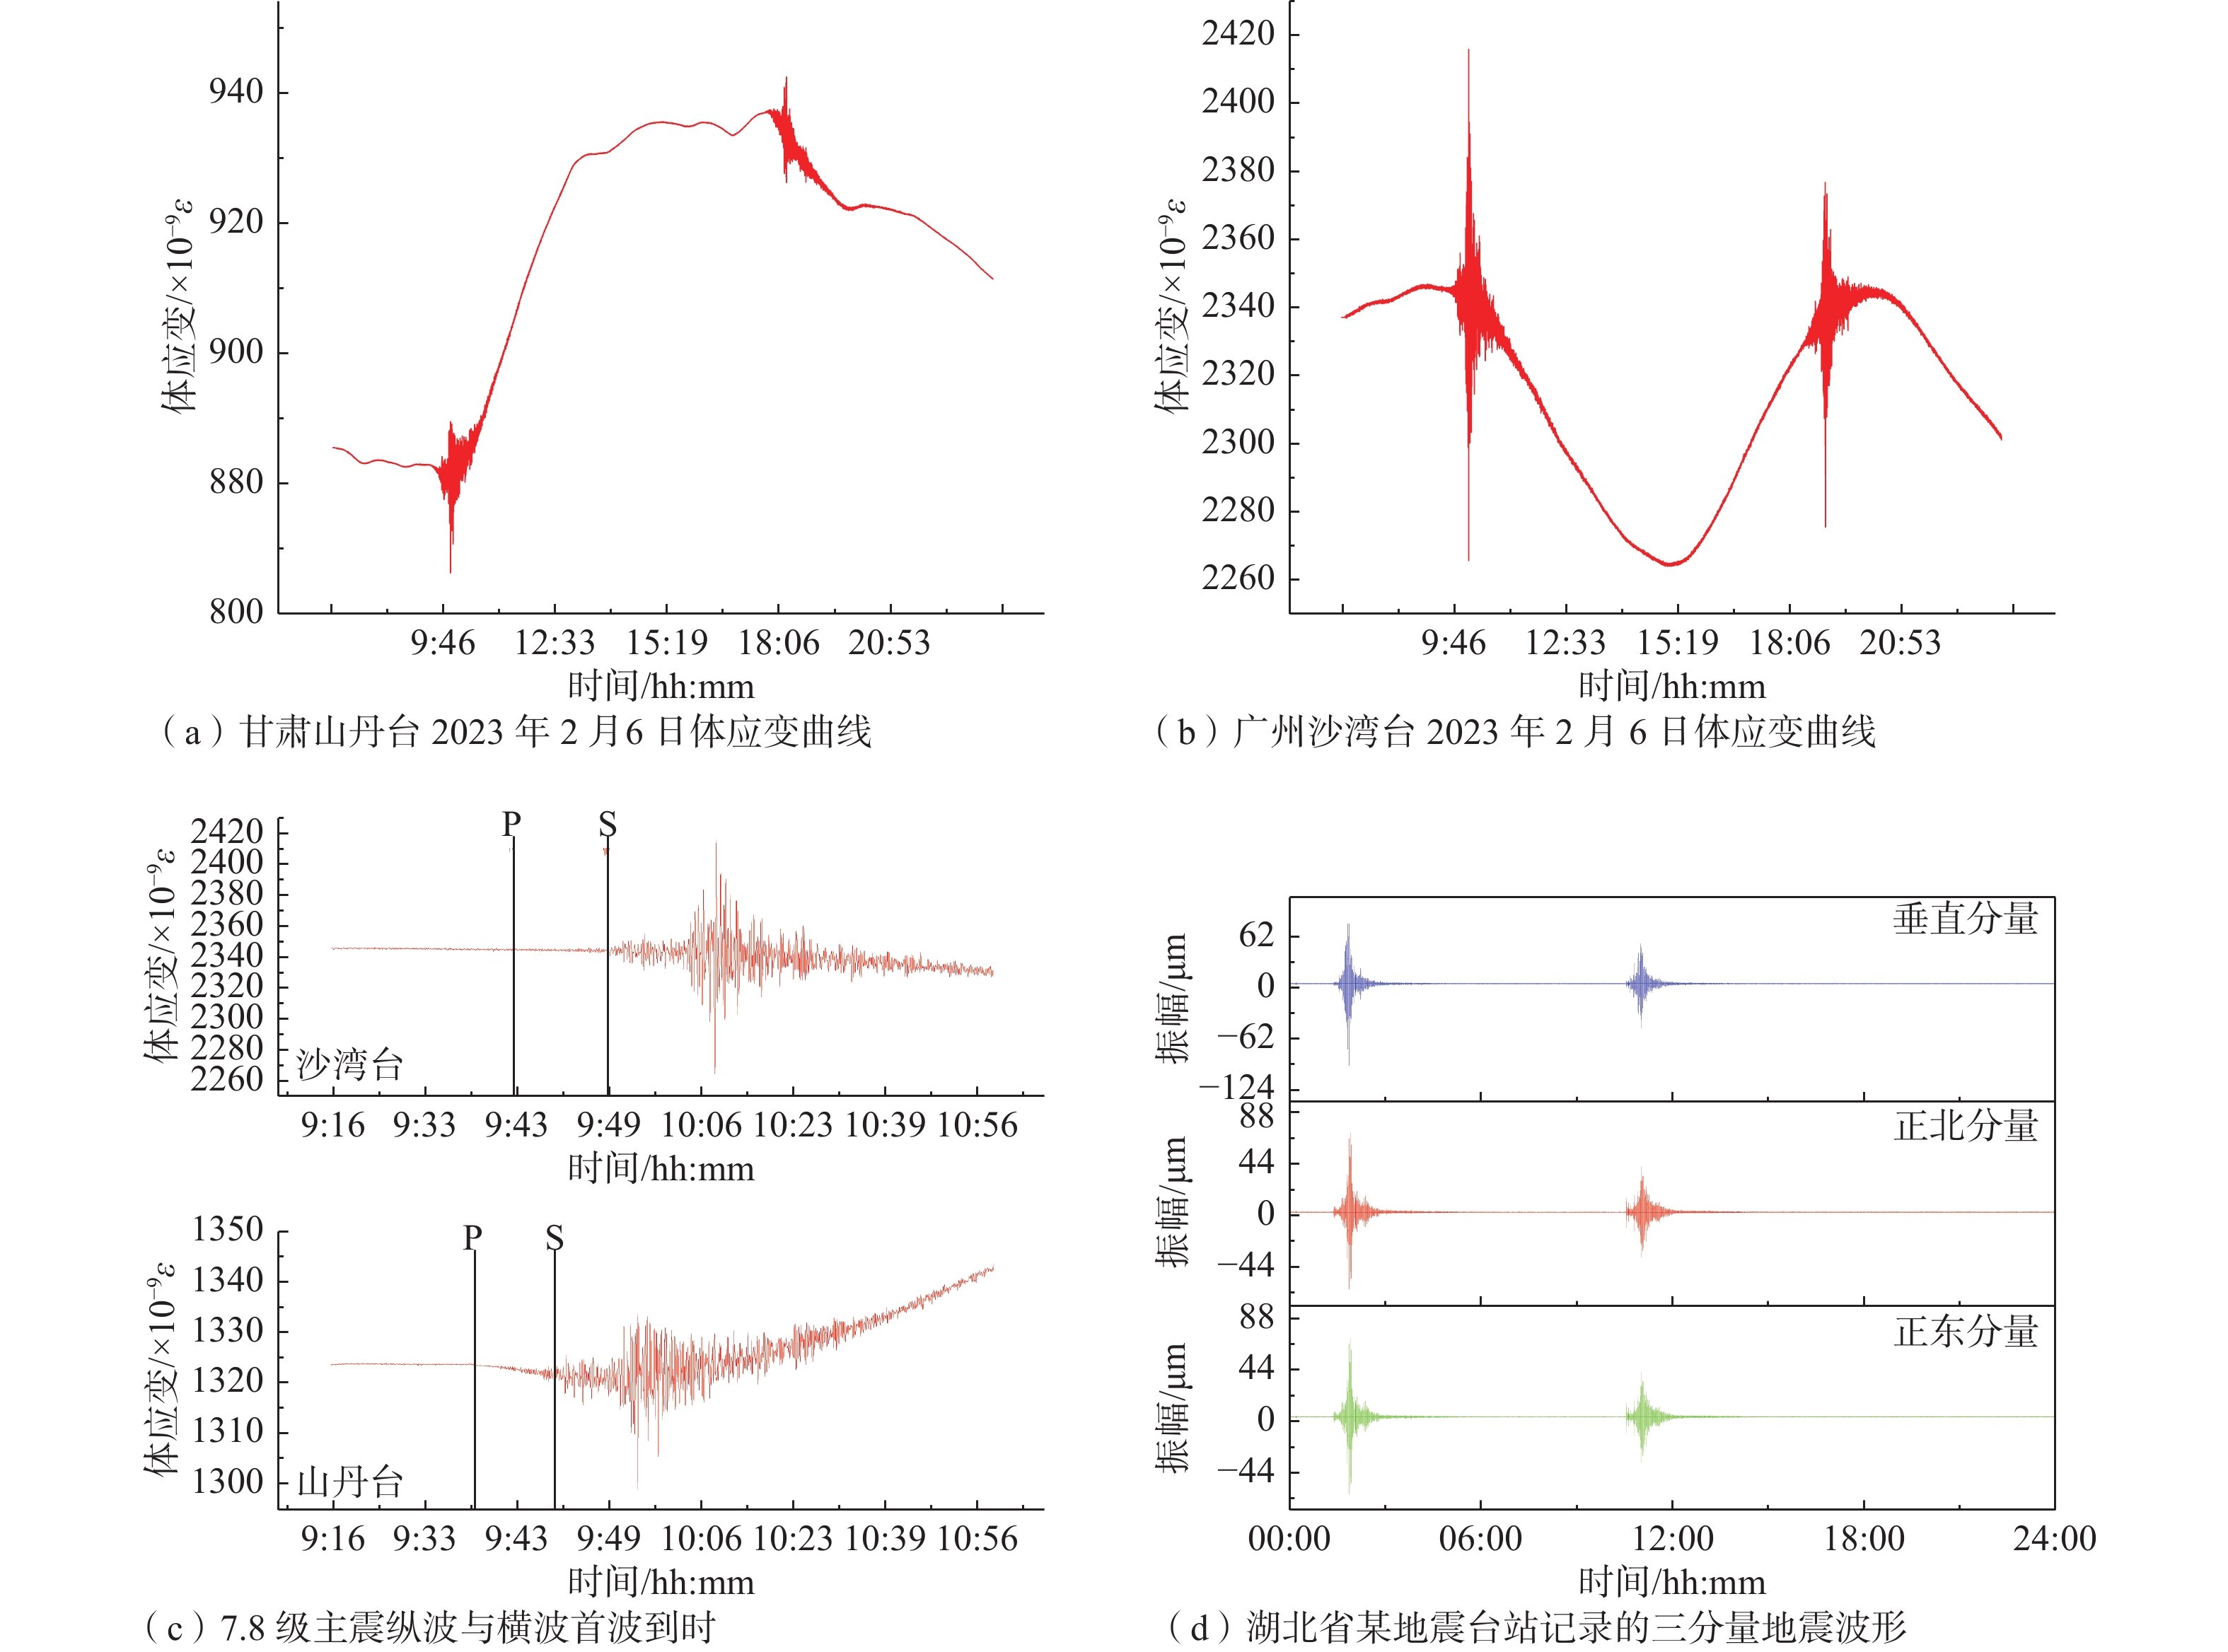
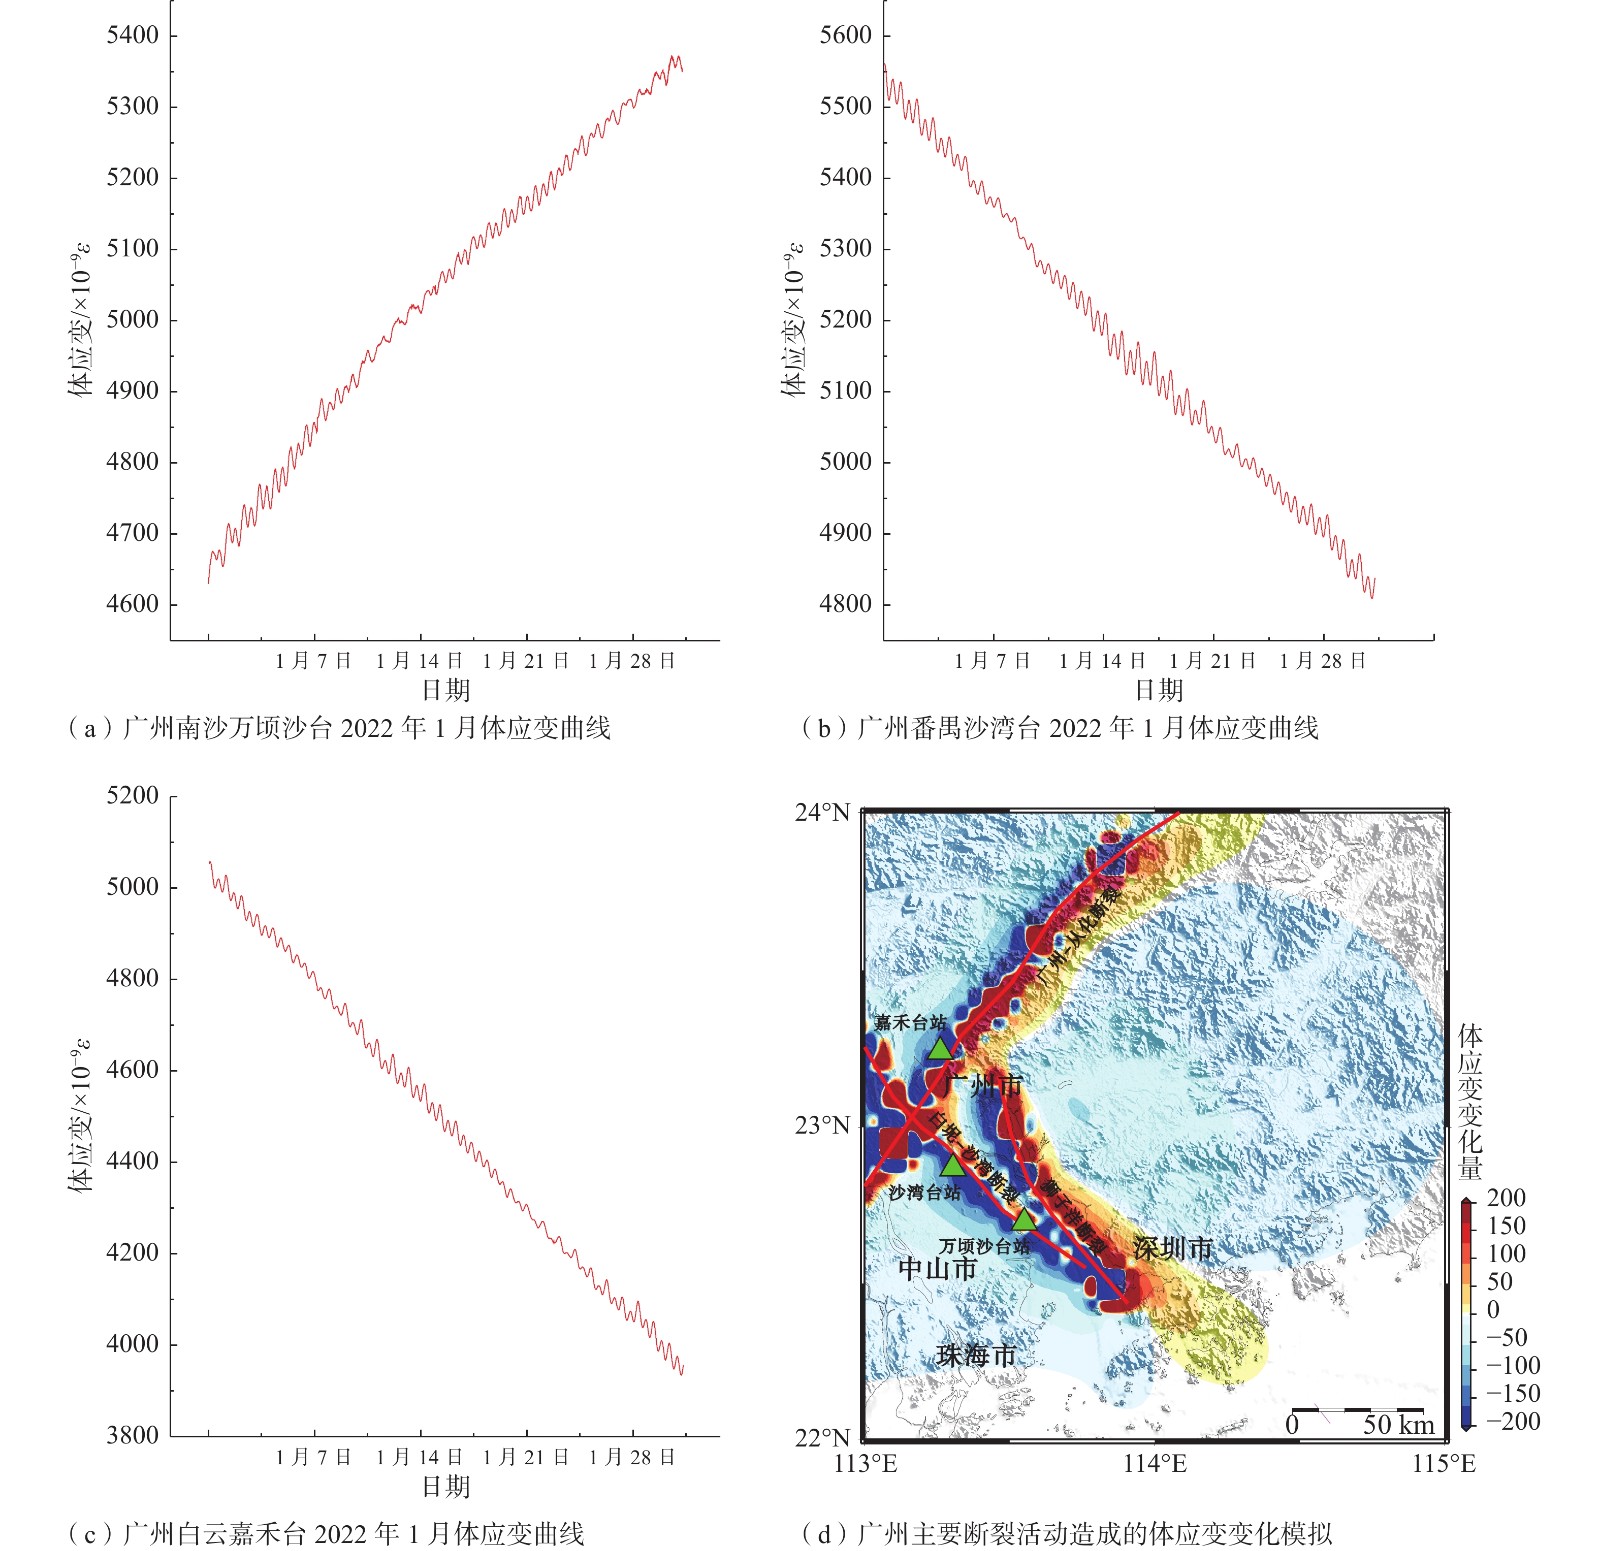
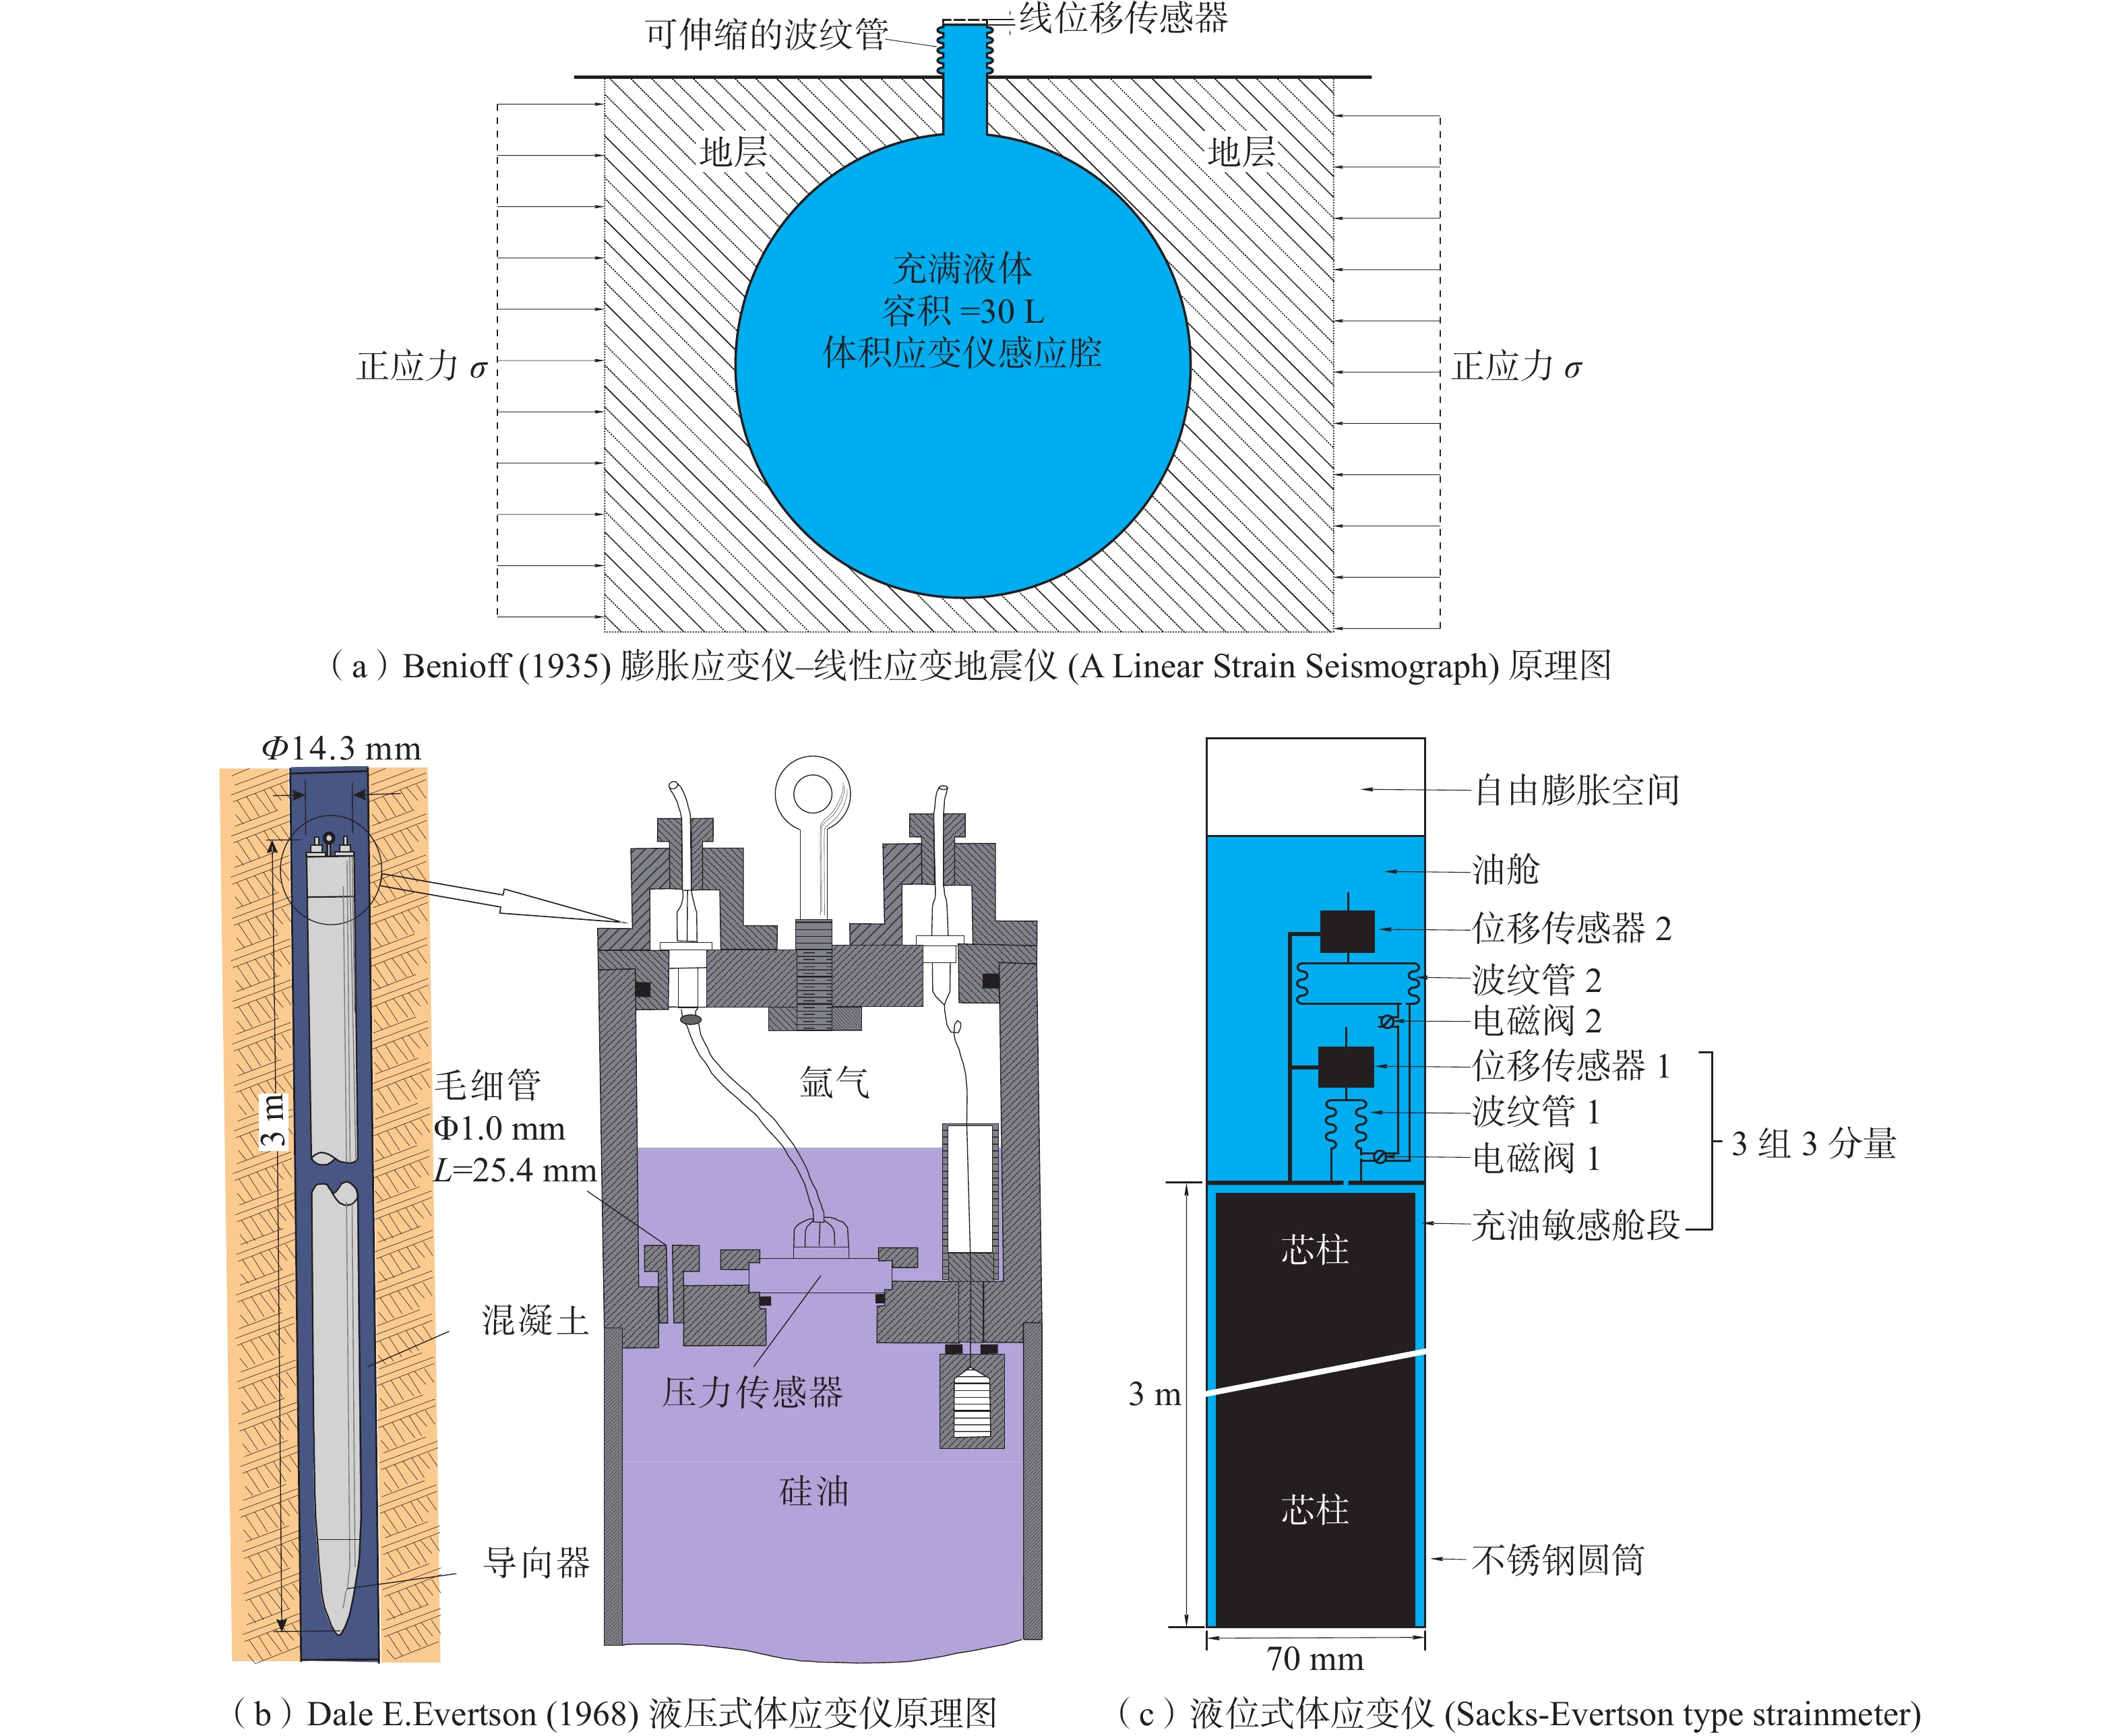
The article reviews the development of the volumetric borehole strain gauge. In response to the current problems of insufficient stability and bandwidth and low calibration accuracy of the volumetric strain gauge, a TY-2B-type small volumetric borehole strain gauge was developed with innovative improvements in the hydraulic sensor, control circuit, and calibration method. The improved hydraulic sensor improves the accuracy and reduces the instrument’s volume; the improved control circuit increases the sampling rate, bandwidth, and the instrument’s stability; the innovative piezoelectric ceramic calibration technology raises the reliability of the monitoring data. The test results show that the improved TY-2B volumetric strain gauge has a low power consumption of less than 3 W, good long-term stability, high sensitivity with a resolution of 10-11 ε, and suitable high-frequency and low-frequency. It has a sampling rate of 100 Hz and can acquire complete seismic strain waveforms with precise and stable solid tide waveforms. It is small and light, with a reduced outer diameter of Φ89 mm for Φ100 mm drilling, a length of 1300 mm, and a weight of 45 kg for easy transport and installation. After 15 years of laboratory and field station testing, it obtained good monitoring data and demonstrated its highly sensitive seismic reflection capability. The observed response of the volumetric strain station in the northern section of Longmen Mountain to the 2010 Yushu earthquake and the 2023 Turkey earthquake shows that the TY-series high-precision volumetric strain gauge is not only a static strain gauge but also a broad-frequency strain seismograph with dynamic-static calibration capability. It has a unique advantage over pendulum seismometers in that it can observe both the long-term slow deformation and accumulation of deformation in the earth’s crust and the transient subtle features of crustal rupture and deformation. The long-term trends of the monitoring curves obtained from the Qingchuan–Hanzhong volumetric strain stations since the Wenchuan earthquake and the Guangzhou station since 2021 are consistent with the regional geological characteristics reflected by the seismic and tectonic geological data, indicating that the TY-2B volumetric strain gauge can meet the needs of geological scientific research and geological hazard observation.

| [1] |
ALLEN R V, 1972. A borehole tiltmeter for measurements at tidal sensitivity[J]. Bulletin of the Seismological Society of America, 62(3): 815-821. doi: 10.1785/BSSA0620030815
|
| [2] |
BAI J P, PENG H, MA X M, et al. , 2013. Hollow inclusion strain gauge geostress measuring instrument in deep borehole and its application example[J]. Chinese Journal of Rock Mechanics and Engineering, 32(5): 902-908. (in Chinese with English abstract)
|
| [3] |
BARBOUR A J, CROWELL B W, 2017. Dynamic strains for earthquake source characterization[J]. Seismological Research Letters, 88(2A): 354-370. doi: 10.1785/0220160155
|
| [4] |
BENIOFF H, 1935. A linear strain seismograph[J]. Bulletin of the Seismological Society of America, 25(4): 283-309. doi: 10.1785/BSSA0250040283
|
| [5] |
BENIOFF H, PRESS F, SMITH S, 1961. Excitation of the free oscillations of the earth by earthquakes[J]. Journal of Geophysical Research, 66(2): 605-619. doi: 10.1029/JZ066i002p00605
|
| [6] |
BONACCORSO A, LINDE A, CURRENTI G, et al. , 2016. The borehole dilatometer network of Mount Etna: A powerful tool to detect and infer volcano dynamics[J]. Journal of Geophysical Research: Solid Earth, 121(6): 4655-4669. doi: 10.1002/2016JB012914
|
| [7] |
EVERTSON D W, 1977. Borehole strainmeters for seismology[R]. Austin: Applied Research Lab.
|
| [8] |
FENG C J, LI B, LI H, et al. , 2022. Estimation of in-situ stress field surrounding the Namcha Barwa region and discussion on the tectonic stability[J]. Journal of Geomechanics, 28(6): 919-937. (in Chinese with English abstract)
|
| [9] |
FURUYA I, FUKUDOME A, 1986. Characteristics of borehole volume strainmeter and its application to seismology[J]. Journal of Physics of the Earth, 34(3): 257-296. doi: 10.4294/jpe1952.34.257
|
| [10] |
FURUYA I, YAMASATO H, SEINO M, 1991. Rayleigh waves recorded by the volumetric strainmeters at the time of a rather small volcanic eruption[J]. Papers in Meteorology and Geophysics, 42(3): 93-103. doi: 10.2467/mripapers.42.93
|
| [11] |
GLADWIN M T, 1984. High-precision multicomponent borehole deformation monitoring[J]. Review of Scientific Instruments, 55(12): 2011-2016. doi: 10.1063/1.1137704
|
| [12] |
HIKAWA H, SATO K, NIHEI S, et al. , 1983. Correction due to atmospheric pressure changes of data of borehole volume strainmeter[J]. Quarterly Journal of Seismology, 47: 91-111. (in Japanese)
|
| [13] |
KAMIGAICHI O, 1987. Physical considerations on the correction methods of volumetric strain and tilt data for the effects of atmospheric pressure change[J]. Quarterly Journal of Seismology, 50: 41-49. (in Japanese)
|
| [14] |
KIMURA K, TSUYUKI T, SUGANUMA I, et al. , 2015. Rainfall correction of volumetric strainmeter data by tank models[J]. Quarterly Journal of Seismology, 78: 93-158. (in Japanese)
|
| [15] |
LEE J S, 1976. Geomechanical method[M]. Beijing: Science Press. (in Chinese)
|
| [16] |
LI F Q, 1985. In-situ stress measurement[J]. Chinese Journal of Rock Mechanics and Engineering, 4(1): 95-111. (in Chinese)
|
| [17] |
LIAO C T, SHI Z X, 1983. In-situ stress measurements and their application to engineering design in the Jinchuan mine[J]. Chinese Journal of Rock Mechanics and Engineering, 2(1): 103-112. (in Chinese with English abstract)
|
| [18] |
LIAO C T, CUI M D, REN X F, et al. , 1985. In-situ Stress Measurements and Tectonic Stress Field in the Jinchuan Mine Area[M]. Beijing: Geological Publishing House. (in Chinese)
|
| [19] |
LINDE A T, GLADWIN M T, JOHNSTON M J S, et al. , 1996. A slow earthquake sequence on the San Andreas fault[J]. Nature, 383(6595): 65-68. doi: 10.1038/383065a0
|
| [20] |
LOU J S, TIAN J Y, 2022. Review on seismic strain-wave observation based on high-resolution borehole strainmeters[J]. Progress in Geophysics, 37(1): 51-58. (in Chinese with English abstract)
|
| [21] |
MENG W, TIAN T, SUN D S, et al. , 2022. Research on stress state in deep shale reservoirs based on in-situ stress measurement and rheological model[J]. Journal of Geomechanics, 28(4): 537-549. (in Chinese with English abstract)
|
| [22] |
PENG H, CUI W, MA X M, et al. , 2006b. Hydrofracturing in-situ stress measurements of the water diversion area in the first stage of the South-North Water Diversion Project (western line)[J]. Journal of Geomechanics, 12(2): 182-190. (in Chinese with English abstract)
|
| [23] |
PENG H, WU Z H, MA X M, 2006a. Unmanned in-situ stress monitoring stations along the Qinghai-Tibet railway[J]. Journal of Geomechanics, 12(1): 96-104. (in Chinese with English abstract)
|
| [24] |
PENG H, MA X M, JIANG J J, 2008. Analysis of the volume strain data from the Shandan in-situ stress monitoring station[J]. Journal of Geomechanics, 14(2): 97-108. (in Chinese with English abstract)
|
| [25] |
PENG H, MA X M, JIANG J J, 2009. Stability and stress measurement near the Qingchuan fault in the northern Longmen mountains[J]. Journal of Geomechanics, 15(2): 114-130. (in Chinese with English abstract)
|
| [26] |
PENG H, MA X M, JIANG J J, et al. , 2011a. Strain characteristics of WFSD stress stations and its co-seismic effects analysis: A case study upon Mw9.0 earthquake in Japan[J]. Journal of Geomechanics, 17(1): 1-14. (in Chinese with English abstract)
|
| [27] |
PENG H, MA X M, JIANG J J, et al. , 2011b. Research on stress field and hydraulic fracturing in-situ stress measurement of 1000 m deep hole in Zhaolou coal mine[J]. Chinese Journal of Rock Mechanics and Engineering, 30(8): 1638-1645. (in Chinese with English abstract)
|
| [28] |
QIU Z H, TANG L, ZHANG B H, et al. , 2012. Extracting anomaly of the Wenchuan earthquake from the dilatometer recording at NSH by means of wavelet-overrun rate analysis[J]. Chinese Journal of Geophysics, 55(2): 538-546. (in Chinese with English abstract)
|
| [29] |
QIU Z H, 2017. The observations of borehole strainmeters: theory and applications[M]. Beijing: Seismological Press: 1-407. (in Chinese)
|
| [30] |
QIU Z H, TANG L, ZHAO S X, et al. , 2020. Fundamental principle to determine seismic source moment tensor using strain seismographs[J]. Chinese Journal of Geophysics, 63(2): 551-561. (in Chinese with English abstract)
|
| [31] |
QUAN J J, LAI J S, CHEN S H, et al. , 2021. Analysis of observation quality and earthquake reflecting ability of borehole body strain meter at Xiaotao seismic station[J]. South China Journal of Seismology, 41(1): 26-33. (in Chinese with English abstract)
|
| [32] |
ROELOFFS E A, 2006. Evidence for aseismic deformation rate changes prior to earthquakes[J]. Annual Review of Earth and Planetary Sciences, 34: 591-627. doi: 10.1146/annurev.earth.34.031405.124947
|
| [33] |
SACKS I S, SUYEHIRO S, EVERTSON D W, 1971. Sacks-Evertson strainmeter, its installation in Japan and some preliminary results concerning strain steps[J]. Proceedings of the Japan Academy, 47(9): 707-712. doi: 10.2183/pjab1945.47.707
|
| [34] |
SACKS I S, LINDE A T, SUYEHIRO S, et al. , 1978. Slow earthquakes and stress redistribution[J]. Nature, 275(5681): 599-602. doi: 10.1038/275599a0
|
| [35] |
SU K Z, 1982. The working principle of liquid level volume strain gauge[J]. Seismological Research(4): 57-62. (in Chinese with English abstract)
|
| [36] |
SU K Z, LIU R M, PEI Y Z, 1993. Volume strain meters in China[J]. Inland Earthquake, 7(2): 151-157. (in Chinese with English abstract)
|
| [37] |
SU K Z, LI X H, ZHANG J, et al. , 2003a. Manufacture of TJ-2 volume strain meter[J]. Bulletin of the Institute of Crustal Dynamics, (4)113-121. (in Chinese)
|
| [38] |
SU K Z, LI H L, ZHANG J, et al. , 2003b. New progress in borehole strain observation[M]. Beijing: Seismological Press. (in Chinese)
|
| [39] |
SUN Y M, ZHA N, REN X, et al. , 2021. A review of application research on the borehole body strain gauge in earthquake precursory observation[J]. Seismological Research of Northeast China, 37(4): 69-74. (in Chinese with English abstract)
|
| [40] |
TAKANAMI T, LINDE A T, SACKS S I, et al. , 2013. Modeling of the post-seismic slip of the 2003 Tokachi-Oki earthquake M 8 off Hokkaido: Constraints from volumetric strain[J]. Earth, Planets and Space, 65(7): 731-738. doi: 10.5047/eps.2012.12.003
|
| [41] |
WANG L J, PAN L Z, LIAO C T, et al. , 1991. Geostress measurements and their application to engineering[M]. Beijing: Geological Publishing House. (in Chinese)
|
| [42] |
ZHANG L K, NIU A F, 2008. Borehole volume strainmeter conseismic change observation result in China[J]. Recent Developments in World Seismology(11): 120. (in Chinese)
|
| [43] |
ZHANG L K, WANG G C, NIU A F, 2011. Analysis on several factors of periodic air pressure wave affecting crustal strain field[J]. Acta Seismologica Sinica, 33(3): 351-361. (in Chinese with English abstract)
|
| [44] |
ZHANG L K, NIU A F, 2019. Theoretical solution of periodic pressure wave effect on crustal rock strain measurement[J]. Progress in Geophysics, 34(4): 1366-1370. (in Chinese with English abstract)
|
| [45] |
ZHOU L S, QIU Z H, TANG L, 2008. The response of crustal strain field to short-period atmospheric pressure variation[J]. Progress in Geophysics, 23(6): 1717-1726. (in Chinese with English abstract)
|
| [46] |
白金朋, 彭华, 马秀敏, 等, 2013. 深孔空心包体法地应力测量仪及其应用实例[J]. 岩石力学与工程学报, 32(5): 902-908. doi: 10.3969/j.issn.1000-6915.2013.05.007
|
| [47] |
丰成君, 李滨, 李惠, 等, 2022. 南迦巴瓦地区地应力场估算与构造稳定性探讨[J]. 地质力学学报, 28(6): 919-937. doi: 10.12090/j.issn.1006-6616.20222820
|
| [48] |
檜皮久義, 佐藤馨, 二瓶信一, 等, 1983. 埋込式体積歪言十の気圧補正[J]. 験震時報, 47: 91-111.
|
| [49] |
李方全, 1985. 地应力测量[J]. 岩石力学与工程学报, 4(1): 95-111.
|
| [50] |
李四光, 1976. 地质力学方法[M]. 北京: 科学出版社.
|
| [51] |
廖椿庭, 施兆贤, 1983. 金川矿区原岩应力实测及在矿山设计中的应用[J]. 岩石力学与工程学报, 2(1): 103-112.
|
| [52] |
廖椿庭, 崔鸣铎, 任希飞, 等, 1985. 金川矿区应力测量与构造应力场[M]. 北京: 地质出版社.
|
| [53] |
娄家墅, 田家勇, 2022. 基于高分辨率钻孔应变仪的地震应变波观测研究进展[J]. 地球物理学进展, 37(1): 51-58.
|
| [54] |
孟文, 田涛, 孙东生, 等, 2022. 基于原位地应力测试及流变模型的深部泥页岩储层地应力状态研究[J]. 地质力学学报, 28(4): 537-549.
|
| [55] |
木村一洋, 露木貴裕, 菅沼一成, 等, 2015. タンクモデルによる体積ひずみ計データの降水補正について[J]. 験震時報, 78: 93-158.
|
| [56] |
彭华, 崔巍, 马秀敏, 等, 2006b. 南水北调西线第一期工程调水区水压致裂地应力测量及其工程意义[J]. 地质力学学报, 12(2): 182-190.
|
| [57] |
彭华, 吴珍汉, 马秀敏, 2006a. 青藏铁路无人值守地应力综合监测站[J]. 地质力学学报, 12(1): 96-104.
|
| [58] |
彭华, 马秀敏, 姜景捷, 2008. 山丹地应力监测站体应变仪的地震效应[J]. 地质力学学报, 14(2): 97-108. doi: 10.3969/j.issn.1006-6616.2008.02.001
|
| [59] |
彭华, 马秀敏, 姜景捷, 2009. 龙门山北端青川断层附近应力测量与断层稳定性[J]. 地质力学学报, 15(2): 114-130.
|
| [60] |
彭华, 马秀敏, 姜景捷, 等, 2011a. WFSD地应力台应变特征及其同震效应分析: 以日本MW9.0级特大地震为例[J]. 地质力学学报, 17(1): 1-14.
|
| [61] |
彭华, 马秀敏, 姜景捷, 等, 2011b. 赵楼煤矿1000m深孔水压致裂地应力测量及其应力场研究[J]. 岩石力学与工程学报, 30(8): 1638-1645.
|
| [62] |
邱泽华, 唐磊, 张宝红, 等, 2012. 用小波-超限率分析提取宁陕台汶川地震体应变异常[J]. 地球物理学报, 55(2): 538-546.
|
| [63] |
邱泽华, 2017. 钻孔应变观测理论和应用[M]. 北京: 地震出版社: 1-407.
|
| [64] |
邱泽华, 唐磊, 赵树贤, 等, 2020. 用应变地震观测求解震源矩张量的基本原理[J]. 地球物理学报, 63(2): 551-561. doi: 10.6038/cjg2020M0609
|
| [65] |
全建军, 赖见深, 陈珊桦, 等, 2021. 小陶地震台钻孔体应变仪观测质量与映震能力分析[J]. 华南地震, 41(1): 26-33. doi: 10.13512/j.hndz.2021.01.04
|
| [66] |
上垣内修, 1987. 体積歪, 傾斜デ-タに対する気圧の影響の補正に関する物理的考察[J]. 験震時報, 50: 41-49.
|
| [67] |
苏恺之, 1982. 液位型体积式应变仪的工作原理[J]. 地震科学研究(4): 57-62.
|
| [68] |
苏恺之, 刘瑞民, 裴玉珍, 1993. 中国的三种体积式应变仪[J]. 内陆地震, 7(2): 151-157.
|
| [69] |
苏恺之, 李秀环, 张钧, 等, 2003a. TJ-2型体应变仪的研制[J]. 地壳构造与地壳应力文集, (15)113-121.
|
| [70] |
苏恺之, 李海亮, 张钧, 等, 2003b. 钻孔地应变观测新进展[M]. 北京: 地震出版社.
|
| [71] |
孙艺玫, 查楠, 任雪, 等, 2021. 钻孔体应变仪在地震前兆观测中的理论和应用研究综述[J]. 防灾减灾学报, 37(4): 69-74. doi: 10.13693/j.cnki.cn21-1573.2021.04.011
|
| [72] |
王连捷, 潘立宙, 廖椿庭, 等, 1991. 地应力测量及其在工程中的应用[M]. 北京: 地质出版社.
|
| [73] |
张凌空, 牛安福, 2008. 中国钻孔体应变仪同震变化观测结果[J]. 国际地震动态(11): 120.
|
| [74] |
张凌空, 王广才, 牛安福, 2011. 周期气压波对地壳应变场观测影响的若干因素分析[J]. 地震学报, 33(3): 351-361. doi: 10.3969/j.issn.0253-3782.2011.03.008
|
| [75] |
张凌空, 牛安福, 2019. 周期气压波对地壳岩石应变测量影响的理论解[J]. 地球物理学进展, 34(4): 1366-1370. doi: 10.6038/pg2019CC0244
|
| [76] |
周龙寿, 邱泽华, 唐磊, 2008. 地壳应变场对气压短周期变化的响应[J]. 地球物理学进展, 23(6): 1717-1726.
|
Figures(11) / Tables(2)
Website Copyright © Journal of Geomechanics 京ICP备18031784号 Total visits:
Supported by:
Beijing Renhe Information Technology Co., Ltd.


 DownLoad: