

Study on the influence of in-situ stress changes on shale fracture propagation considering the effect of effective stress coefficients
-
摘要: 页岩气水平井多段压裂裂缝形态受地层三向应力分布影响,单井应力剖面是预测压裂缝高的重要依据,有效应力系数(Biot系数)及纵向网格分辨率均会影响应力剖面解释结果,进而影响缝高预测的准确性。文章采用不同Biot系数(常值及随测井变化函数)与不同纵向网格分辨率计算应力剖面,模拟分析不同应力剖面下平面三维裂缝形态差异,系统总结Biot系数对应力剖面及裂缝形态的影响规律,并进行纵向网格分辨率及Biot解释方法优选。结果显示:随着Biot系数降低,地层应力纵剖面变化幅度增大,水力裂缝纵向扩展能力受到抑制;提高压裂模型纵向网格分辨率有助于减小应力极值影响范围,1 m纵向网格分辨率下模拟效率与精度达到较好平衡;采用经验公式及孔弹性模型计算Biot系数所得结果相近,与室内实验结果误差为3.68%~3.93%,能更好匹配不同层位应力试验结果,且模拟缝高相较于Biot常值更接近实际井缝高监测结果,与同井位直改平井微地震监测缝高误差为8.64%~9.94%。由初始地应力拟合效果及后续模拟缝高与监测结果匹配程度可以看出,选取合理的Biot系数能更真实预测地应力分布及裂缝扩展形态。通过深入讨论Biot系数及纵向网格分辨率对应力剖面及裂缝形态影响,可为后续页岩气井应力分布计算及压裂缝高预测提供参考。Abstract:
Objective The geometry of multi-stage hydraulic fractures in shale gas horizontal wells is influenced by the three-dimensional in-situ stress distribution. The single-well stress profile serves as a crucial basis for predicting fracture height, and both the effective stress coefficient (Biot's coefficient) and the vertical grid resolution significantly impact the interpreted stress profile, consequently affecting the accuracy of fracture height prediction. Methods This study employs different Biot's coefficients (constant values and functions varying with logs) and vertical grid resolutions to compute stress profiles. It simulates and analyzes the differences in planar 3D fracture geometries under various stress profiles, systematically investigating the influence of Biot's coefficient on the stress profile and fracture geometry, and subsequently optimizing the vertical grid resolution and the method for interpreting Biot's coefficient. Results The results indicate that as Biot's coefficient decreases, the variation amplitude of the vertical in-situ stress profile increases, thereby restricting the vertical propagation capability of hydraulic fractures. Increasing the vertical grid resolution in the fracturing model helps to reduce the influence range of stress extremes; a 1 m vertical grid resolution achieves a favorable balance between simulation efficiency and accuracy. The Biot's coefficients calculated using empirical formulas and the poroelastic model yield similar results, with errors relative to laboratory measurements ranging from 3.68% to 3.93%. These methods provide a better match to stress test results from different formations. Furthermore, the simulated fracture heights using these variable coefficients align more closely with actual downhole fracture height monitoring results compared to using a constant Biot's value, showing errors of 8.64% to 9.94% compared to microseismic monitoring results from a vertical-to-horizontal well at the same site. Conclusions Through the analysis of initial in-situ stress fitting accuracy and the subsequent correspondence between simulated fracture height and monitoring data, it can be concluded that selecting an appropriate Biot's coefficient enables more realistic predictions of in-situ stress distribution and fracture propagation geometry. [Significance] This study provides valuable insights for future stress distribution calculations and fracture height predictions in shale gas wells through an in-depth discussion on the effects of Biot's coefficient and vertical grid resolution. -
Key words:
- shale gas /
- hydraulic fracturing /
- in-situ stress profile /
- Biot coefficient /
- fracture height
-
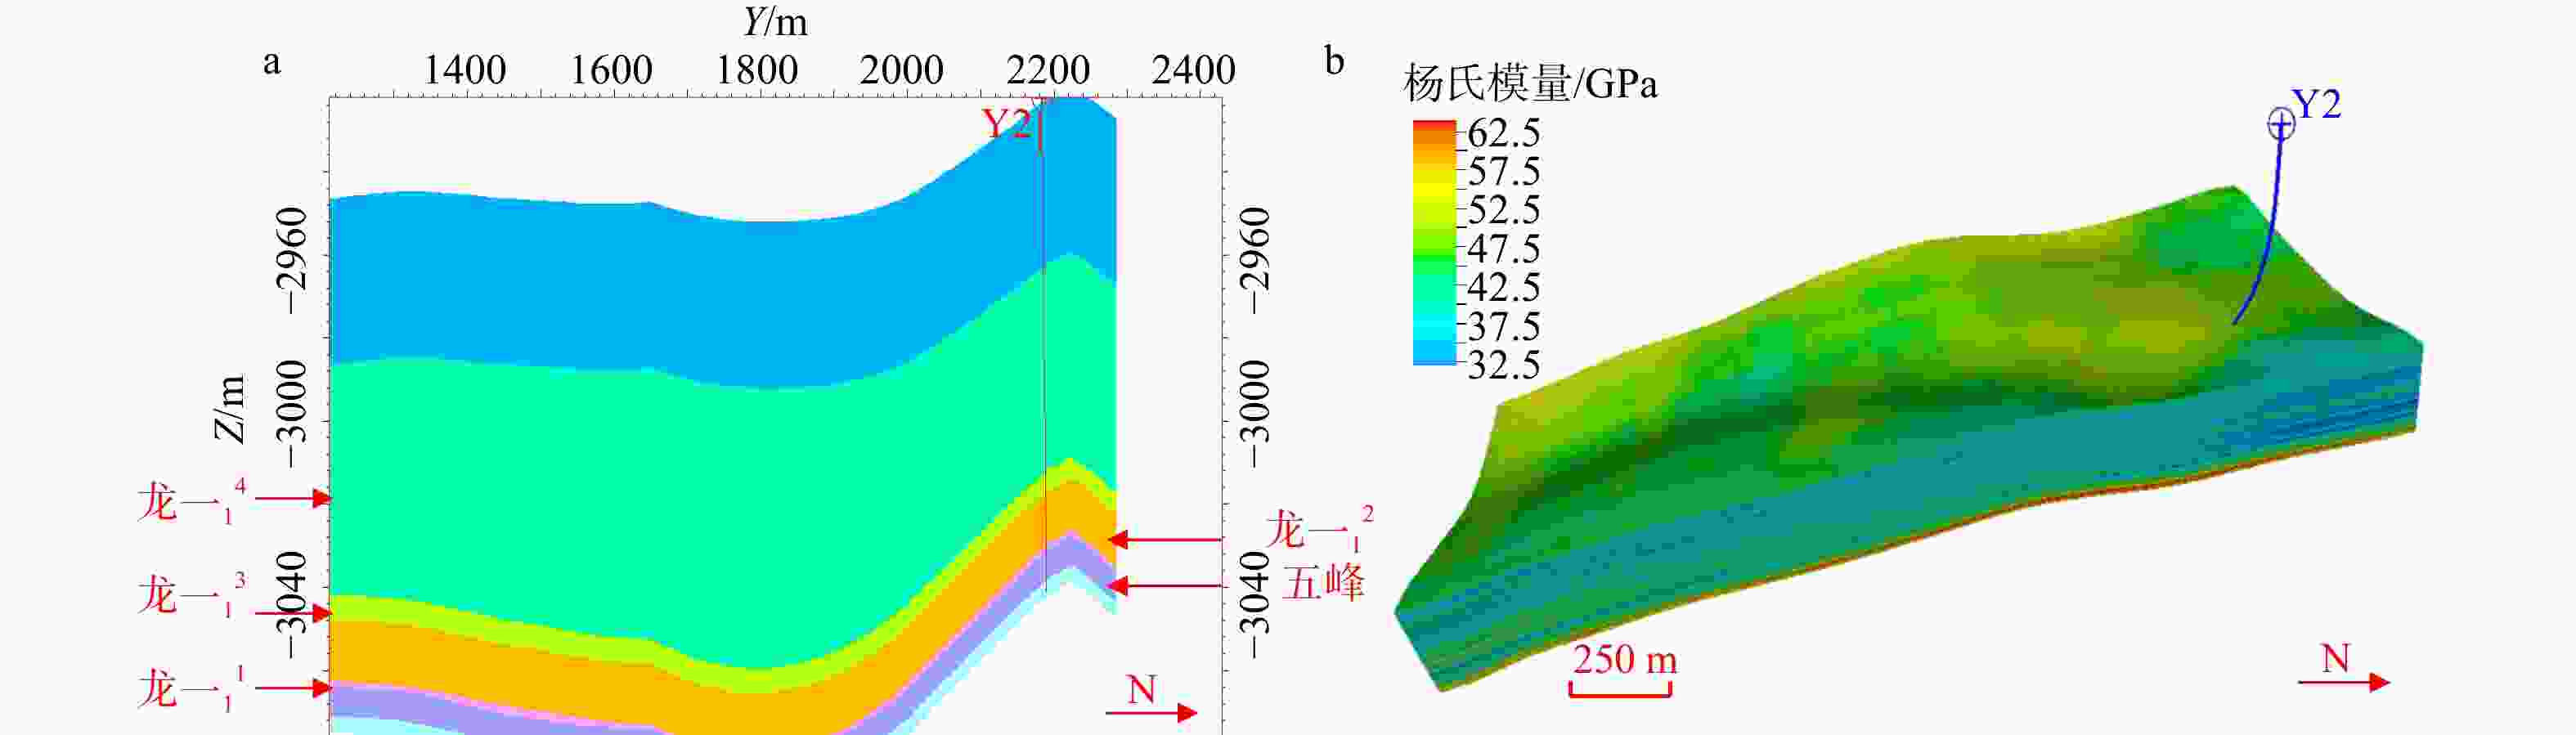
图 1 Y2导眼井实际平台地质模型
a—Y2导眼井穿过层位示意图;b—Y2直改平井杨氏模量
Figure 1. Geological model of the actual platform for Y2 pilot well
(a) Schematic diagram of the pilot well Y2 penetrating formations; (b) Young's modulus profile of the vertical-to-horizontal well Y2
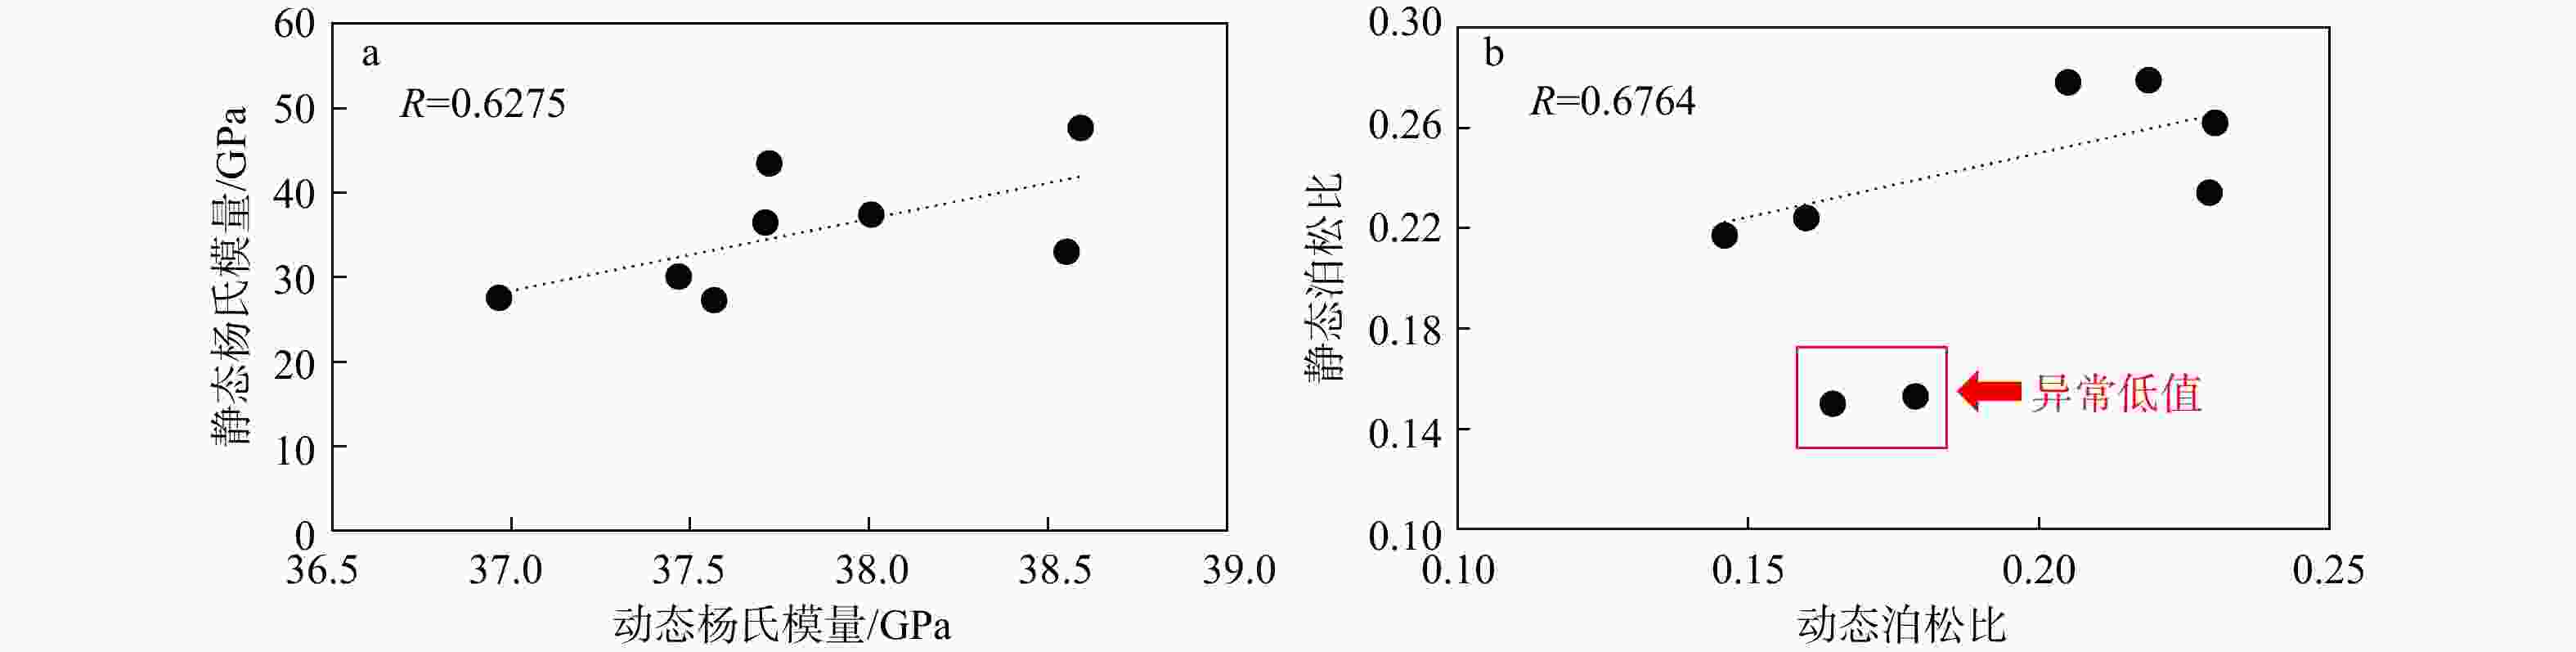
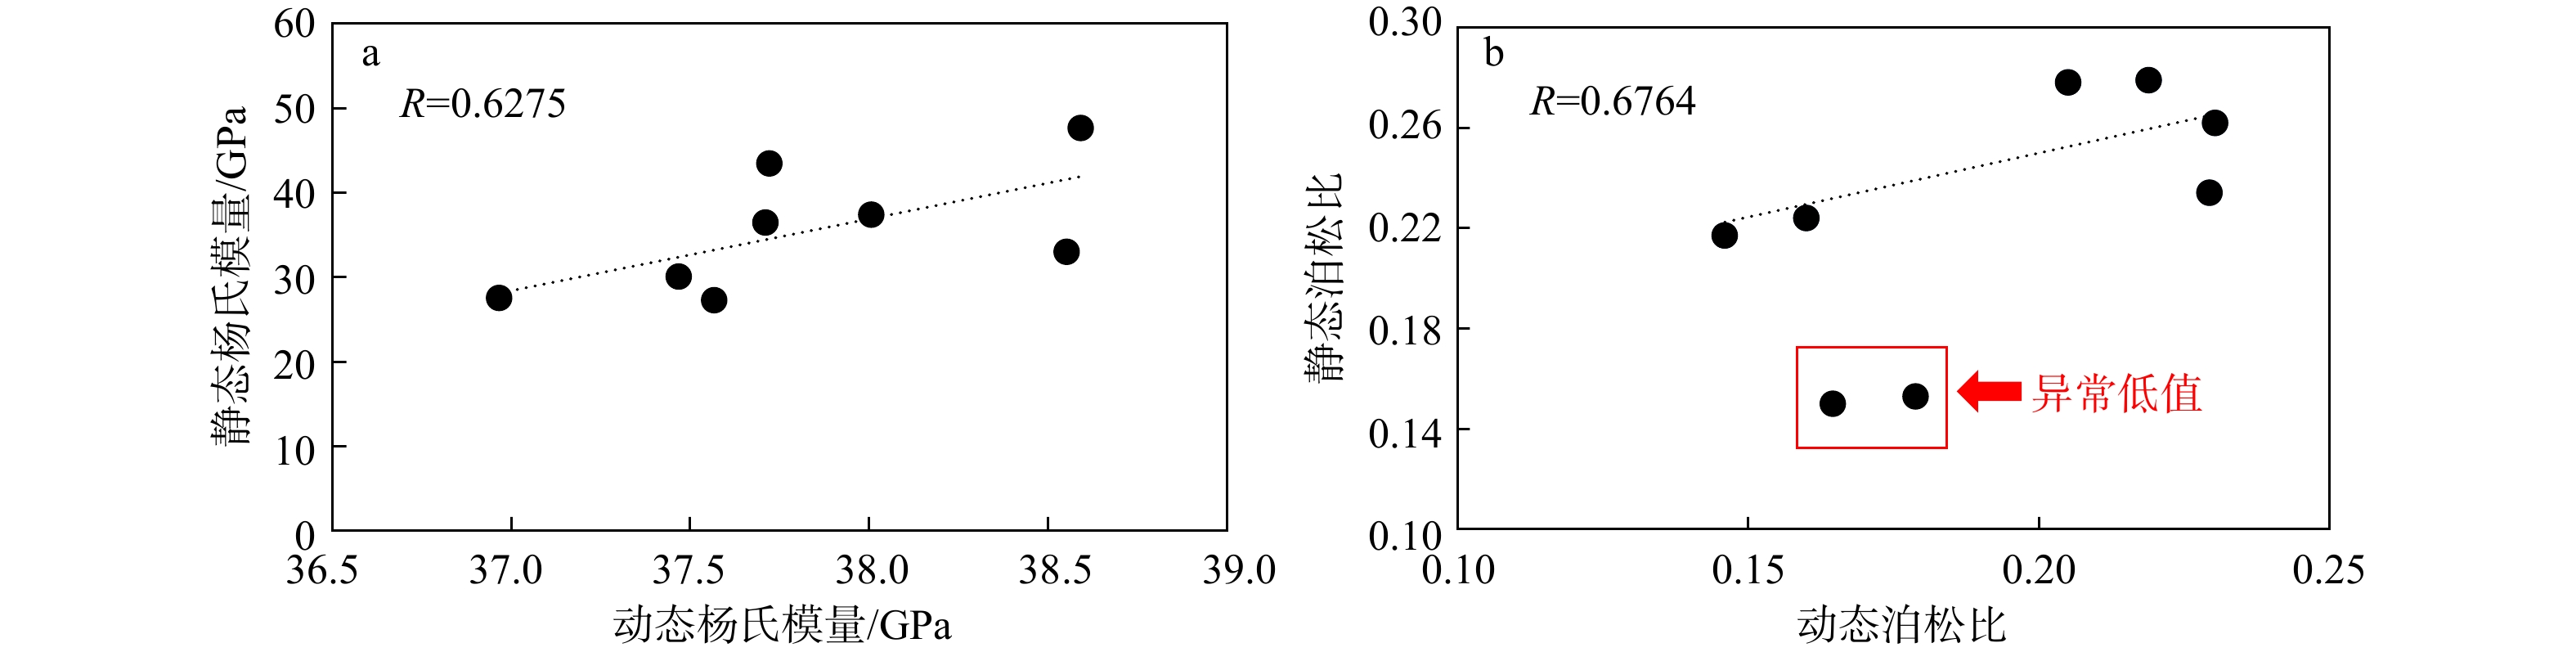
图 2 动、静态杨氏模量泊松比转换关系拟合
a—动、静态杨氏模量转换关系拟合;b—动、静态泊松比转换关系拟合
Figure 2. Fitting of Conversion Relationships between Dynamic and Static Young's Moduli and Poisson's Ratios
(a) Fitting of dynamic-to-static Young's modulus conversion relationship; (b) Fitting of dynamic-to-static Poisson's ratio conversion relationship
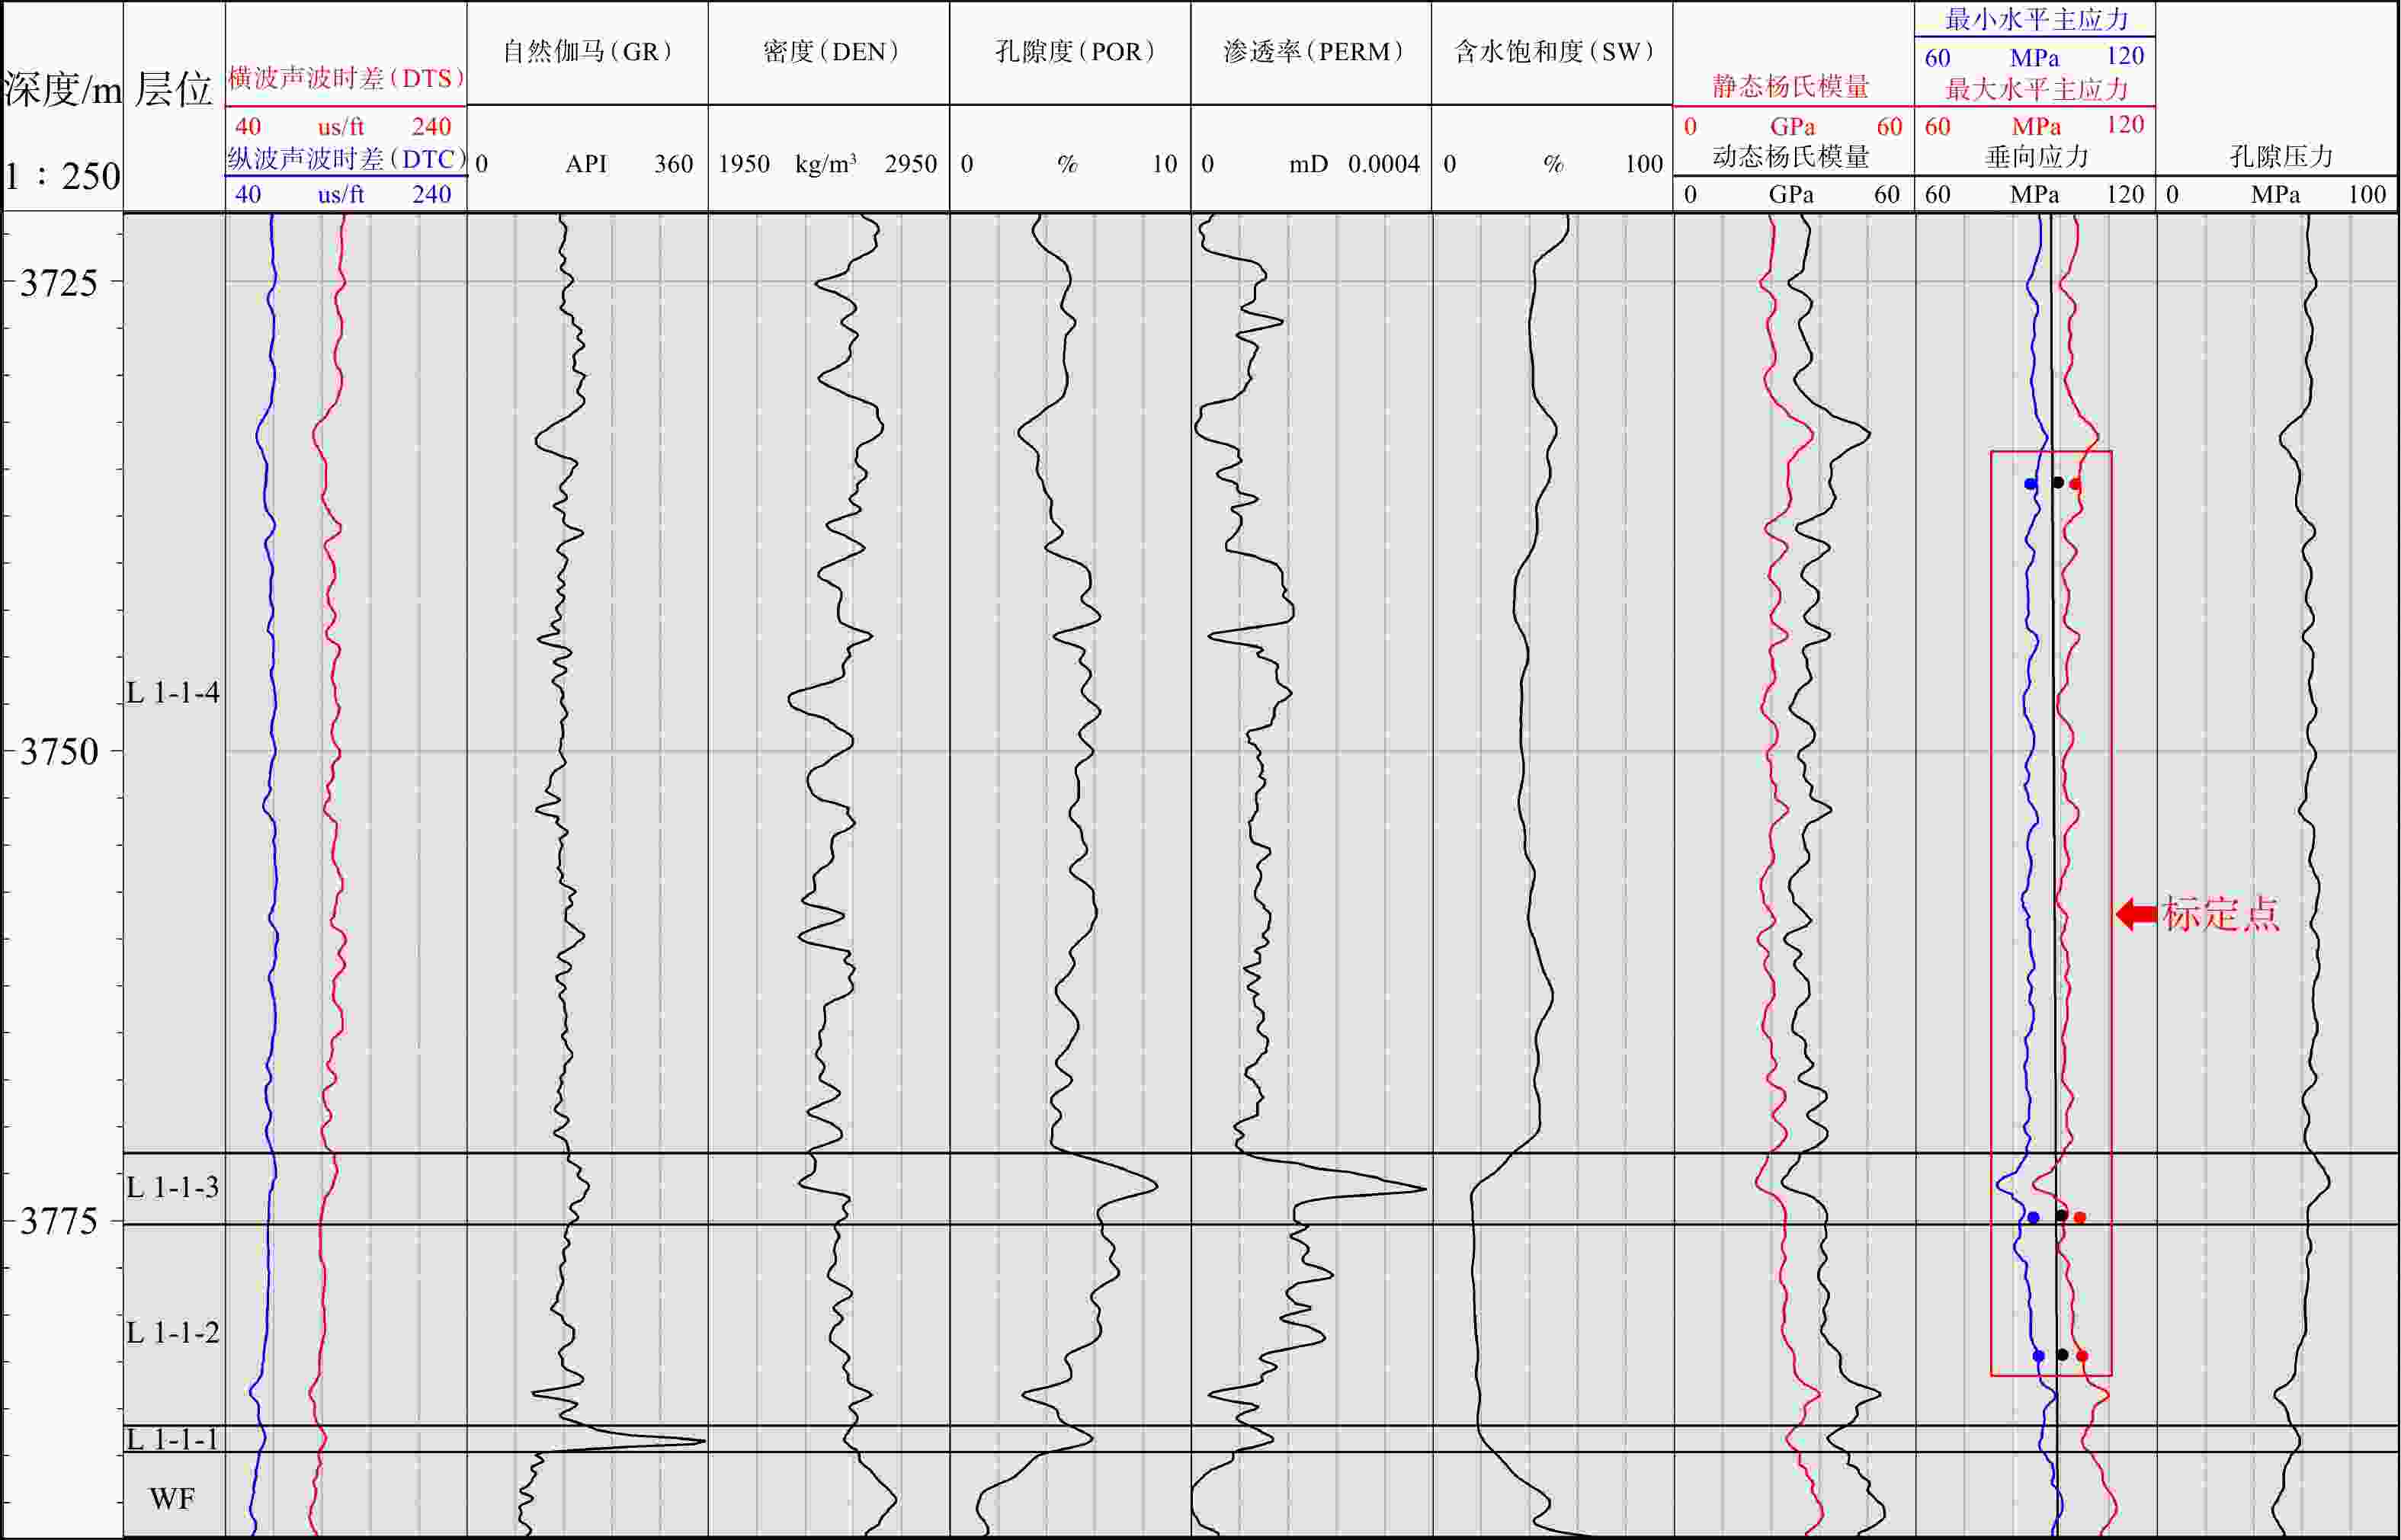
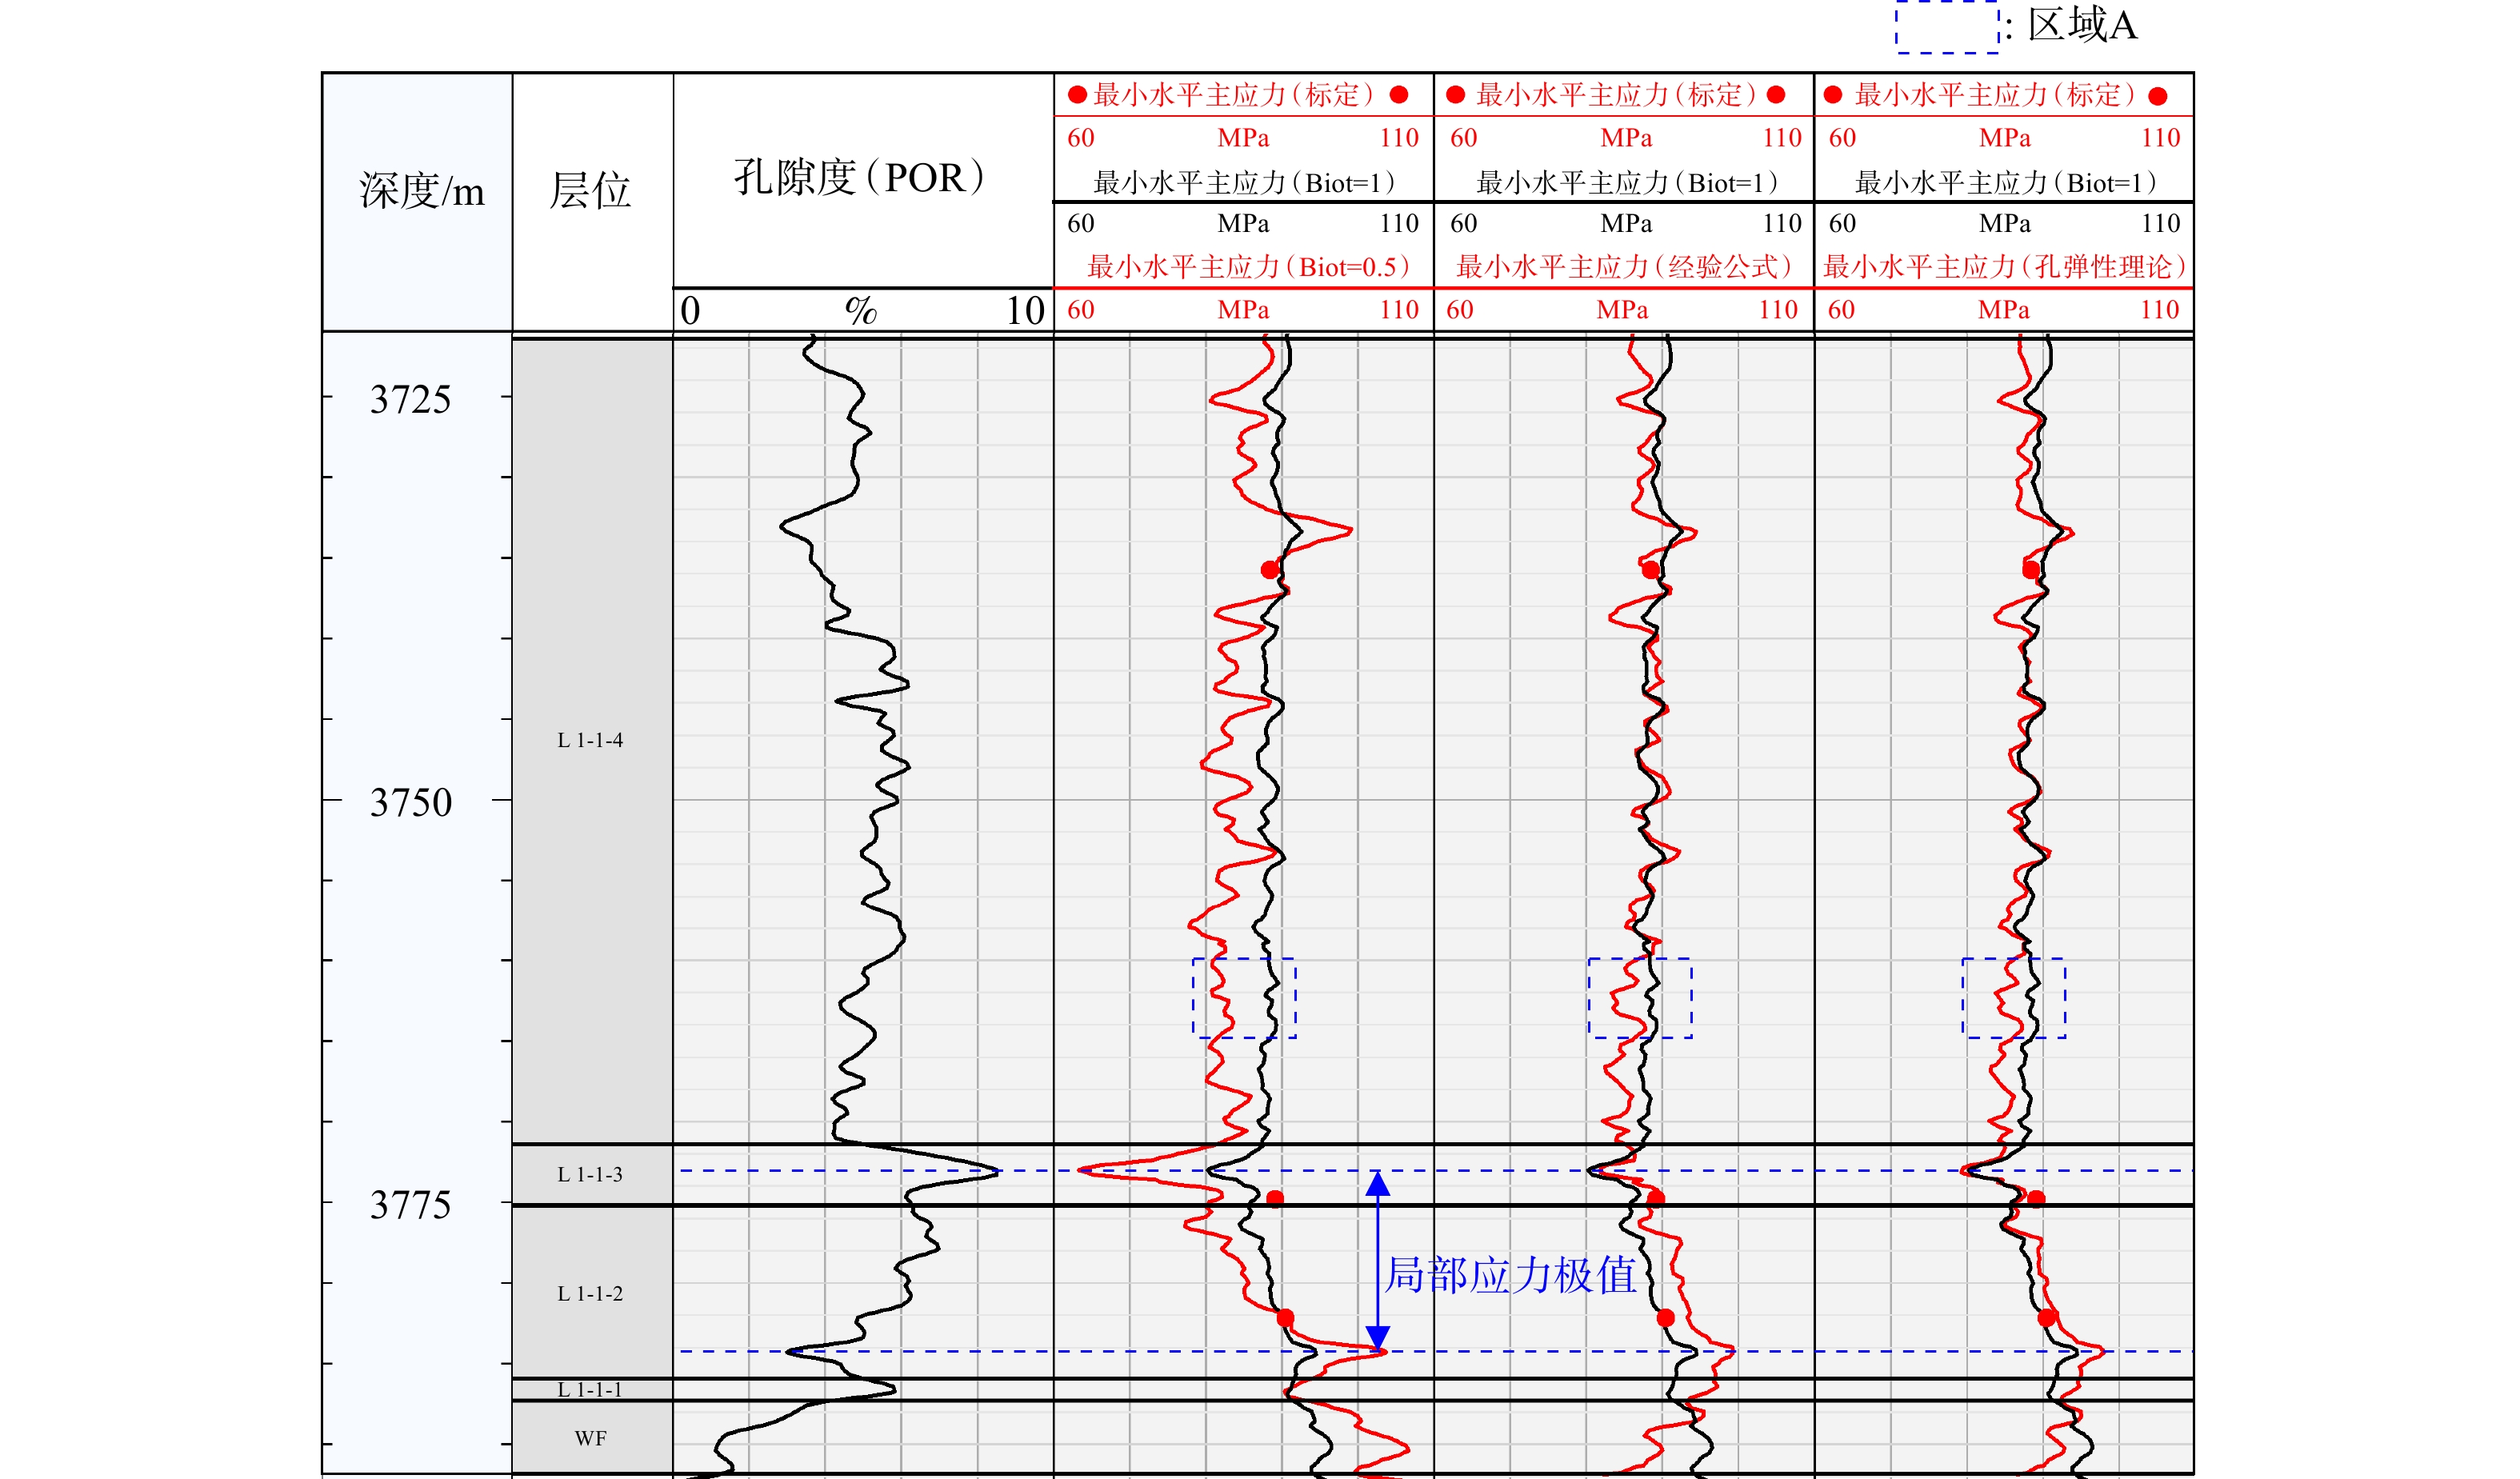
图 3 Y2井一维地质力学结果
L 1-1-4—龙一段1亚段4小层;L 1-1-3—龙一段1亚段3小层;L 1-1-2—龙一段1亚段2小层;L 1-1-1—龙一段1亚段1小层;WF—五峰组
Figure 3. 1D Geomechanical results of well Y2
L 1-1-4—4th Bed of 1st Submember, Long 1 Member; L 1-1-3—3rd Bed of 1st Submember, Long 1 Member; L 1-1-2—2nd Bed of 1st Submember, Long 1 Member; L 1-1-1—1st Bed of 1st Submember, Long 1 Member; WF—Wufeng Formation
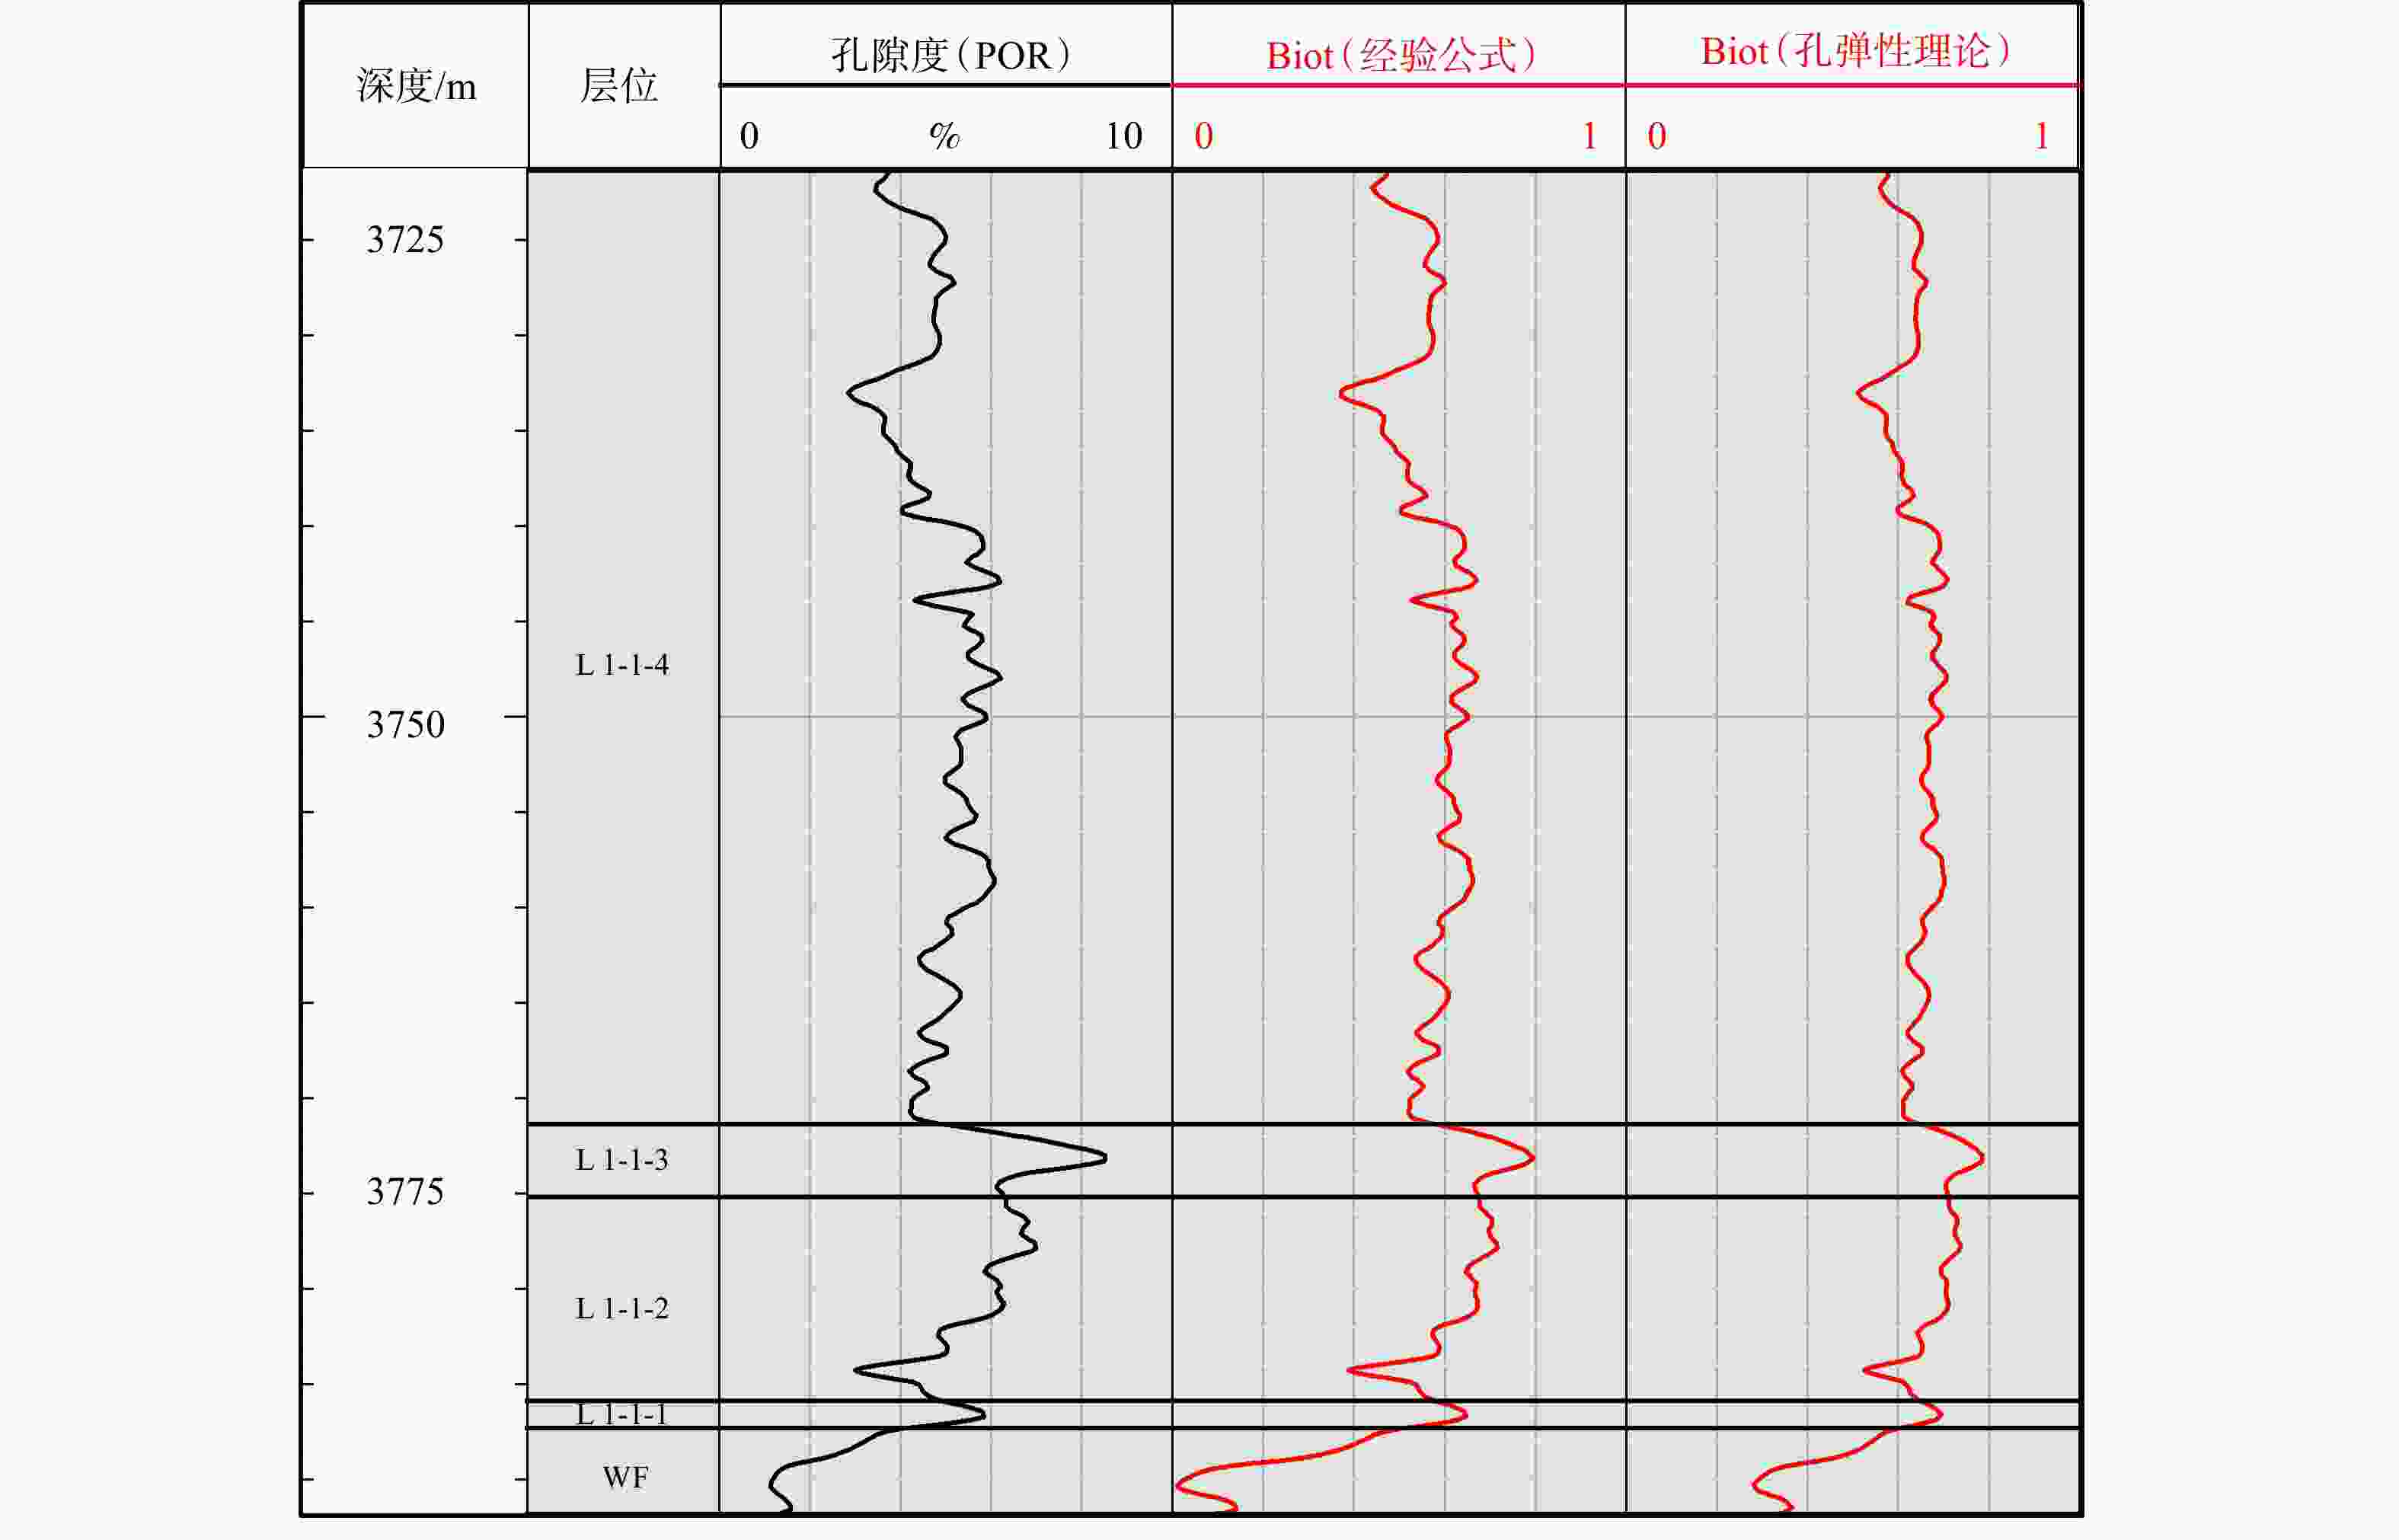
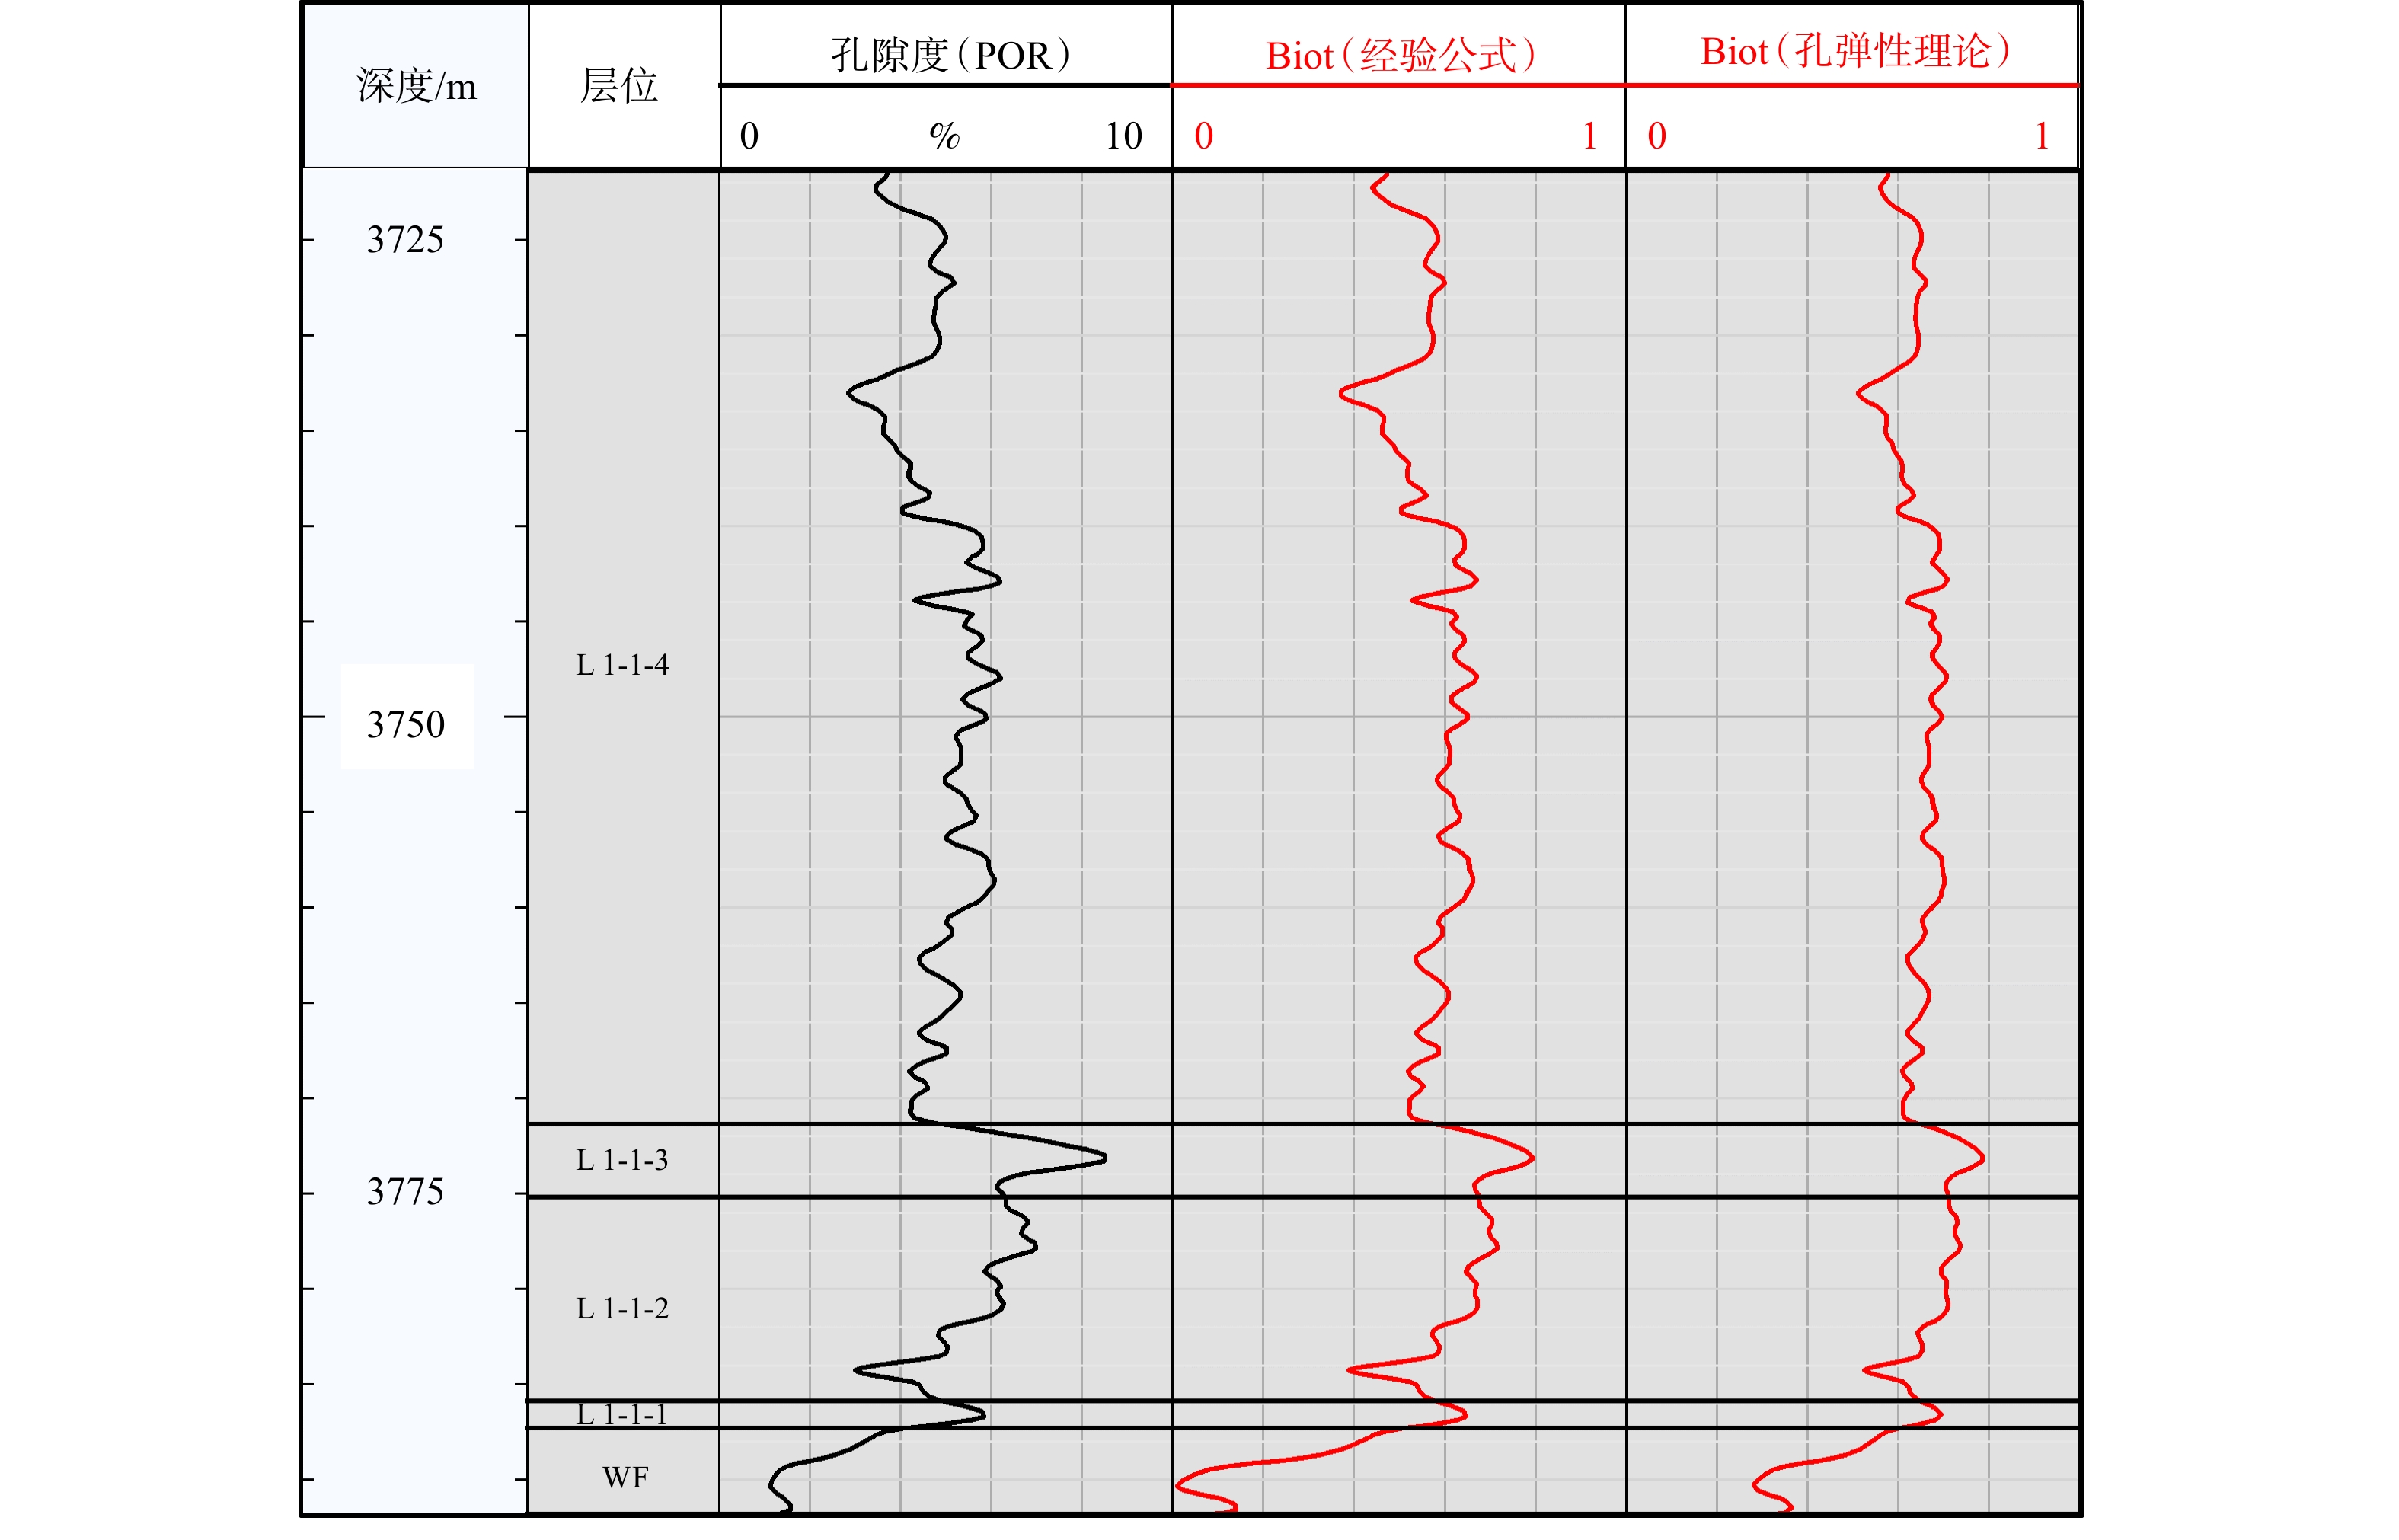
图 4 变Biot系数曲线
L 1-1-4—龙一段1亚段4小层;L 1-1-3—龙一段1亚段3小层;L 1-1-2—龙一段1亚段2小层;L 1-1-1—龙一段1亚段1小层;WF—五峰组
Figure 4. Variable Biot coefficient curve
L 1-1-4—4th Bed of 1st Submember, Long 1 Member; L 1-1-3—3rd Bed of 1st Submember, Long 1 Member; L 1-1-2—2nd Bed of 1st Submember, Long 1 Member; L 1-1-1—1st Bed of 1st Submember, Long 1 Member; WF—Wufeng Formation
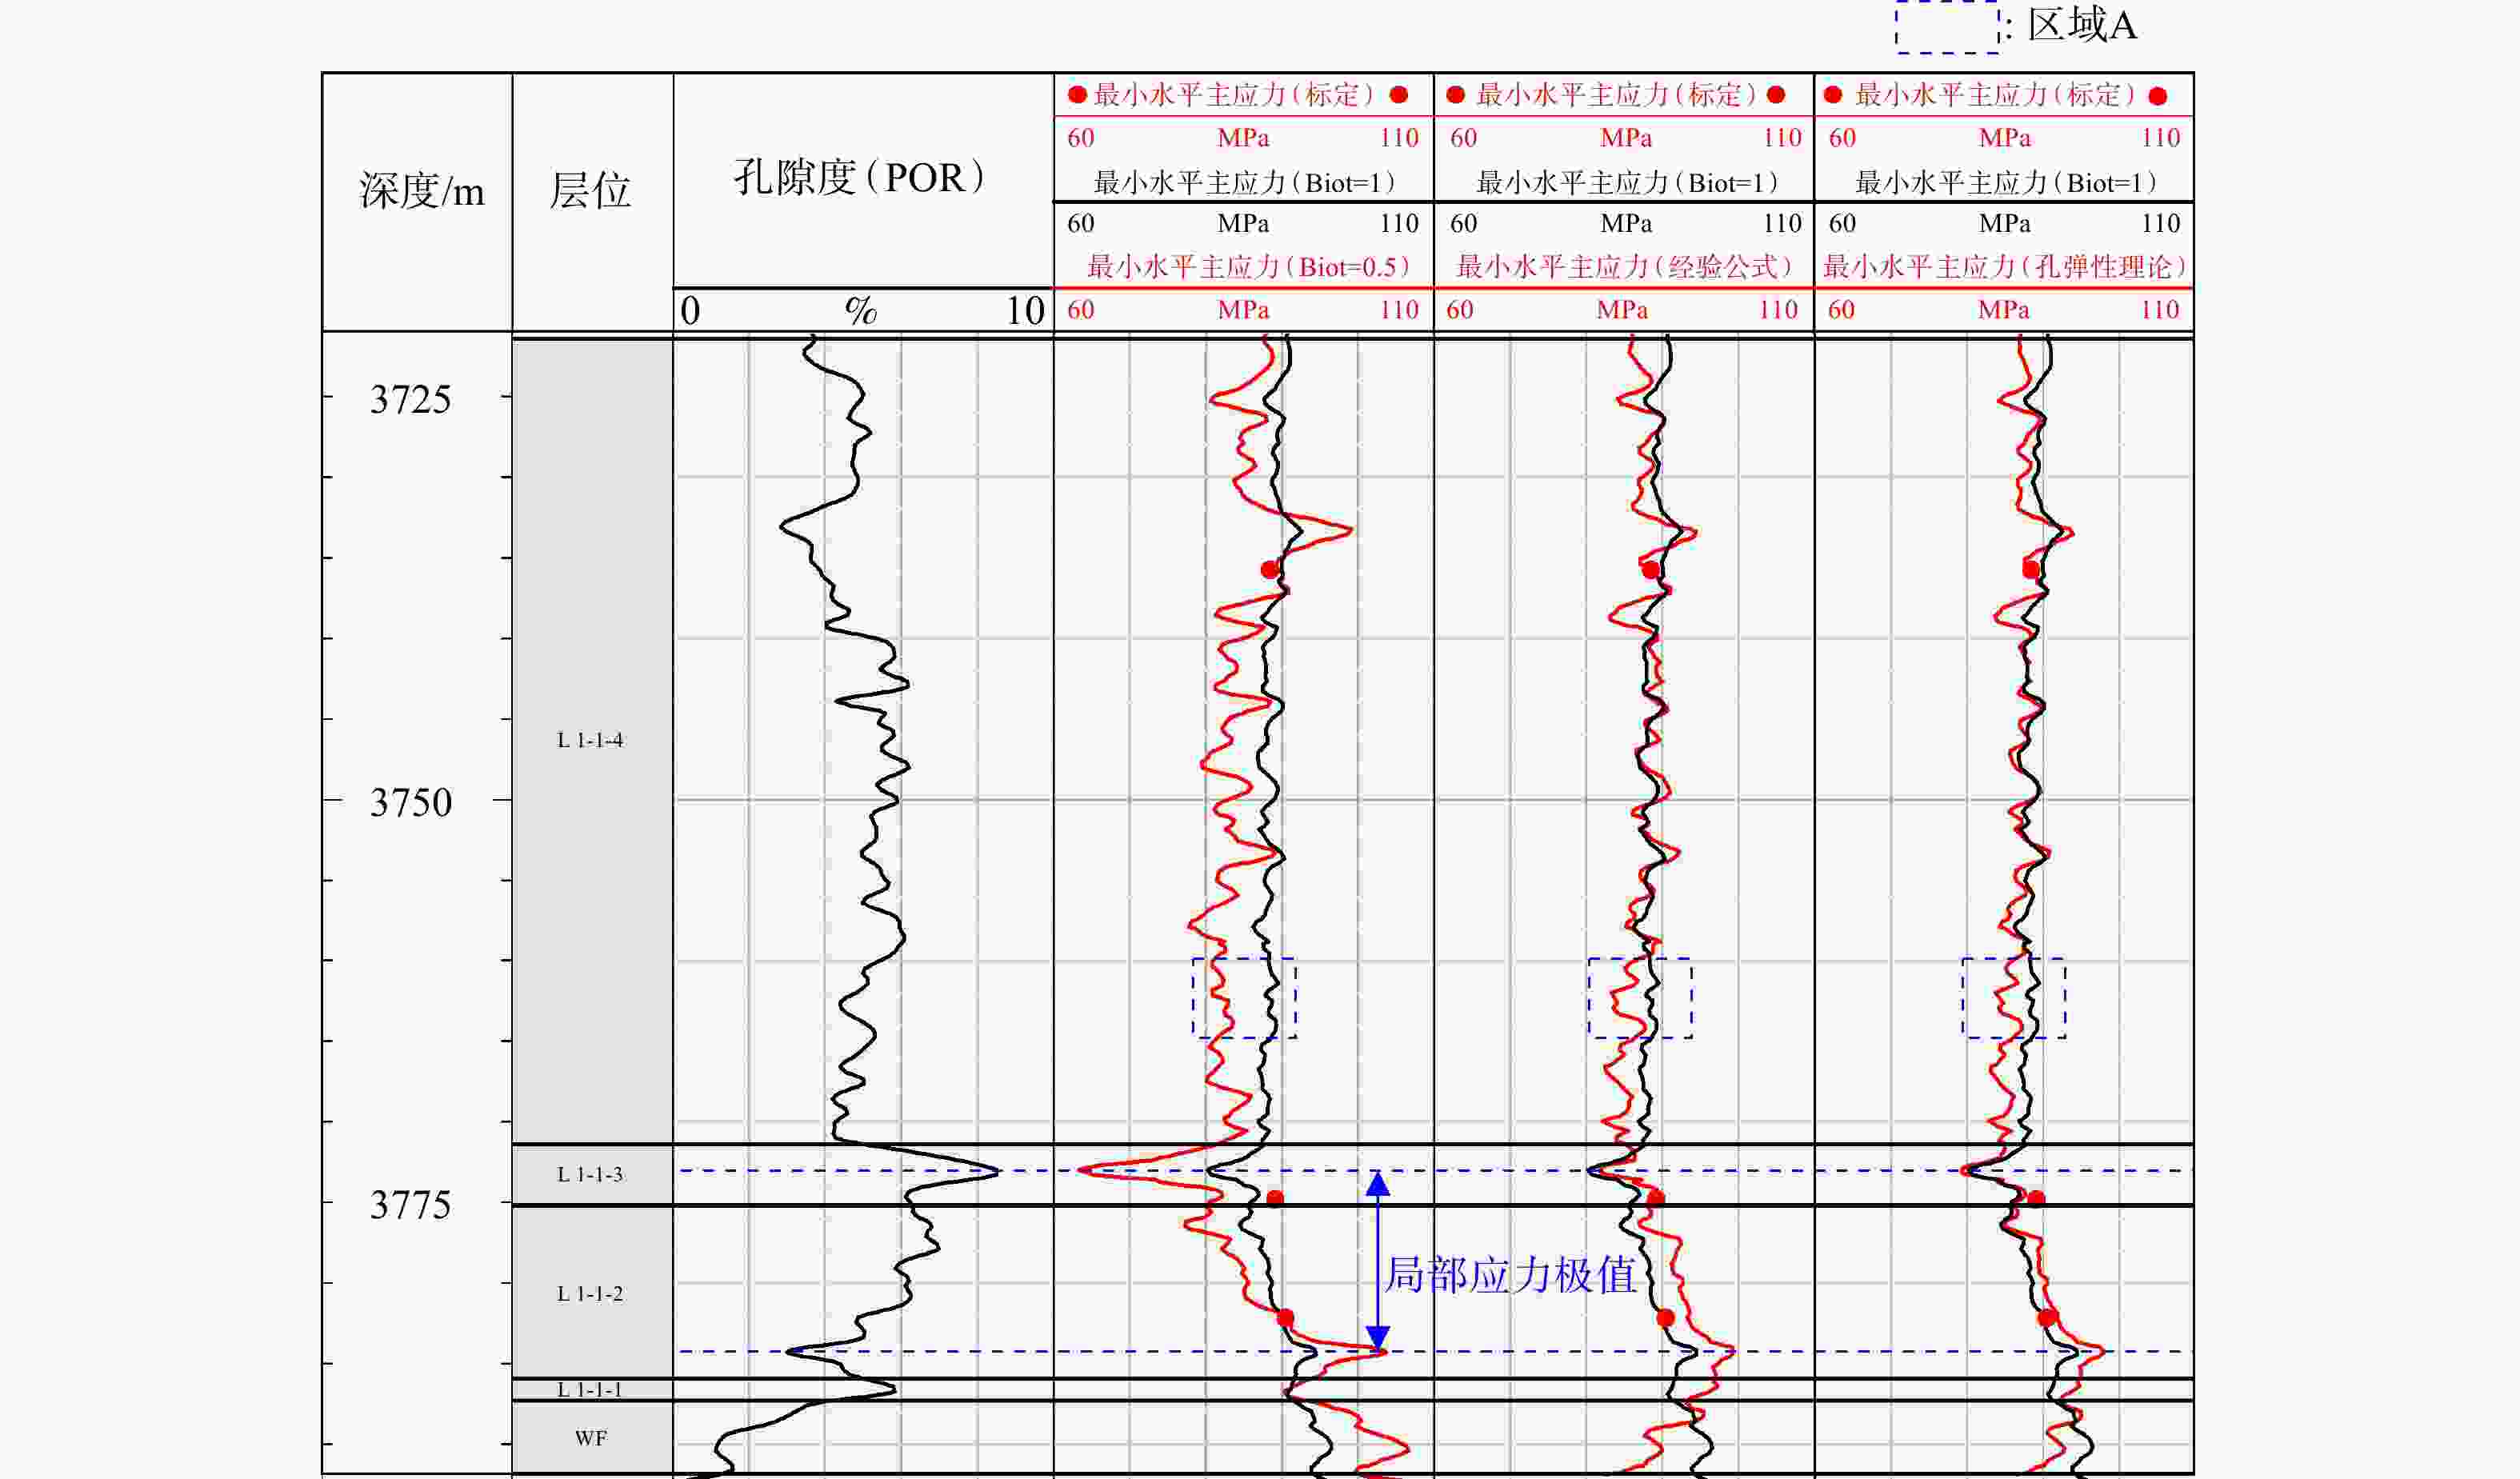
图 5 不同Biot系数计算方法对应最小水平主应力垂向分布
L 1-1-4—龙一段1亚段4小层;L 1-1-3—龙一段1亚段3小层;L 1-1-2—龙一段1亚段2小层;L 1-1-1—龙一段1亚段1小层;WF—五峰组
Figure 5. Vertical distribution of minimum horizontal principal stress corresponding to different biot coefficient calculation methods
L 1-1-4—4th Bed of 1st Submember, Long 1 Member; L 1-1-3—3rd Bed of 1st Submember, Long 1 Member; L 1-1-2—2nd Bed of 1st Submember, Long 1 Member; L 1-1-1—1st Bed of 1st Submember, Long 1 Member; WF—Wufeng Formation

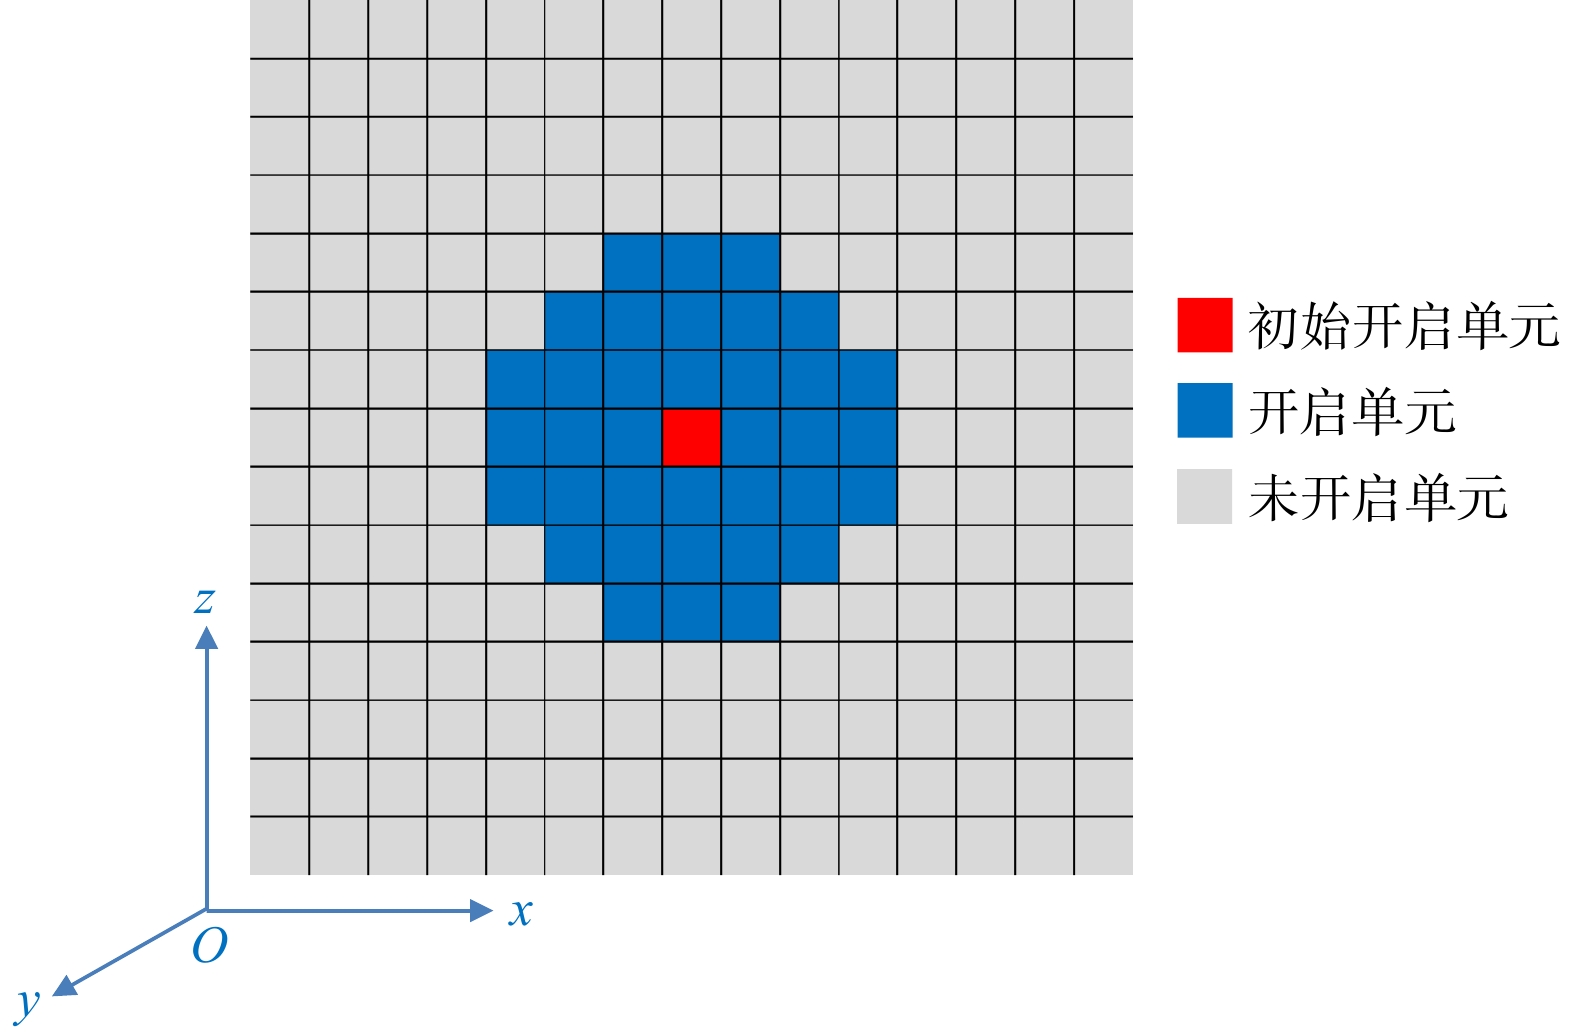
图 6 裂缝扩展网格系统及单元划分示意图
Figure 6. Diagram of the fracture propagation grid system and element discretization
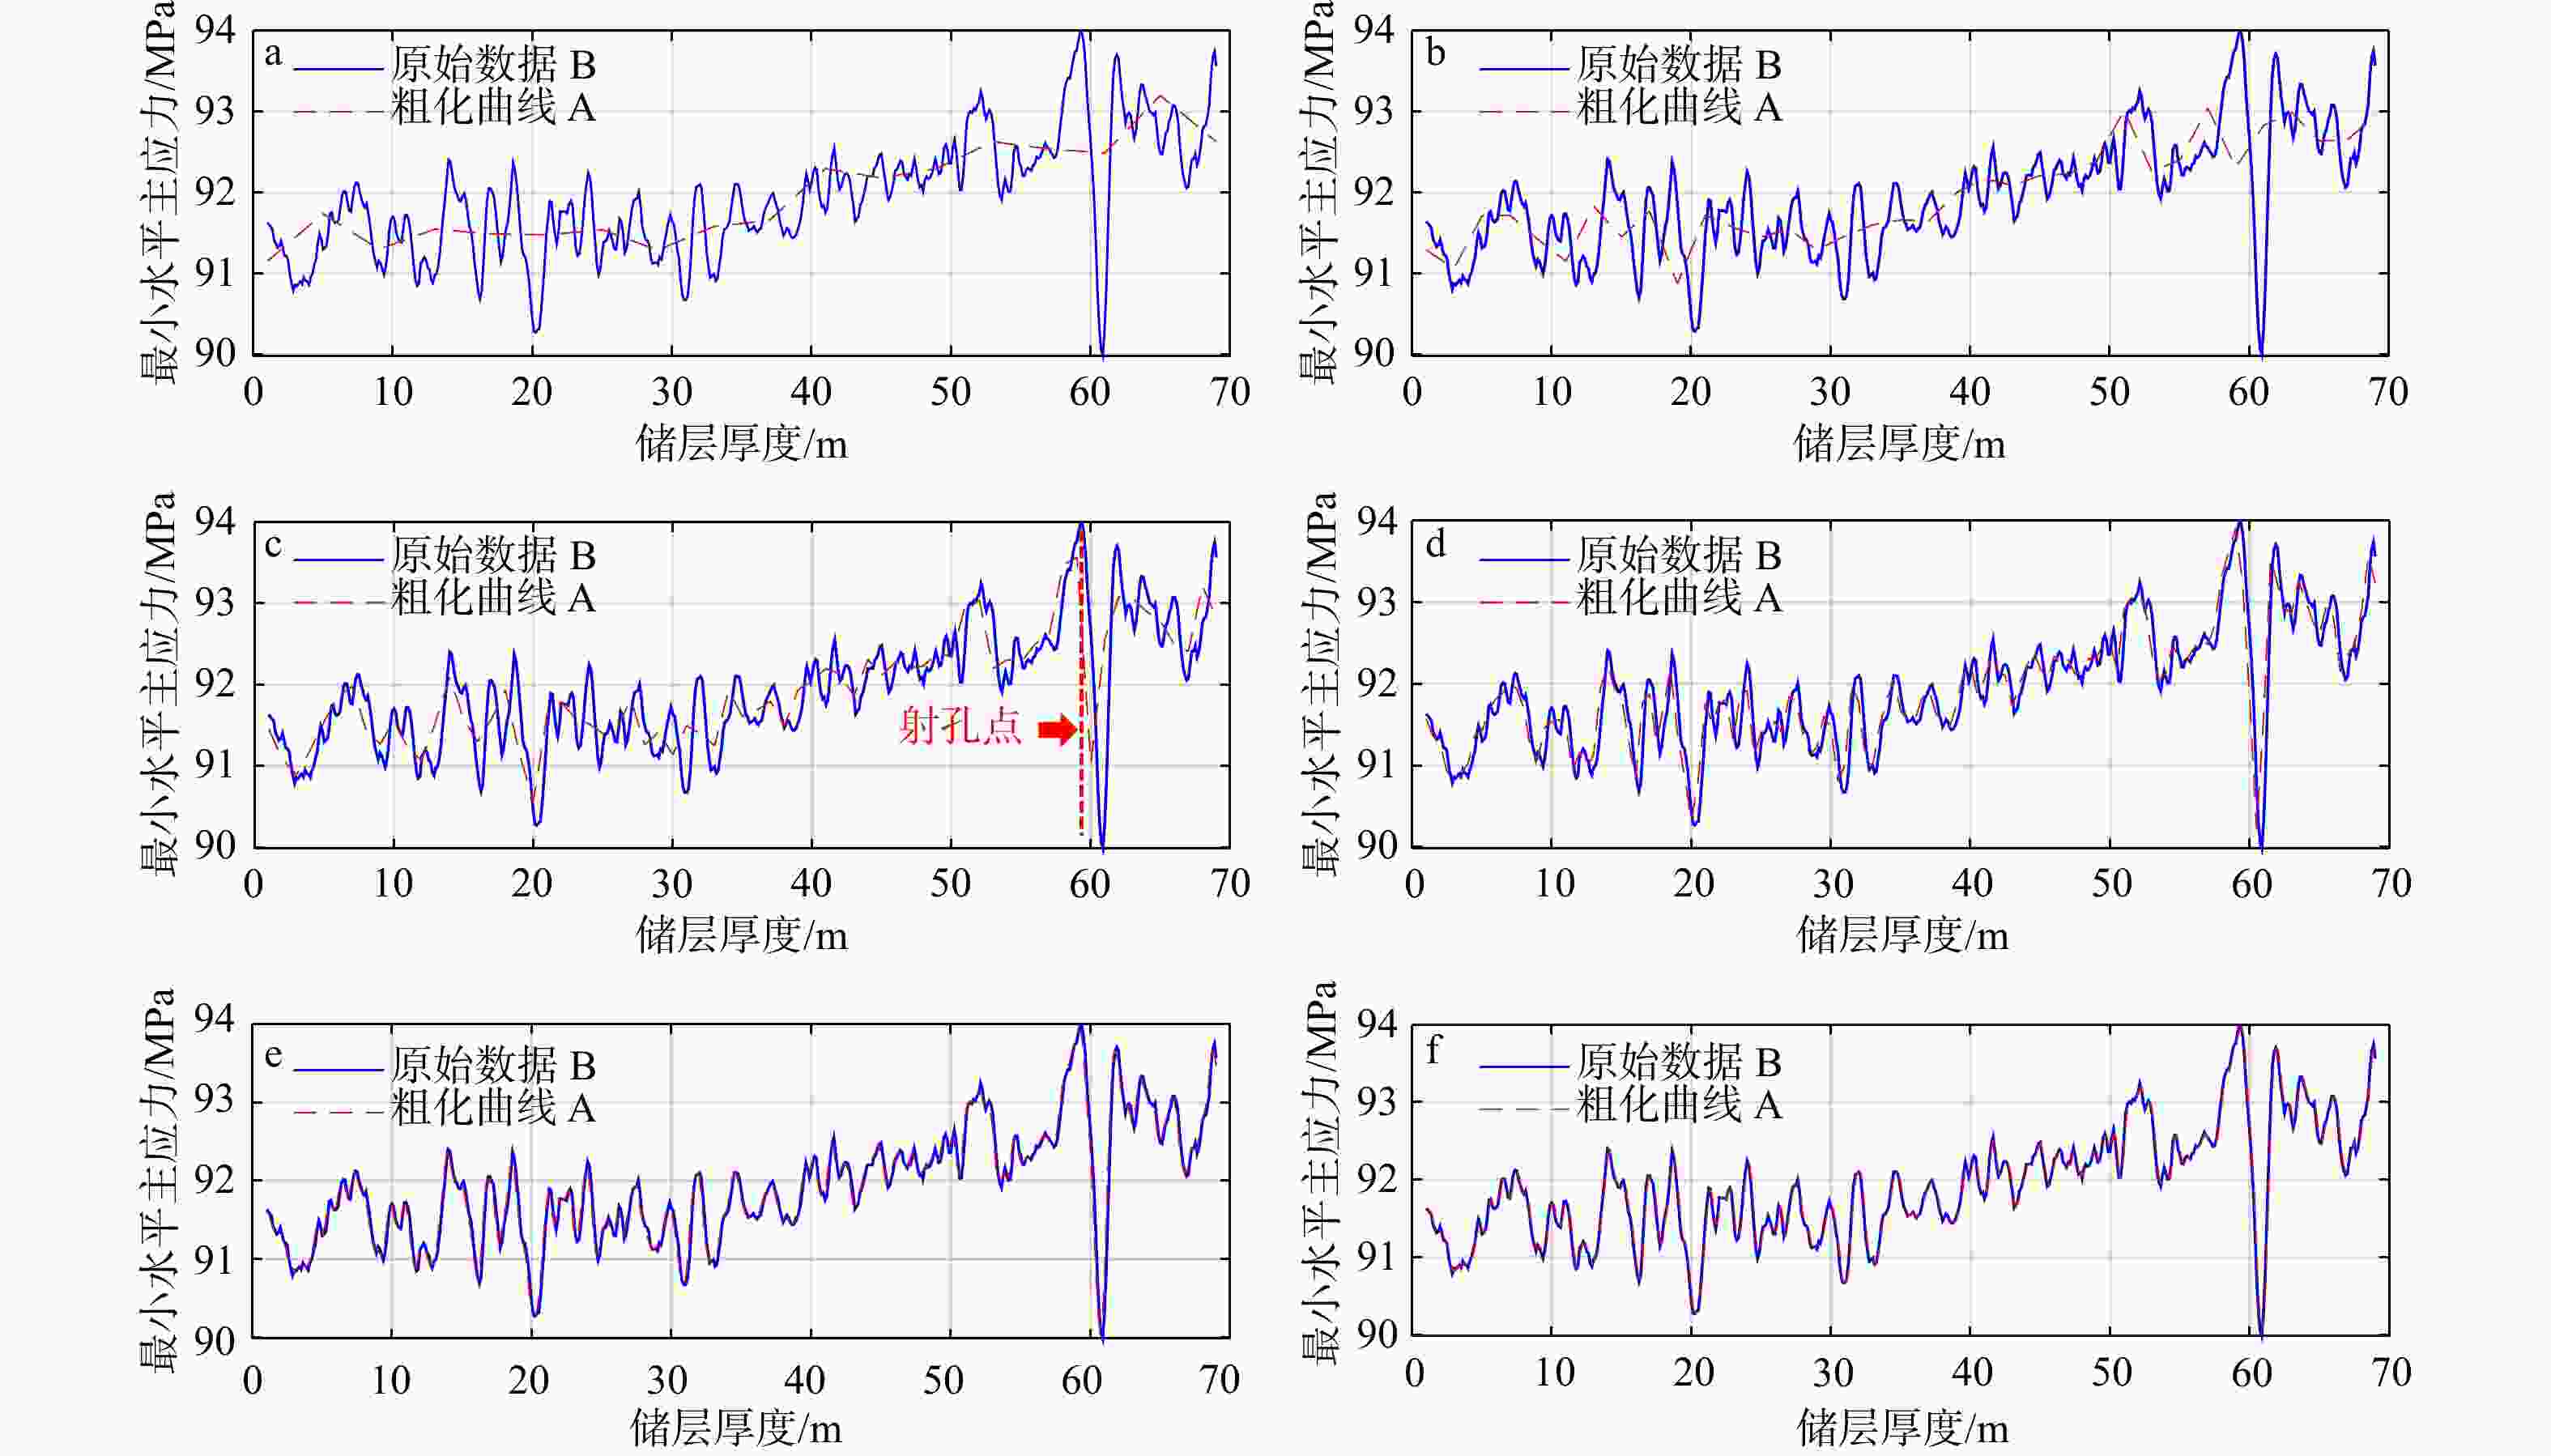
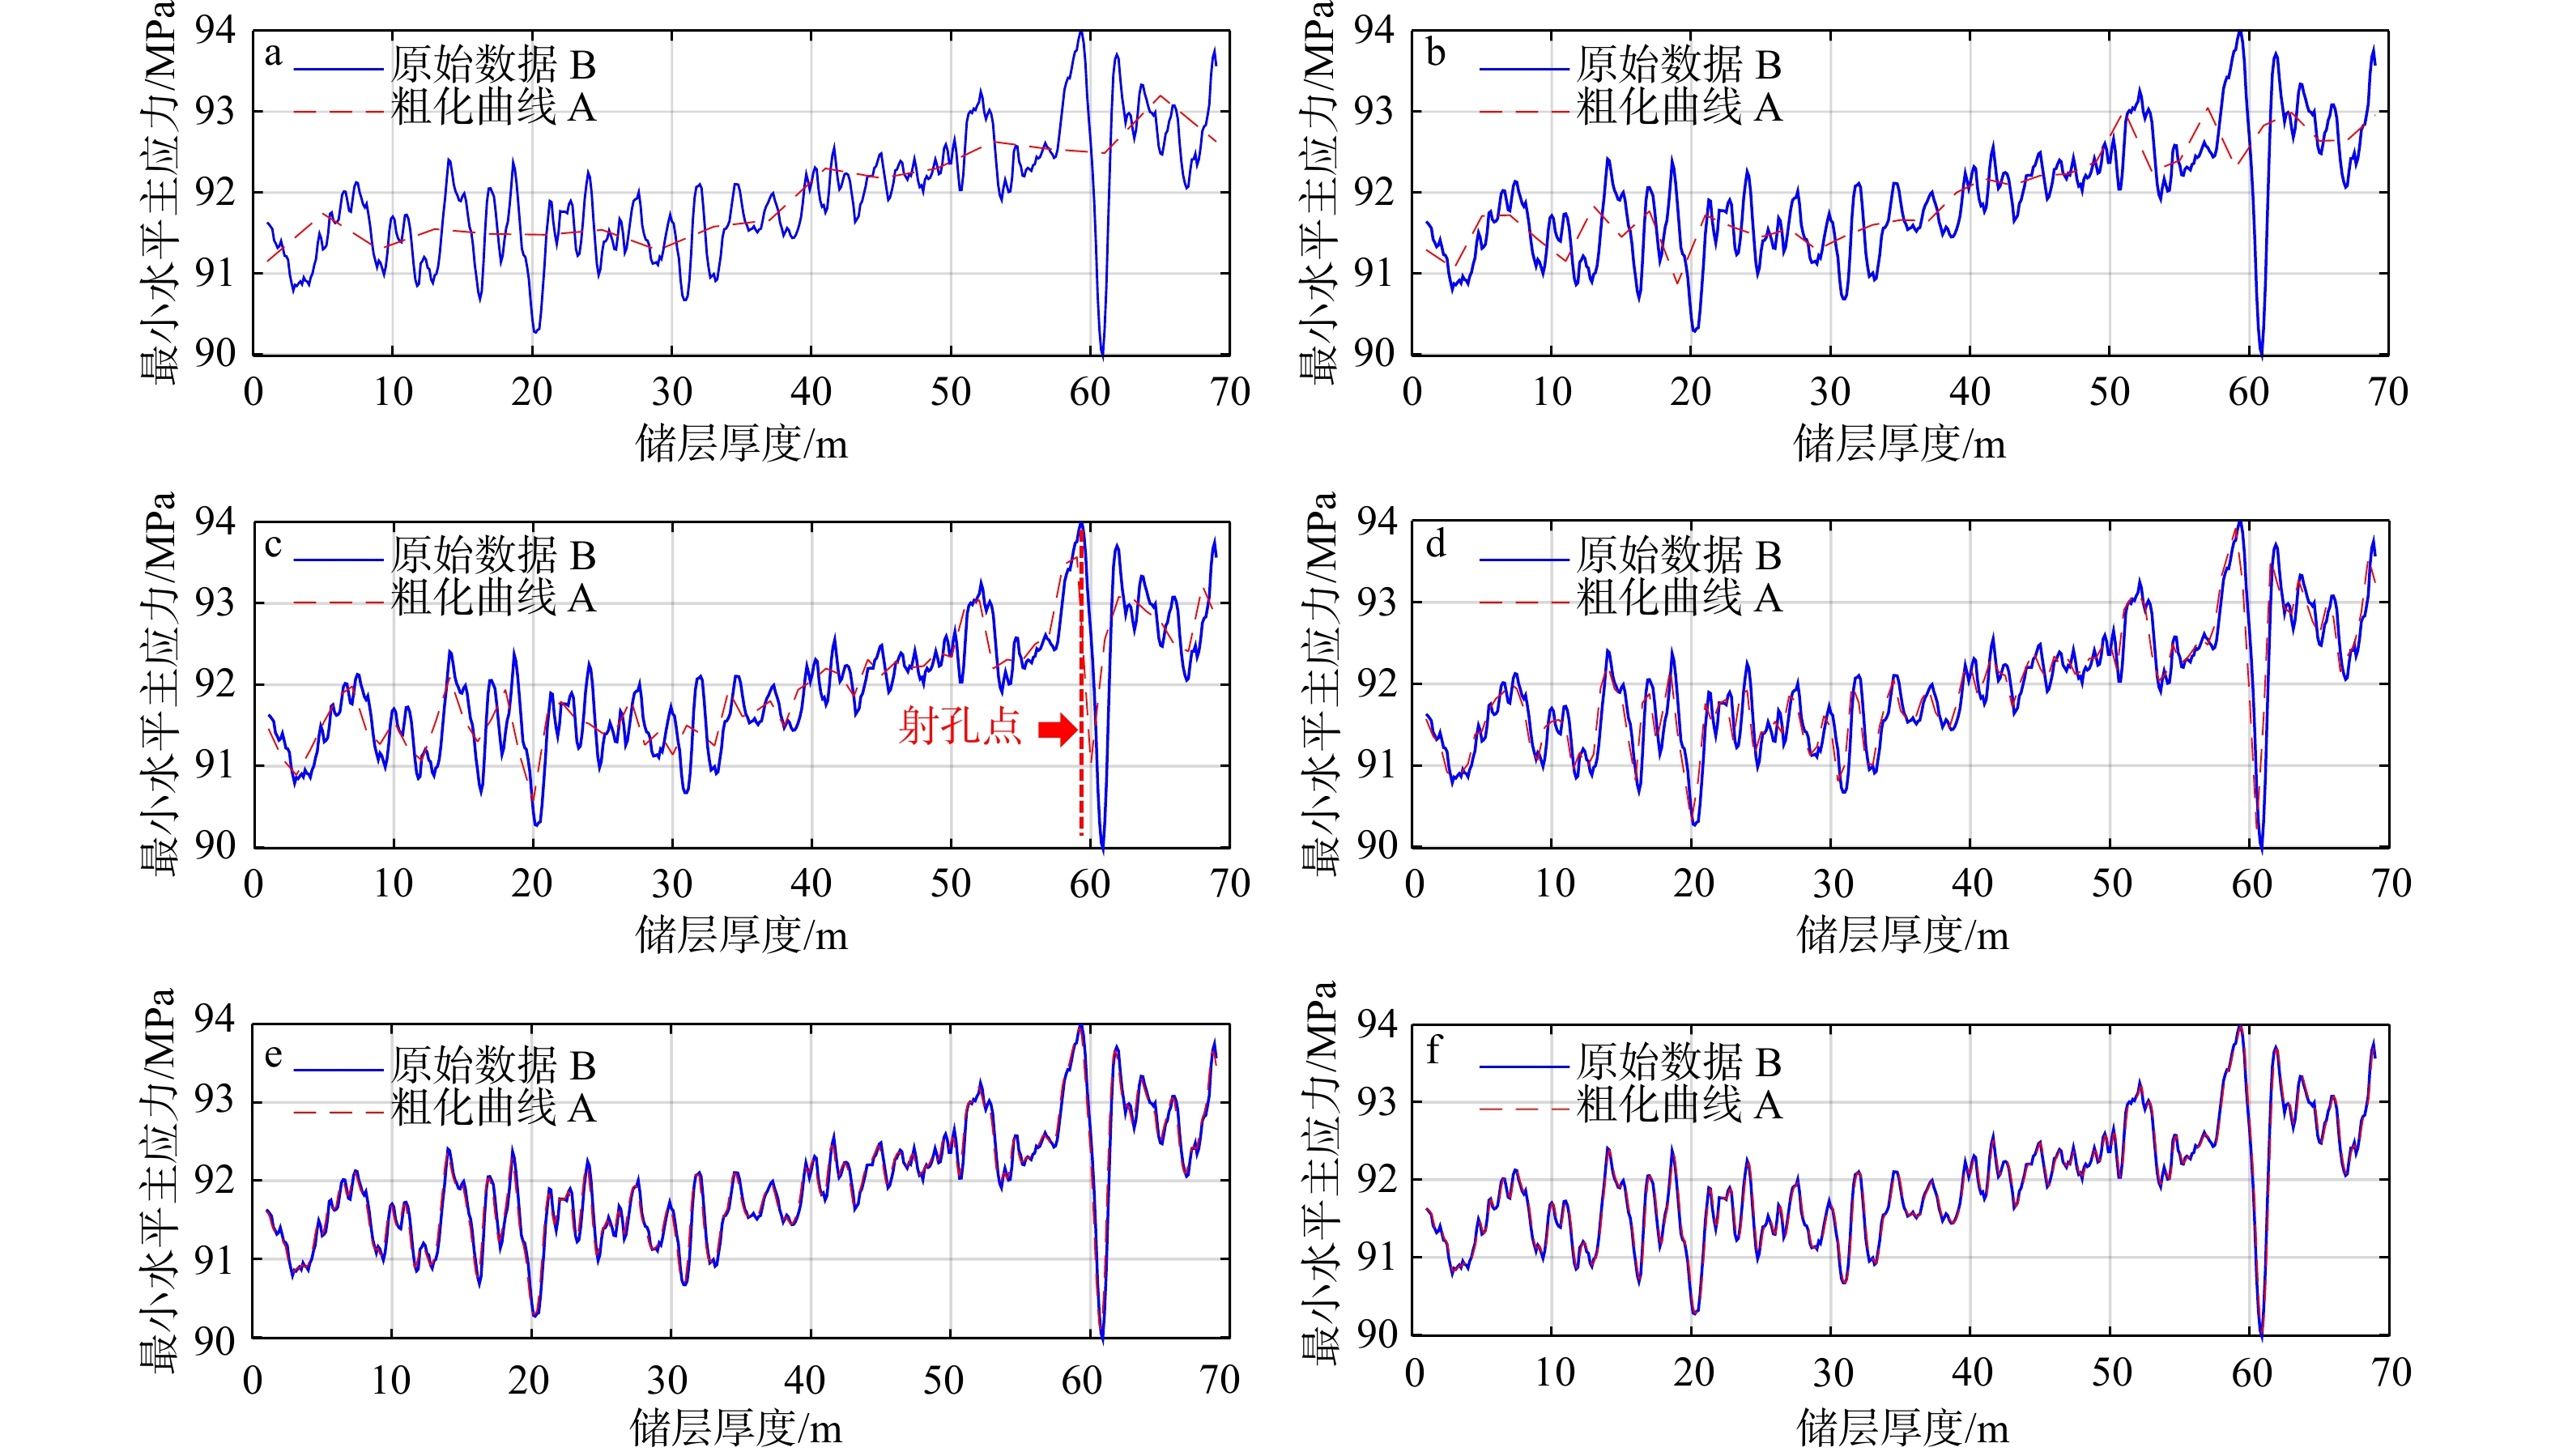
图 7 不同纵向网格分辨率网格结果与测井数据对比
粗化曲线A—不同纵向网格分辨率网格结果;原始数据B—测井数据a—纵向网格分辨率:4.0 m;b—纵向网格分辨率:2.0 m;c—纵向网格分辨率:1.0 m;d—纵向网格分辨率:0.5 m;e—纵向网格分辨率:0.2 m;f—纵向网格分辨率:0.125 m
Figure 7. Comparison between grid results of different vertical grid resolutions (coarsening curve A) and logging data (original data B)
(a) Vertical grid resolution: 4.0 m; (b) Vertical grid resolution: 2.0 m; (c) Vertical grid resolution: 1.0 m; (d) Vertical grid resolution: 0.5 m; (e) Vertical grid resolution: 0.2 m; (f) Vertical grid resolution: 0.125 m
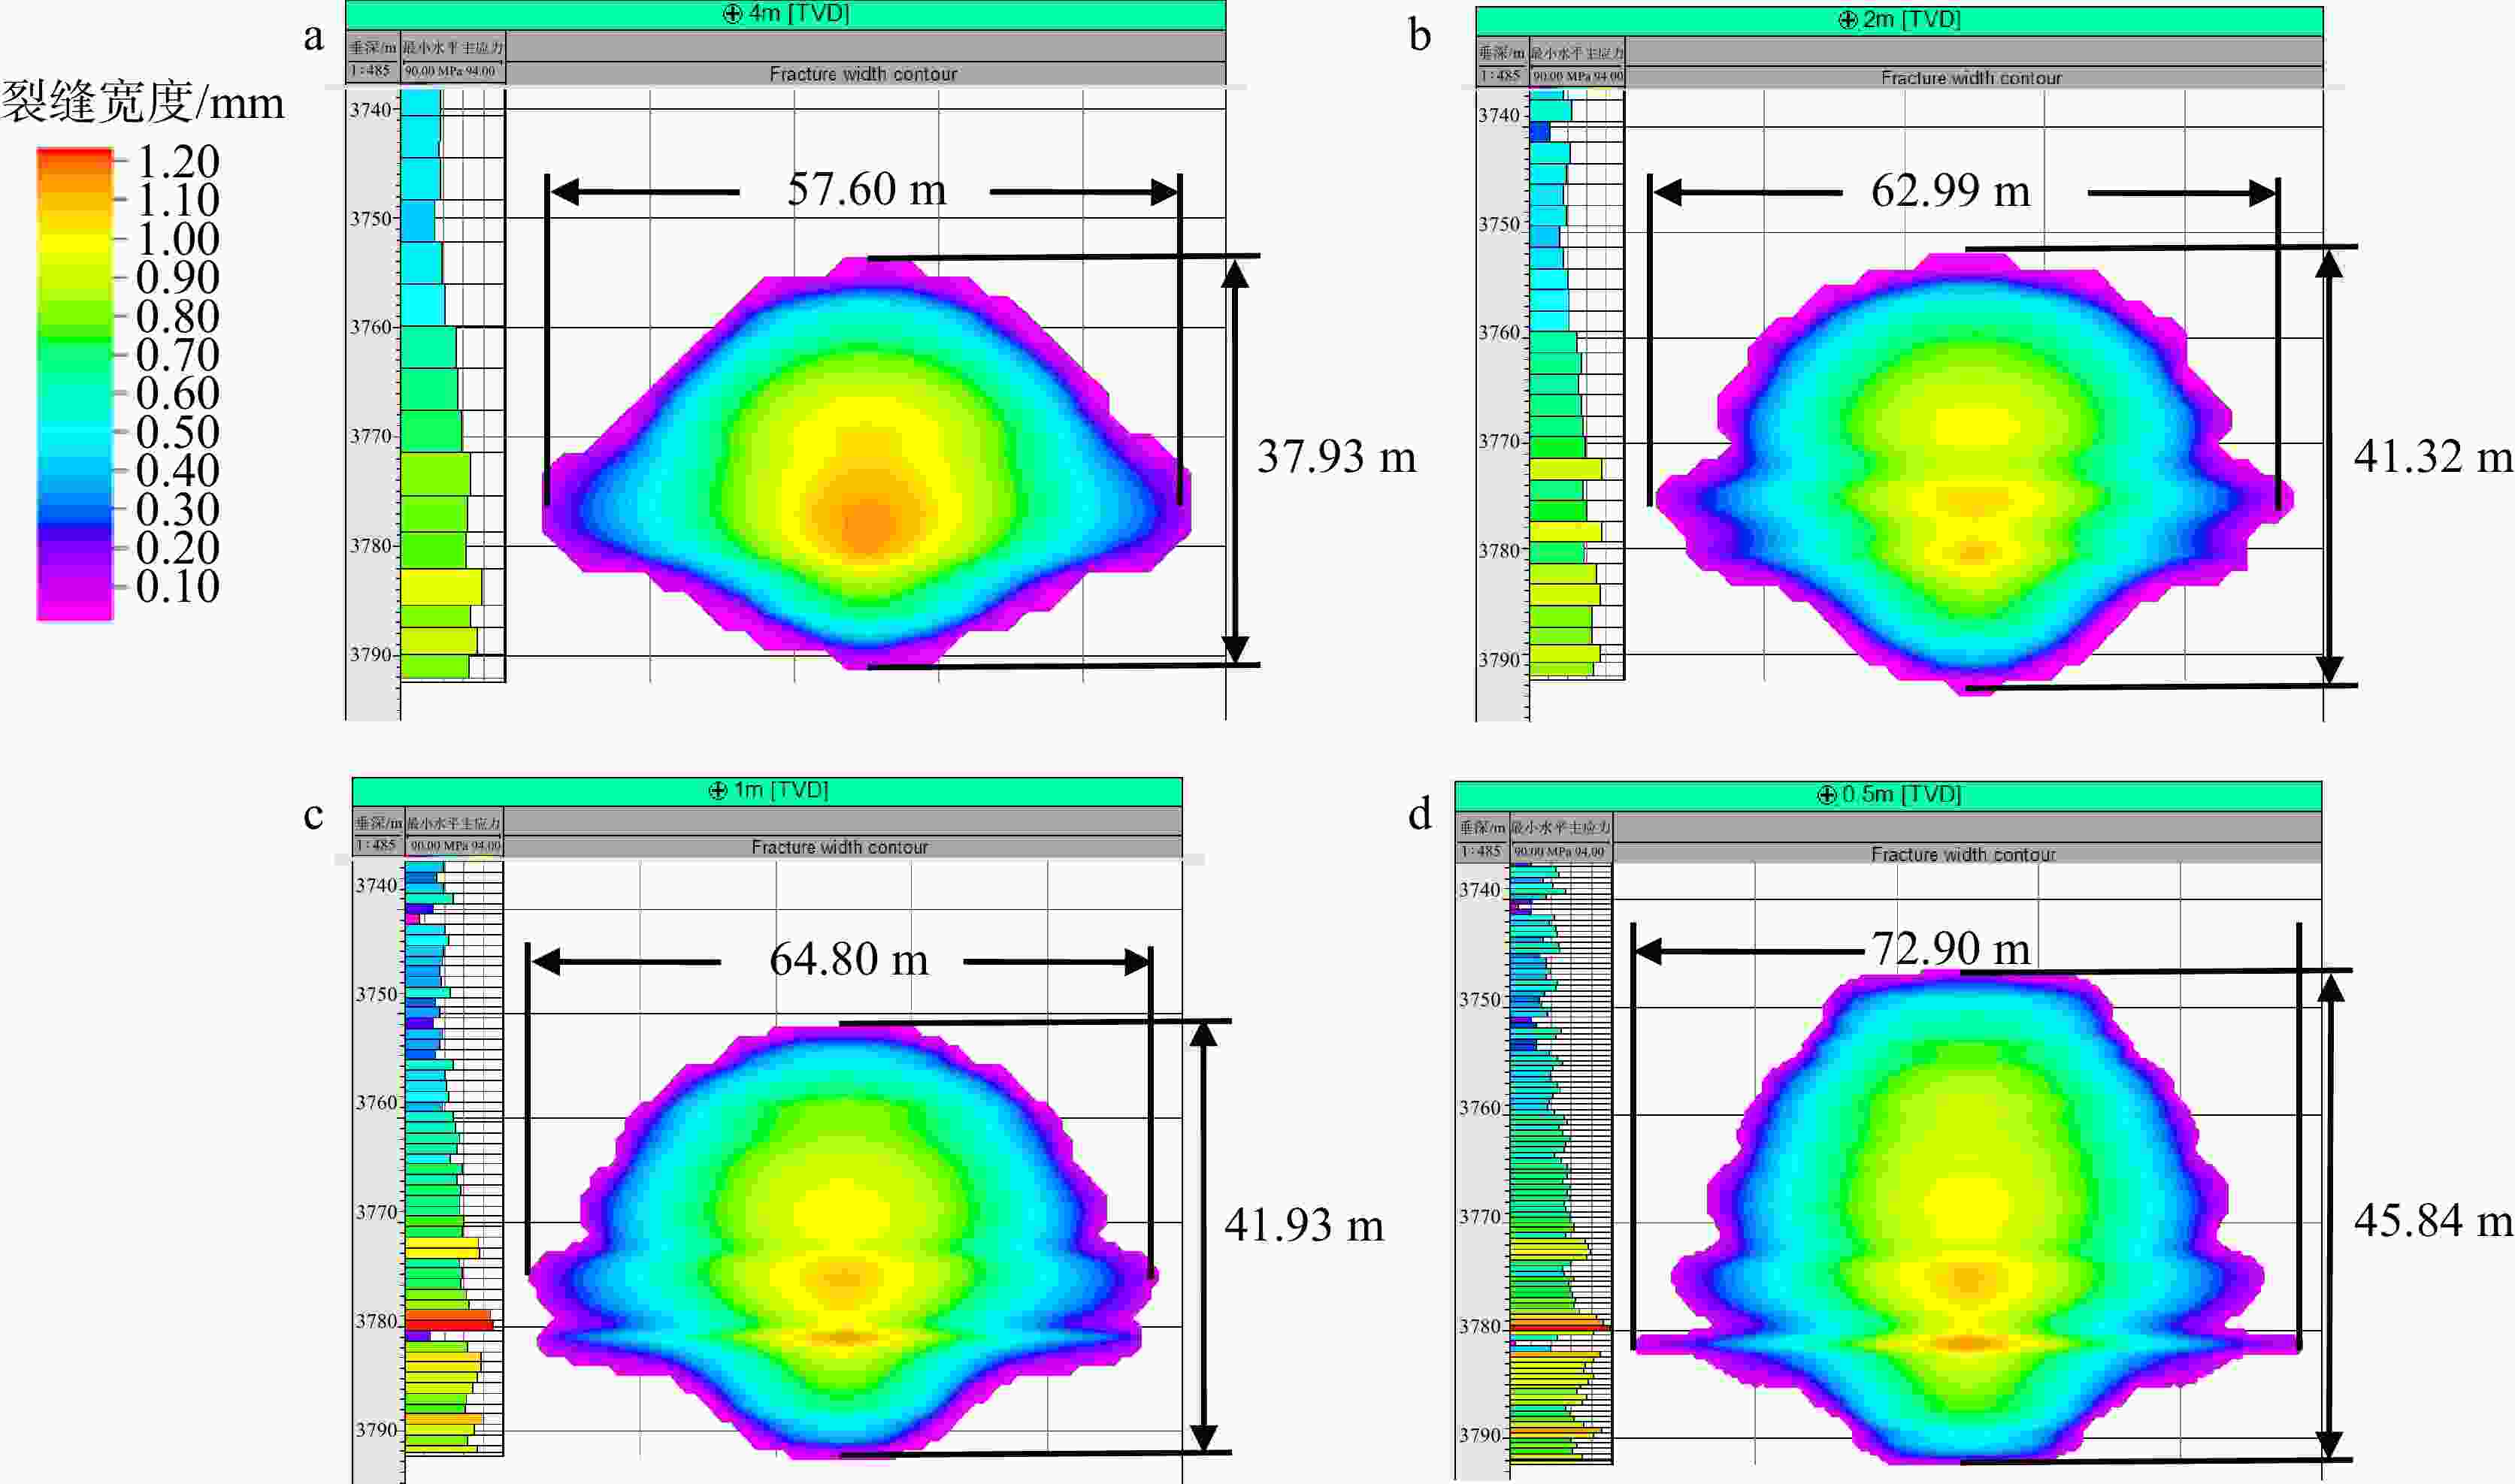
图 8 不同分辨率裂缝形态
a—分辨率:4.0 m;b—分辨率:2.0 m;c—分辨率:1.0 m;d—分辨率:0.5 m
Figure 8. Fracture geometry with different resolutions
(a) Resolution: 4.0 m; (b) Resolution: 2.0 m; (c) Resolution: 1.0 m; (d) Resolution: 0.5 m

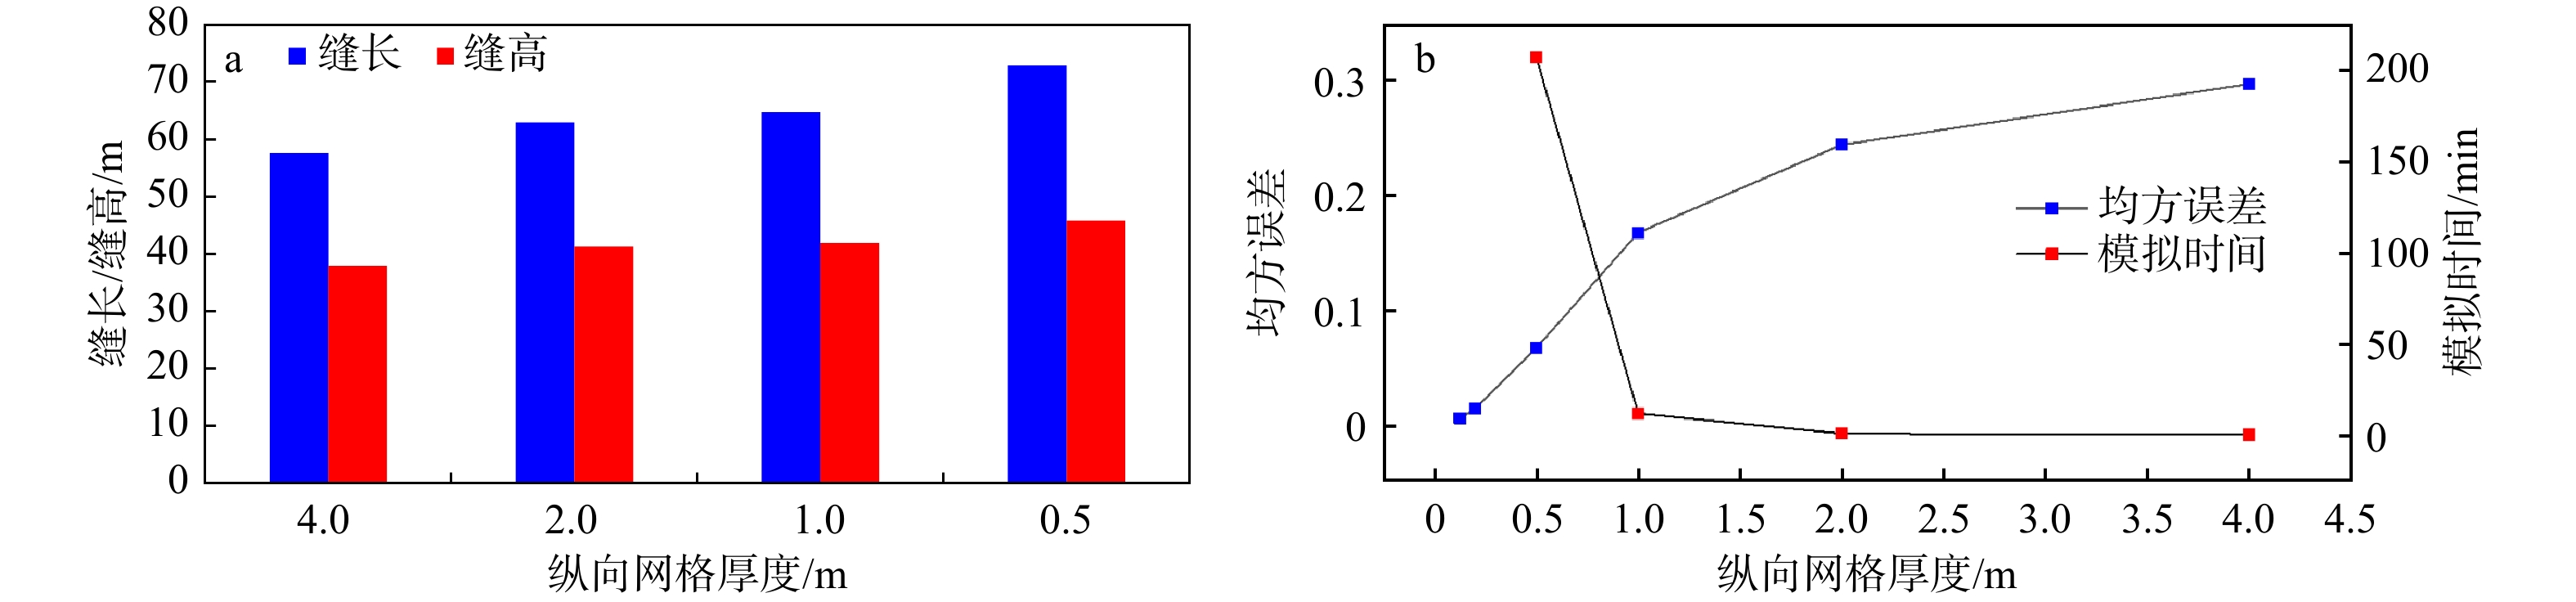
图 9 不同分辨率下裂缝缝长缝高、均方误差和模拟时间变化
a—不同分辨率裂缝缝长和缝高;b—不同分辨率数据均方误差与模拟时间
Figure 9. Variation in fracture length/height, root mean square error, and simulation time under different resolutions
(a) Fracture length and height at different resolutions; (b) Root mean square error and simulation time for data at different resolutions

图 10 不同裂缝网格分辨率裂缝扩展模拟
a—分辨率(纵向×水平向):0.7 m×2.8 m;b—分辨率(纵向×水平向):0.9 m×3.6 m;c—分辨率(纵向×水平向):1.1 m×4.4 m
Figure 10. Fracture propagation simulation with different fracture grid resolutions
(a) Resolution (vertical×horizontal): 0.7 m×2.8 m; (b)—Resolution (vertical×horizontal): 0.9 m×3.6 m; (c) Resolution (vertical×horizontal): 1.1 m×4.4 m
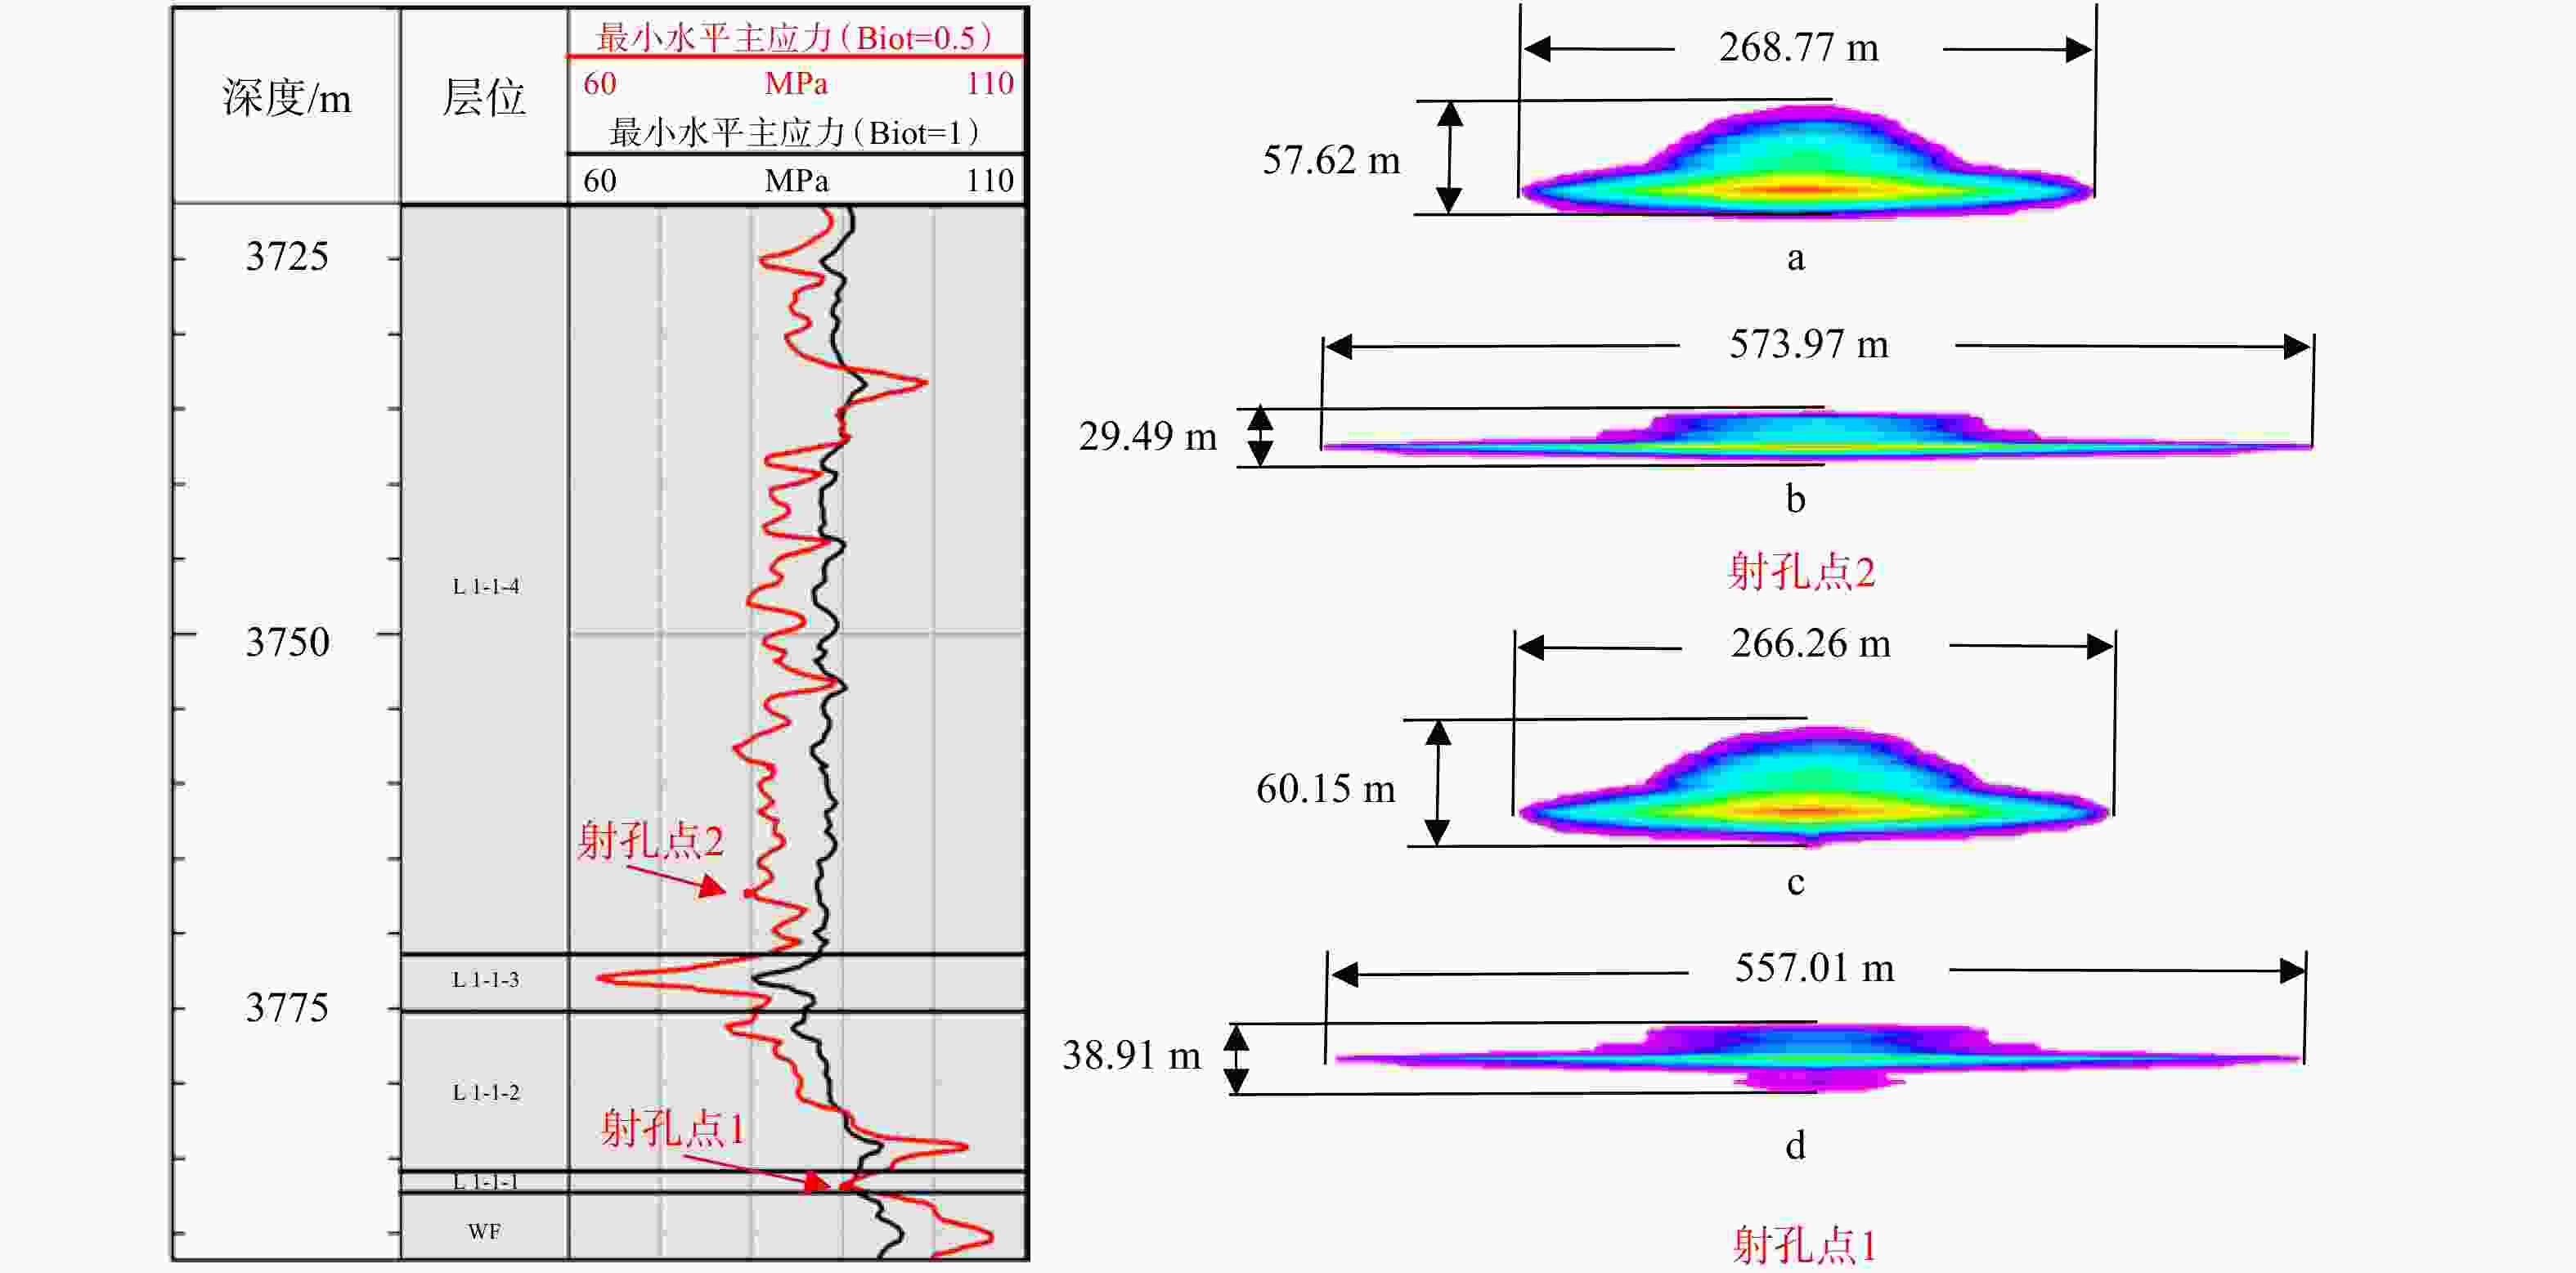
图 11 常值Biot系数下不同深度位置裂缝扩展模拟
射孔点1测深:3786.5 m;射孔点2测深:3767 mL 1-1-4—龙一段1亚段4小层;L 1-1-3—龙一段1亚段3小层;L 1-1-2—龙一段1亚段2小层;L 1-1-1—龙一段1亚段1小层;WF—五峰组 a—射孔点2,Biot=1条件下裂缝扩展;b—射孔点2,Biot=0.5条件下裂缝扩展;c—射孔点1,Biot=1条件下裂缝扩展;d—射孔点1,Biot=0.5条件下裂缝扩展
Figure 11. Simulation of fracture propagation at different depths under two constant biot coefficients
(a) Fracture propagation at Perf Point 2 under Biot=1; (b) Fracture propagation at Perf Point 2 under Biot=0.5; (c) Fracture propagation at Perf Point 1 under Biot=1; (d) Fracture propagation at Perf Point 1 under Biot=0.5Measured depth of Perf Point 1: 3786.5 m; Measured depth of Perf Point 2: 3767 mL 1-1-4—4th Bed of 1st Submember, Long 1 Member; L 1-1-3—3rd Bed of 1st Submember, Long 1 Member; L 1-1-2—2nd Bed of 1st Submember, Long 1 Member; L 1-1-1—1st Bed of 1st Submember, Long 1 Member; WF—Wufeng Formation
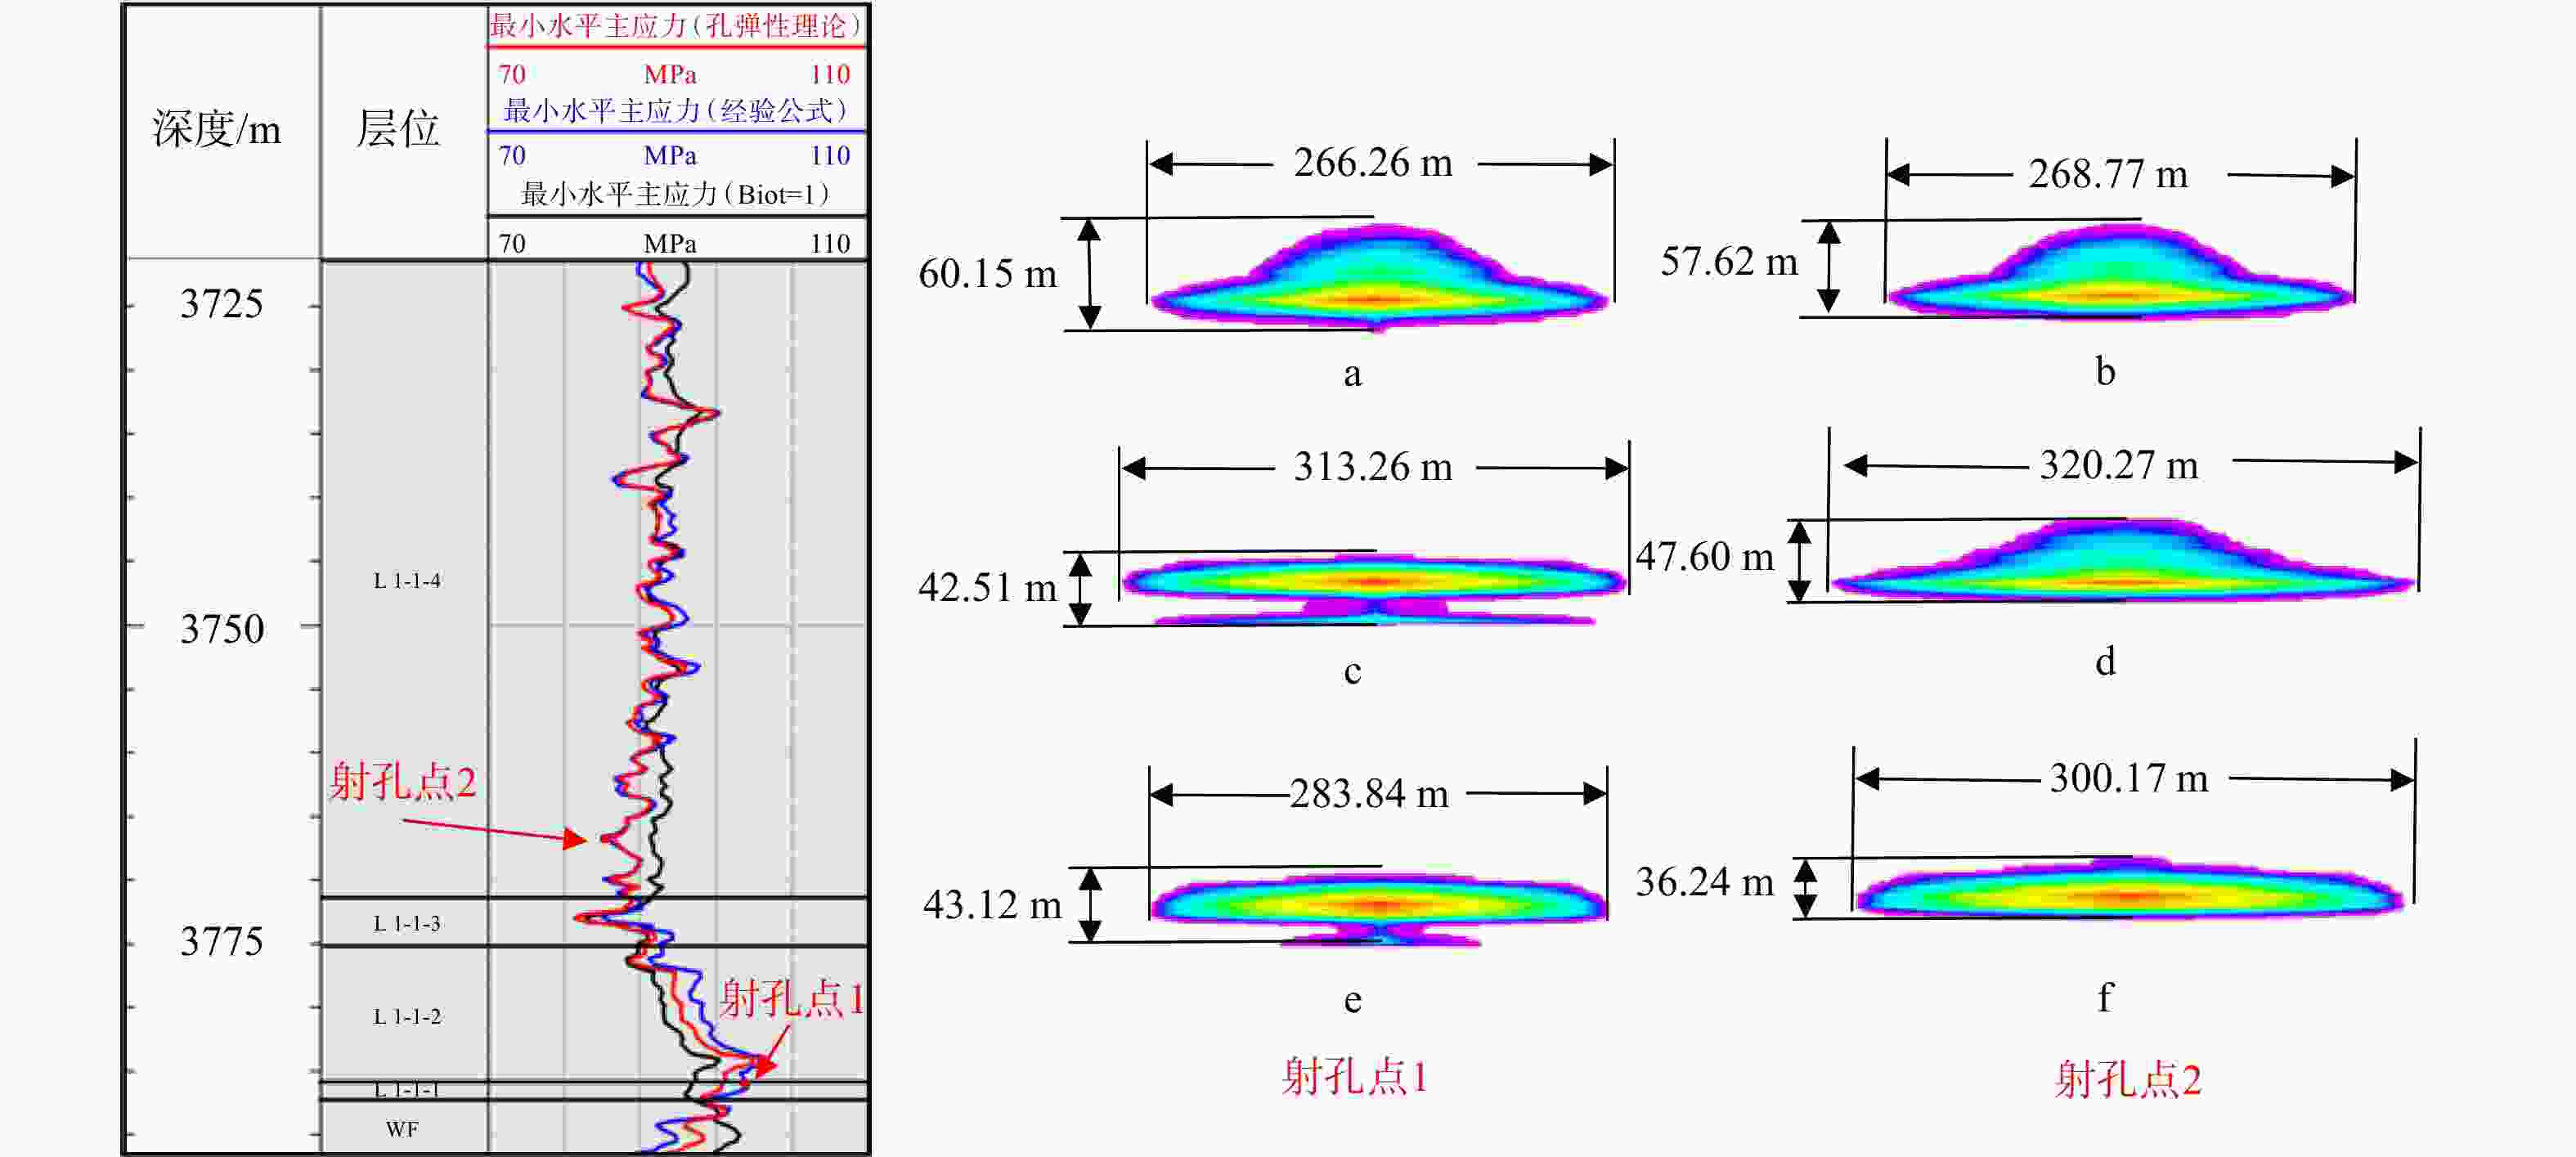
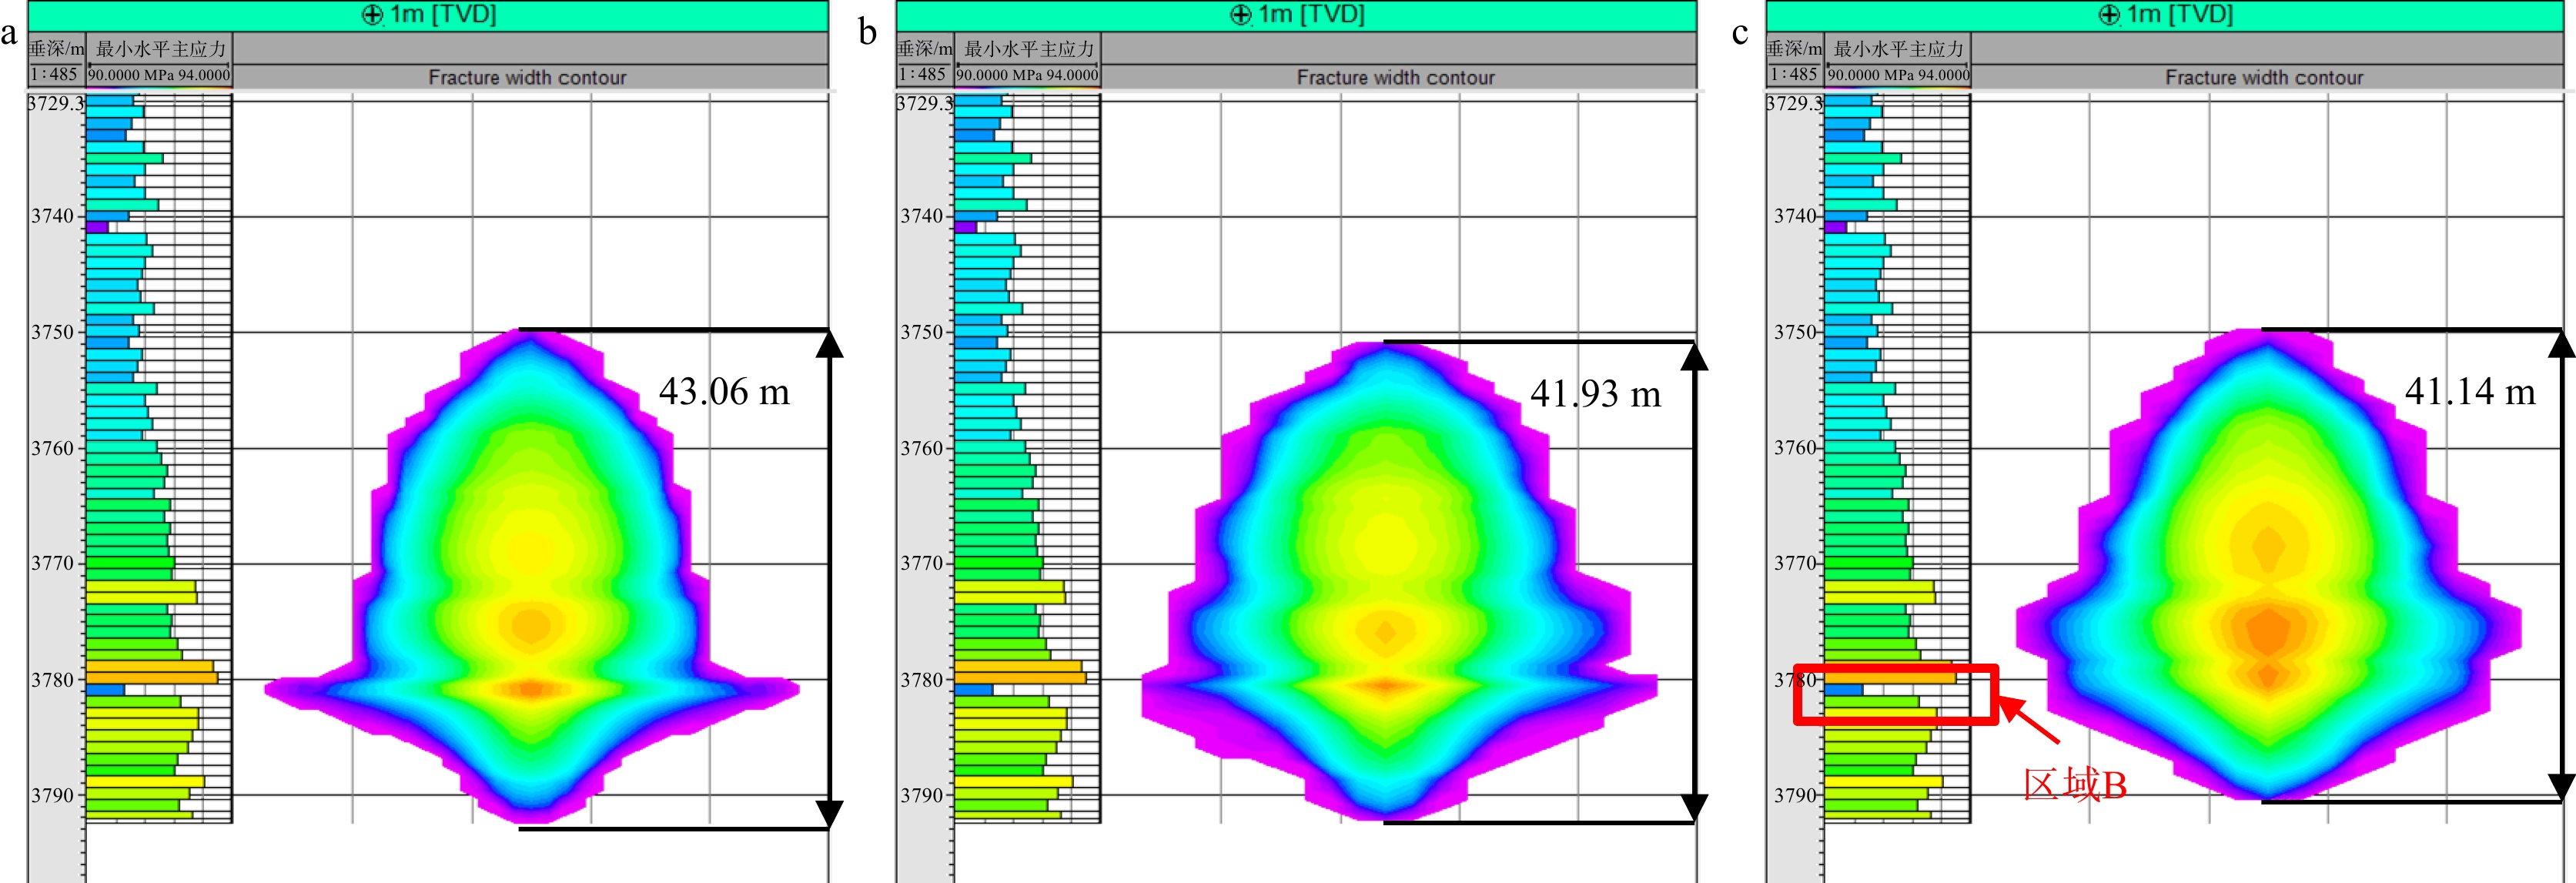
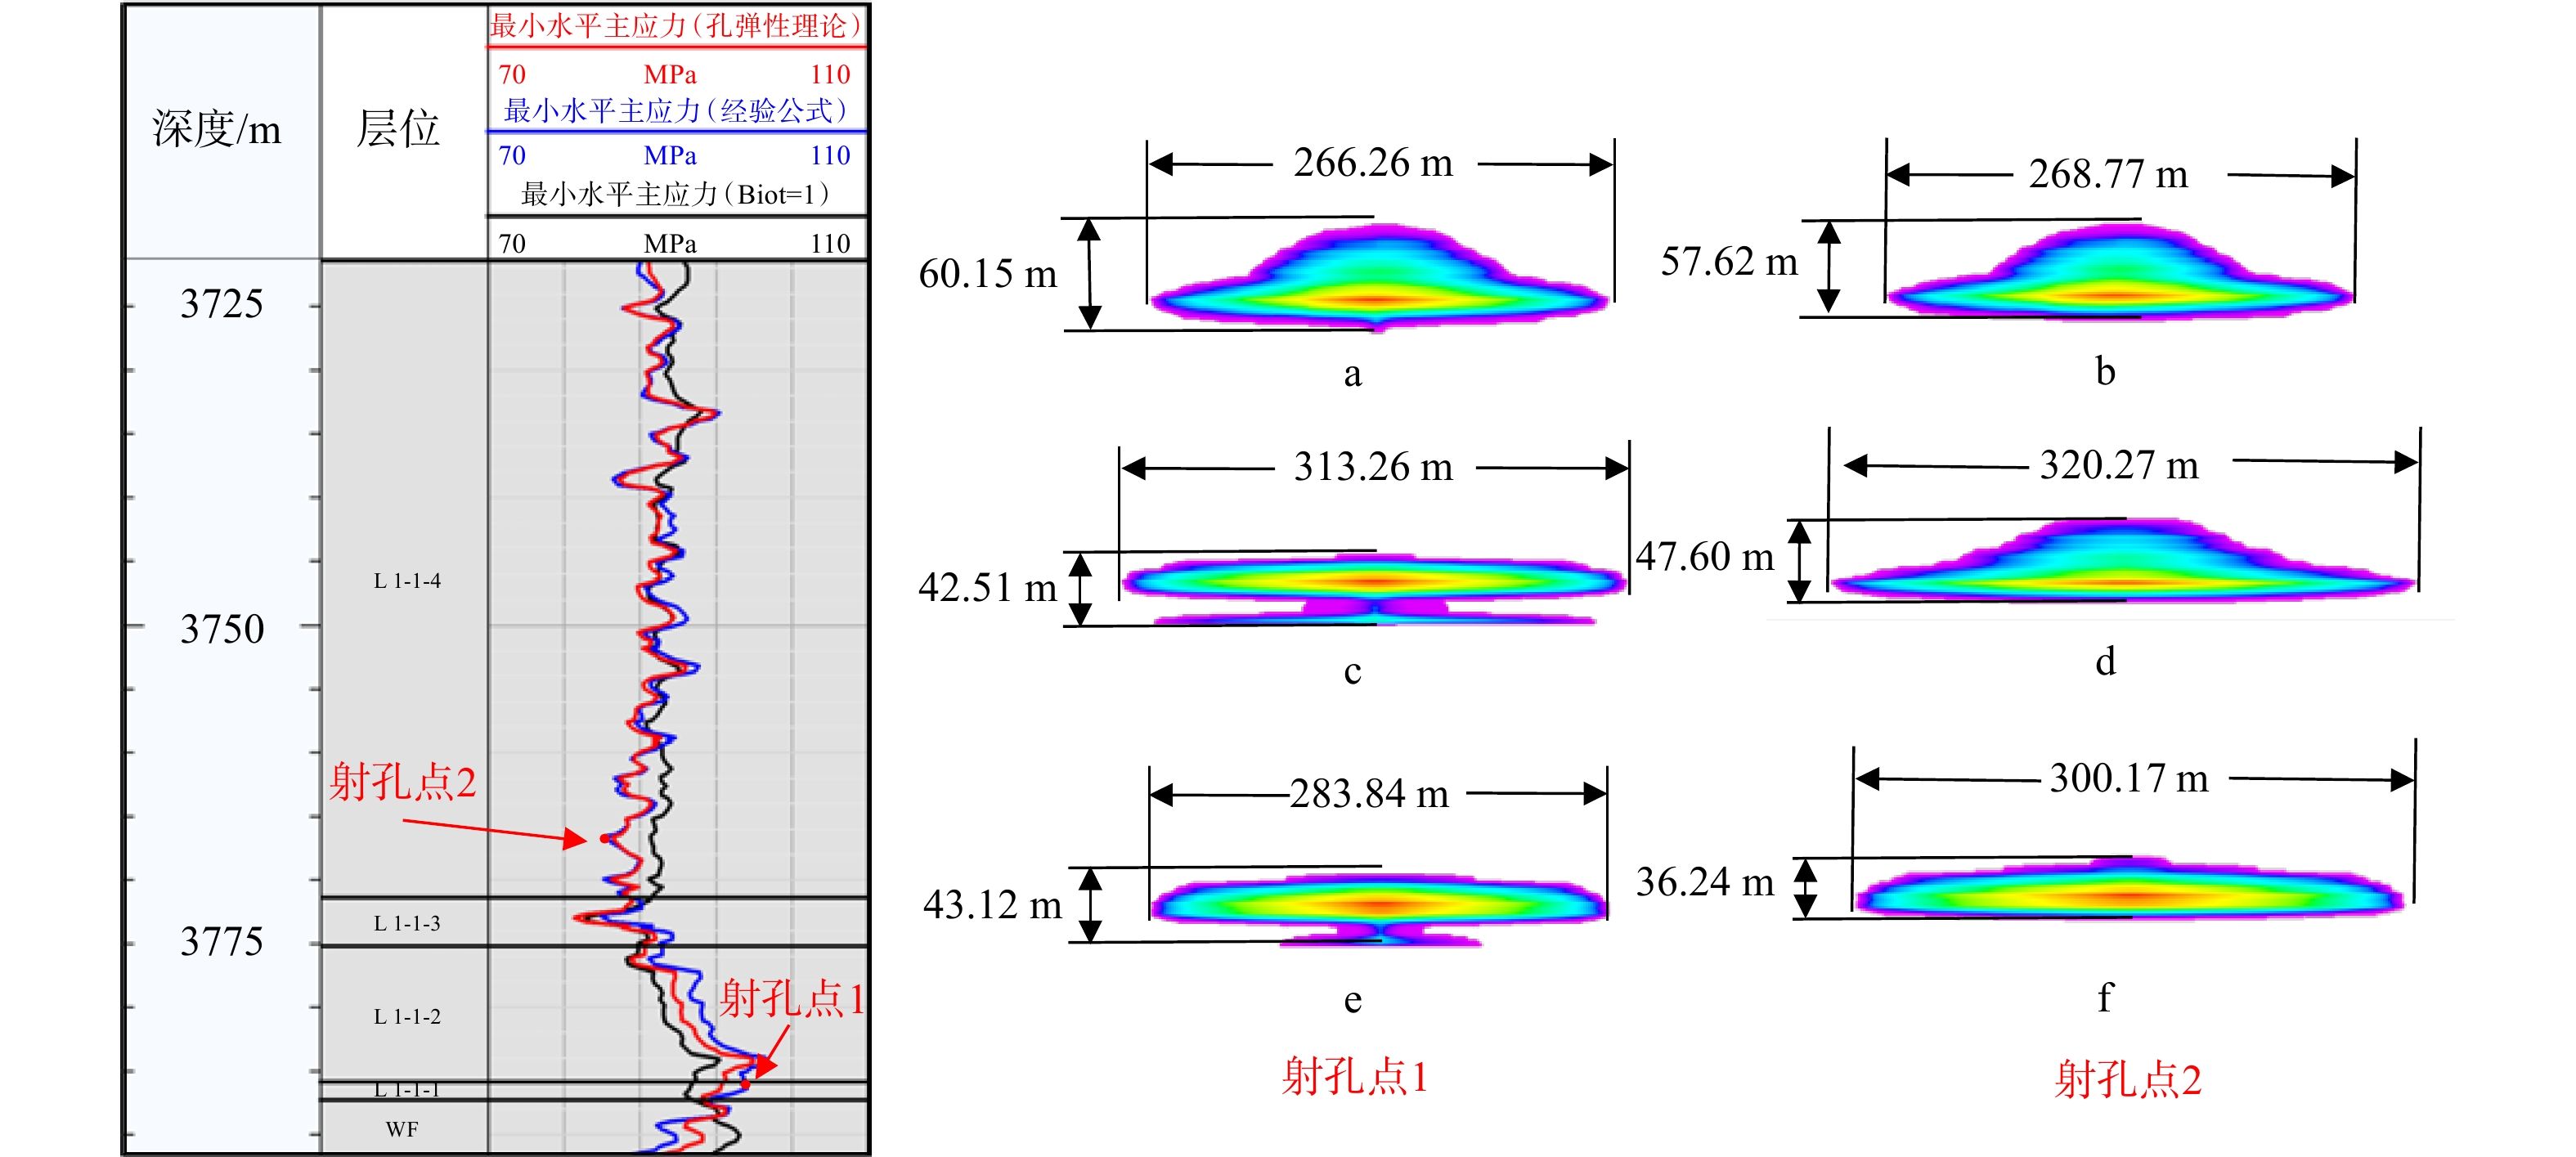
图 12 不同Biot系数不同深度位置裂缝扩展模拟
射孔点1测深:3786.5 m,射孔点2测深:3767 mL 1-1-4—龙一段1亚段4小层;L 1-1-3—龙一段1亚段3小层;L 1-1-2—龙一段1亚段2小层;L 1-1-1—龙一段1亚段1小层;WF—五峰组 a—射孔点1,Biot=1条件下裂缝扩展;b—射孔点2,Biot=1条件下裂缝扩展;c—射孔点1,经验公式条件下裂缝扩展;d—射孔点2,经验公式条件下裂缝扩展;e—射孔点1,孔弹性理论条件下裂缝扩展;f—射孔点2,孔弹性理论条件下裂缝扩展
Figure 12. Simulation of fracture propagation at different depths with different Biot coefficients
(a) Fracture propagation at Perf Point 1 under Biot=1 condition; (b) Fracture propagation at Perf Point 2 under Biot=1 condition; (c) Fracture propagation at Perf Point 1 based on empirical correlation; (d) Fracture propagation at Perf Point 2 based on empirical correlation; (e) Fracture propagation at Perf Point 1 based on poroelastic theory; (f) Fracture propagation at Perf Point 2 based on poroelastic theoryMeasured depth of Perf Point 1: 3786.5 m; Measured depth of Perf Point 2: 3767 m L 1-1-4—4th Bed of 1st Submember, Long 1 Member; L 1-1-3—3rd Bed of 1st Submember, Long 1 Member; L 1-1-2—2nd Bed of 1st Submember, Long 1 Member; L 1-1-1—1st Bed of 1st Submember, Long 1 Member; WF—Wufeng Formation
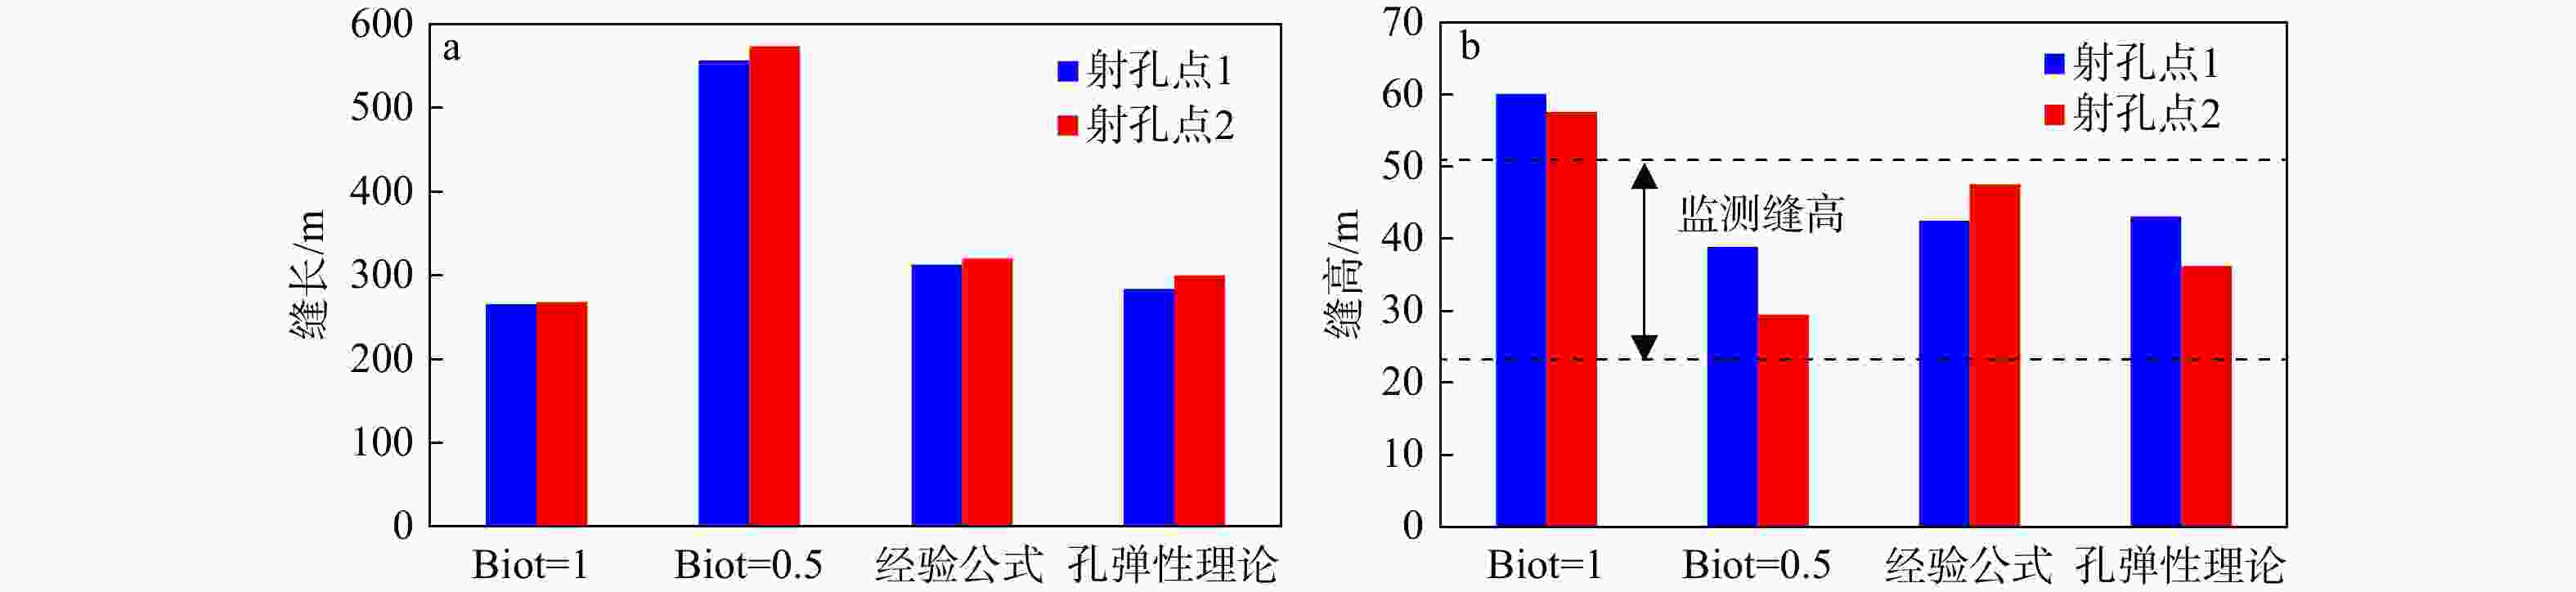
图 13 Biot系数变化下不同深度位置裂缝缝长缝高
射孔点1测深:3786.5 m,射孔点2测深:3767 ma—不同Biot系数下不同深度位置裂缝缝长;b—不同Biot系数下不同深度位置裂缝缝高
Figure 13. Fracture length and height at different depth positions under variation of Biot coefficient
Measured depth of Perf Point 1: 3786.5 m; Measured depth of Perf Point 2: 3767 m (a) Fracture length at various depths under different Biot coefficients; (b) Fracture height at various depths under different Biot coefficients

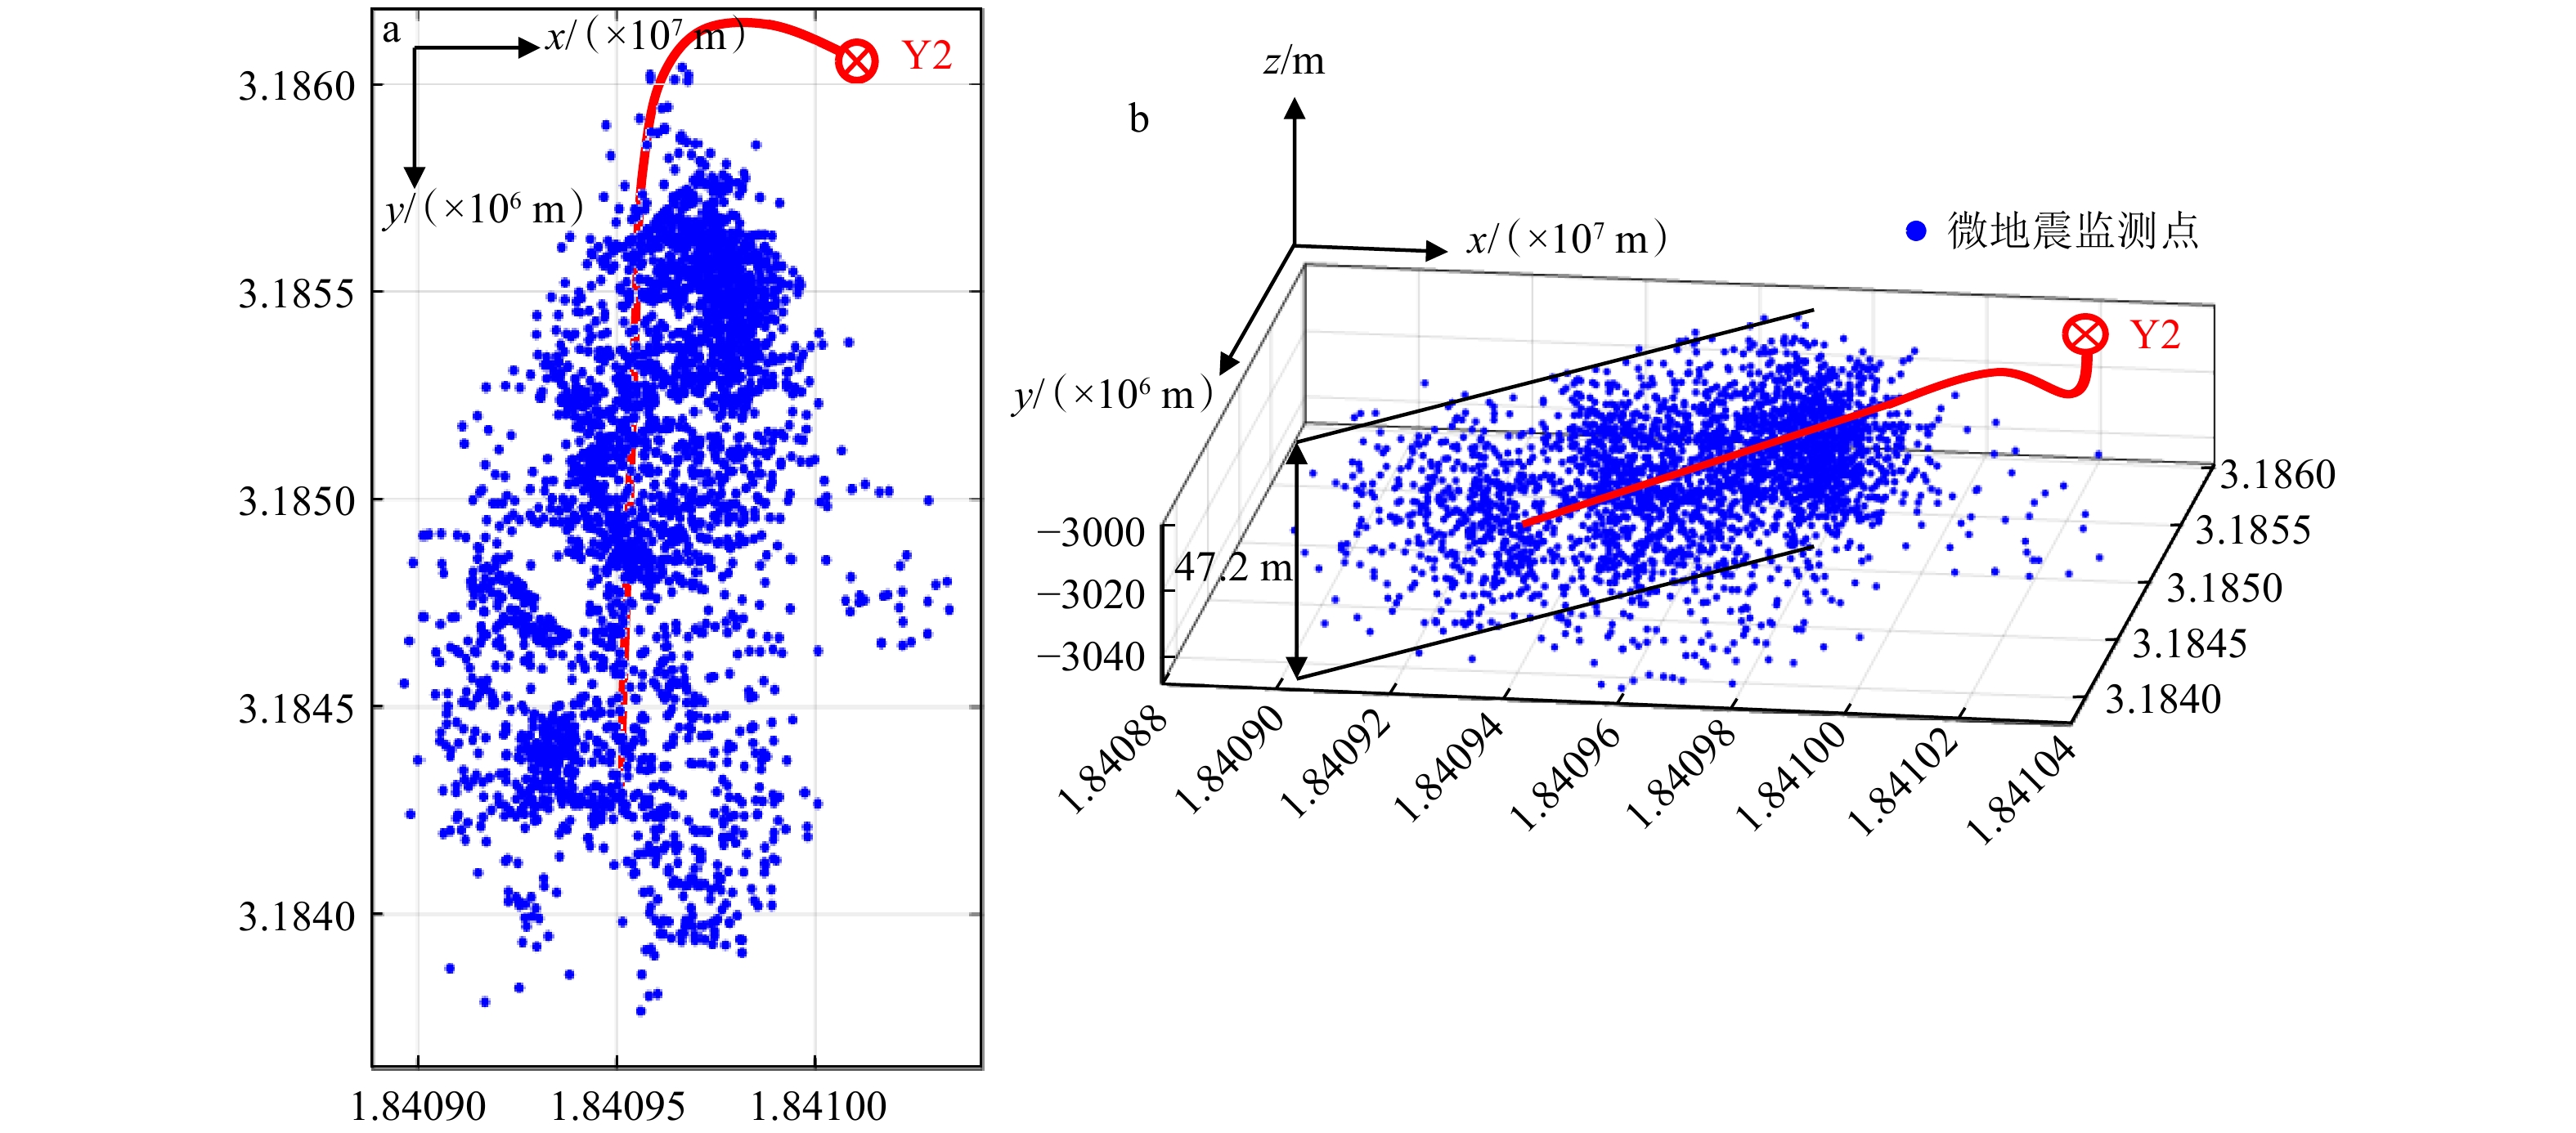
图 14 Y2直改平井压裂裂缝微地震监测
a—Y2“直改平”井压裂裂缝微地震监测俯视图;b—Y2“直改平”井压裂裂缝微地震监测侧视图
Figure 14. Microseismic monitoring of hydraulic fracture in Y2 vertical-to-horizontal conversion well
(a) Top view of microseismic monitoring for hydraulic fractures in vertical-to-horizontal well Y2; (b) Side view of microseismic monitoring for hydraulic fractures in vertical-to-horizontal well Y2
表 1 不同岩性岩石Biot系数范围
Table 1. Range of Biot coefficients for different lithologies
岩性 方法 取值范围 数据来源 Bakken页岩 交会图法 0.548~0.91 He et al.,2016 Bakken页岩 交会图法 0.3~0.9 Ma and Zoback,2017 涪陵地区龙马溪组页岩 岩石物理建模 0.5~0.8 邹贤军和陈亚琳,2018 页岩 交会图法 0.46~0.99 Aldana Gallego et al.,2021 四川盆地南部海相龙马溪组黑色页岩 声波速度法、三轴压缩实验 0.3~0.7 贾利春,2023 Eau Claire页岩 夹套−无夹套压缩测试 0.8 Kasani and Selvadurai,2023 碳酸盐岩 基于孔弹性理论近似 0.3~0.9 Hall and Alvarez,2010 碳酸盐岩 三轴压缩实验、声波动态法结合岩石物理建模 0.2~0.8 Azadpour et al.,2022 致密砂岩 交会图法 0.701(垂直于层理)
0.174(平行于层理)Qiao et al.,2012 致密粉砂岩 排水实验法 0.7 Kim and Espinoza,2023 中国南海东方13区块泥质砂岩 交会图法、排水实验法、声波动态法 0.6~0.9 程远方等,2015 砂岩 单轴抗压强度实验 0.69~0.84 Bodaghabadi and Moosavi,2008 砂岩 无夹套平面应变压缩、集水排水压缩和、夹套−
无夹套的静水压缩0.64~0.74 Makhnenko and Labuz,2013 砂岩 声波动态法结合经验公式 0.92~0.98 Salemi et al.,2020 砂岩、石灰岩、花岗岩 排水静水实验、交会图法 0.85~0.9(砂岩)
0.71~0.85(石灰岩)
0.44~0.45(花岗岩)Zhou et al.,2015 花岗岩 夹套−无夹套压缩测试 0.55~0.85 Berryman,1992 花岗岩 排水实验法、无夹套压缩测试 0.43~0.53 Asem et al.,2022 白垩岩 等容实验、三轴压缩实验、声波动态法 0.84~1 Nermoen et al.,2013 不同黏土、碳酸盐和干酪根含量的岩石 声波动态法 0.3~1 Gokaraju et al.,2018 巴西盐下油田岩石 排水实验法、声波动态法、测井数据解释模量 0.1~0.82 Vasquez et al.,2025  下载: 导出CSV
表 2 三向应力室内实验测量结果
Table 2. Laboratory experimental measurement results of triaxial stress
实验名称 层位 深度/m 最大水平主应力/MPa 最小水平主应力/MPa 垂向应力/MPa 地应力大小实验 龙一段1亚段4小层 3735.73~3735.88 99.7 88.5 95.3 龙一段1亚段3小层 3774.74~3774.94 100.8 89.2 96.2 龙一段1亚段2小层 3782.14~3782.25 101.3 90.5 96.4
下载: 导出CSV
表 3 不同Biot计算方法所得应力结果与室内实验结果相对误差
Table 3. Relative error between stress results obtained by different Biot calculation methods and laboratory experimental results
地层深度/m 最小水平主应力/MPa Biot=1 Biot=0.5 经验公式 孔弹性理论 3735.80 89.98 89.60 88.39 88.49 3774.84 86.41 81.37 88.79 87.05 3782.20 90.32 90.80 93.30 91.86 相对误差之和 0.0500 0.1035 0.0368 0.0393
下载: 导出CSV
表 4 基于不同Biot系数的各小层最小水平主应力平均值
Table 4. Average value of minimum horizontal principal stress for different layers with different biot coefficients
龙一段1亚段4小层 龙一段1亚段3小层 龙一段1亚段2小层 龙一段1亚段1小层 五峰组 Biot=1 90.38 87.70 89.93 91.67 93.71 Biot=0.5 84.50 74.93 87.82 91.66 101.56 经验公式 85.14 84.84 90.54 93.03 87.01 孔弹性理论 85.77 83.54 89.67 92.21 90.30 单位:MPa
下载: 导出CSV
表 5 模型属性参数(Biot=1)
Table 5. Model attribute parameters (Biot = 1)
储层参数 数值范围 单位 孔隙度 3.85~4.72 % 渗透率 1.10×10⁻¹⁰~3.89×10⁻⁷ μm2 含水饱和度 13.78~15.83 % 杨氏模量 30.32~34.28 GPa 泊松比 0.25~0.29 / 最大水平主应力 101.67~104.94 MPa 最小水平主应力 90.57~93.57 MPa 孔隙压力 40.37~48.49 MPa 垂向应力 88.96~90.19 MPa
下载: 导出CSV
表 6 不同Biot常数层内最大应力差
Table 6. Maximum stress difference within layers with different Biot constants
龙一段1亚段4小层 龙一段1亚段3小层 龙一段1亚段2小层 龙一段1亚段1小层 五峰组 Biot=1 6.32 7.35 10.21 0.88 5.00 Biot=0.5 21.41 18.90 26.57 3.30 13.04
下载: 导出CSV
表 7 变Biot系数层内最大应力差
Table 7. Maximum stress difference within layers with variable Biot coefficients
龙一段1亚段4小层 龙一段1亚段3小层 龙一段1亚段2小层 龙一段1亚段1小层 五峰组 经验公式 10.59 6.06 9.81 3.67 13.11 孔弹性理论 10.08 7.79 11.62 2.39 8.46
下载: 导出CSV
-
[1] ALAMEER M, ALMANI T, KHAN K, et al. , 2025. Computational framework to assess the influence of the Biot coefficient on formation breakdown pressures in tight gas formations[C]//Paper presented at the 59th U. S. rock mechanics/geomechanics symposium. Santa Fe: ARMA: ARMA-2025-0314. [2] ASEM P, TAROKH A, TUROS M, et al. , 2022. Measuring the Biot coefficient for a fluid-saturated crystalline rock[C]//Paper presented at the 56th U. S. rock mechanics/geomechanics symposium. Santa Fe: ARMA: ARMA-2022-0502. [3] AZADPOUR M, JAVAHERIAN A, SABERI M R, et al., 2022. Rock physics model-based investigation on the relationship between static and dynamic Biot's coefficients in carbonate rocks[J]. Journal of Petroleum Science and Engineering, 211: 110243. doi: 10.1016/j.petrol.2022.110243 [4] BERRYMAN J G, 1992. Effective stress for transport properties of inhomogeneous porous rock[J]. Journal of Geophysical Research: Solid Earth, 97(B12): 17409-17424. doi: 10.1029/92JB01593 [5] BIOT M A, WILLIS D G, 1957. The elastic coefficients of the theory of consolidation[J]. Journal of Applied Mechanics, 24(4): 594-601. doi: 10.1115/1.4011606 [6] BODAGHABADI S, MOOSAVI S J, 2008. A simple practical method to determine the Biot coefficient for hydromechanical analyses[C]//Paper presented at the ISRM international symposium - 5th Asian rock mechanics symposium. Tehran, Iran: ISRM: ISRM-ARMS5-2008-020. [7] CHENG Y F, CHENG L L, LI H, et al., 2015. Research on testing methods of Biot coefficient in reservoir with different permeability and its influencing factors[J]. Chinese Journal of Rock Mechanics and Engineering, 34(S2): 3998-4004. (in Chinese with English abstract) [8] COSTA A, CUSINI M, JIN T, et al., 2022. A multi-resolution approach to hydraulic fracture simulation[J]. International Journal of Fracture, 237(1): 165-188. doi: 10.1007/s10704-022-00662-y [9] DONG Z, TANG S B, RANJITH P G, et al., 2018. A theoretical model for hydraulic fracturing through a single radial perforation emanating from a borehole[J]. Engineering Fracture Mechanics, 196: 28-42. doi: 10.1016/j.engfracmech.2018.04.029 [10] DONTSOV E V, PEIRCE A P, 2015. A non-singular integral equation formulation to analyse multiscale behaviour in semi-infinite hydraulic fractures[J]. Journal of Fluid Mechanics, 781: R1. doi: 10.1017/jfm.2015.451 [11] FILIPPOV D, VASEKIN B, MAKSIMOV D, et al. , 2020. High-resolution hydraulic fracture network modeling on adaptive PEBI grids[C]//Proceedings of the ECMOR XVII. European Association of Geoscientists & Engineers, physical event cancelled: 1-11. [12] GOKARAJU D, ALDIN M, THOMBARE A, et al. , 2018. A novel method for experimental characterization of the poroelastic constants in unconventional formations[C]//Paper presented at the SPE/AAPG/SEG unconventional resources technology conference. Houston: SPE: URTEC-2902907-MS. [13] HALL J, ALVAREZ E, 2010. Overcoming the limitations of rock physics modelling in porous rock with complex mineralogy[C]//Paper presented at the SPWLA 51st annual logging symposium. Perth: SPWLA: SPWLA-2010-69661. [14] HE J, RUI Z H, LING K G, 2016. A new method to determine Biot's coefficients of Bakken samples[J]. Journal of Natural Gas Science and Engineering, 35: 259-264. doi: 10.1016/j.jngse.2016.08.061 [15] JIA L C, 2023. Experimental investigation on dynamic and static Biot coefficients of transversely isotropic shale[J]. Chinese Journal of Rock Mechanics and Engineering, 42(S2): 4130-4139. (in Chinese with English abstract) [16] KASANI H A, SELVADURAI A P S, 2023. A review of techniques for measuring the Biot coefficient and other effective stress parameters for fluid-saturated rocks[J]. Applied Mechanics Reviews, 75(2): 020801. doi: 10.1115/1.4055888 [17] KIM K, ESPINOZA D N, 2023. Determination of Biot coefficient for low-permeability rocks accounting for undrained loading[C]//Paper presented at the 57th U. S. rock mechanics/geomechanics symposium. Atlanta: ARMA: ARMA-2023-0694. [18] LI N, CHEN H, ZHANG X M, et al. , 2019. Simultaneous prediction of rock matrix modulus and critical porosity[J]. Applied Geophysics, 16(1): 14-24, 137. [19] LI Z, LIU H X, LI L, et al. , 2019. Prediction of abnormal pressure in Lingshui deep-water high temperature formation based on improved bowers method[J]. Journal of Xi'an Shiyou University (Natural Science Edition), 34(6): 60-66, 73. (in Chinese with English abstract) [20] LIU J, HUI C, FAN J M, et al., 2021. Distribution characteristics of the present-day in-situ stress in the Chang 6 tight sandstone reservoirs of the Yanchang Formation in the Heshui Area, Ordos Basin, China and suggestions for development[J]. Journal of Geomechanics, 27(1): 31-39. (in Chinese with English abstract) [21] MA X D, ZOBACK M D, 2017. Laboratory experiments simulating poroelastic stress changes associated with depletion and injection in low‐porosity sedimentary rocks[J]. Journal of Geophysical Research: Solid Earth, 122(4): 2478-2503. doi: 10.1002/2016JB013668 [22] MAKHNENKO R M, LABUZ J F, 2013. Unjacketed bulk compressibility of sandstone in laboratory experiments[C]//Proceedings of the 5th Biot conference on poromechanics. Vienna: ASCE: 481-488. [23] MENG W, TIAN T, SUN D S, et al., 2022. Research on stress state in deep shale reservoirs based on in-situ stress measurement and rheological model[J]. Journal of Geomechanics, 28(4): 537-549. (in Chinese with English abstract) [24] MORSCHBACHER M J, VASQUEZ G F, FIGUEIREDO M P, et al. , 2024. Biot coefficient from sonic logs with laboratory data calibration: a Brazillian pre-salt field case study[C]//Paper presented at the SPWLA 65th annual logging symposium. Rio de Janeiro: SPWLA: SPWLA-2024-0003. [25] NARASIMHAN S, SHAIKH H, GRAY J K, et al. , 2016. Effect of horizontal stress models and Biot poro-elasticity on predicted fracture geometry[C]//Paper presented at the SPE hydraulic fracturing technology conference. The Woodlands: SPE: SPE-179162-MS. [26] NERMOEN A, KORSNES R, CHRISTENSEN H F, et al. , 2013. Measuring the Biot stress coefficient and is implications on the effective stress estimate[C]//Paper presented at the 47th U. S. rock mechanics/geomechanics symposium. San Francisco, California: ARMA: ARMA-2013-282. [27] OKADA Y, 1985. Surface deformation due to shear and tensile faults in a half-space[J]. Bulletin of the Seismological Society of America, 75(4): 1135-1154. doi: 10.1785/BSSA0750041135 [28] QIAO L P, WONG R C K, AGUILERA R, et al., 2012. Determination of Biot's effective-stress coefficient for permeability of Nikanassin sandstone[J]. Journal of Canadian Petroleum Technology, 51(3): SPE-150820-PA. [29] SALEMI H, NOURIFARD N, IGLAUER S, et al. , 2020. Acoustic approach to determine Biot effective stress coefficient of sandstone using true triaxial cell (TTSC)[C]//Paper presented at the 54th U. S. rock mechanics/geomechanics symposium. ARMA, physical event cancelled: ARMA-2020-1048. [30] SUN D S, PANG F, LI A W, et al., 2020. In-situ stress profile prediction based on the rheological model: a case study of Well AY-1 in the Qianbei area of Guizhou Province[J]. Natural Gas Industry, 40(3): 58-64. (in Chinese with English abstract) [31] TANG H Y, WINTERFELD P H, WU Y S, et al., 2016. Integrated simulation of multi-stage hydraulic fracturing in unconventional reservoirs[J]. Journal of Natural Gas Science and Engineering, 36: 875-892. doi: 10.1016/j.jngse.2016.11.018 [32] TERZAGHI K V, 1966. The shearing resistance of saturated soils and the angle between the planes of shear[C]//Proceedings of the 1st international conference on soil mechanics and foundation engineering. Harvard: ISRM: ISRM-1CONGRESS-1966-061. [33] VASQUEZ G F, MORSCHBACHER M J, JUSTEN J C R, et al. , 2025. Biot Coefficient from well logs with lab calibration: a Brazilian pre-salt case study[C]//Paper presented at the 59th U. S. rock mechanics/geomechanics symposium. Santa Fe: ARMA: ARMA-2025-0762. [34] XIA H Q, PENG M, SONG E C, 2019. Calculating method and application of rock anisotropic Biot coefficient[J]. Well Logging Technology, 43(5): 478-483. (in Chinese with English abstract) [35] YANG Q, LI J C, LI L, et al. , 2023. Deep coal seam in-situ stress evaluation through the integration of sonic logging and micro-indentation methods[C]//Paper presented at the 57th U. S. rock mechanics/geomechanics symposium. Atlanta: ARMA: ARMA-2023-0250. [36] ZENG Q D, YAO J, SHAO J F, 2019. Study of hydraulic fracturing in an anisotropic poroelastic medium via a hybrid EDFM-XFEM approach[J]. Computers and Geotechnics, 105: 51-68. doi: 10.1016/j.compgeo.2018.09.010 [37] ZHENG J, HE Y S, WANG Y, et al., 2024. Propagation and optimization of complex fractures of shale gas wells based on FEM-DFN: taking horizontal well group X1 in Changning shale gas reservoir as an example[J]. Fault-Block Oil & Gas Field, 31(3): 415-423. (in Chinese with English abstract) [38] ZHOU X J, VACHAPARAMPIL A, GHASSEMI A, 2015. A combined method to measure Biot’s coefficient for rock[C]//Paper presented at the 49th U. S. rock mechanics/geomechanics symposium. San Francisco: ARMA: ARMA-2015-584. [39] ZHU W Y, MA D X, 2018. Effective stress characteristics in shale and its effect on productivity[J]. Natural Gas Geoscience, 29(6): 845-852. (in Chinese with English abstract) doi: 10.1016/j.jnggs.2018.12.001 [40] ZOBACK M D, 2010. Reservoir geomechanics[M]. Cambridge: Cambridge University Press. [41] ZOU X J, CHEN Y L, 2018. Geostress logging evaluation method of Longmaxi Formation shale in Fuling area based on transversely isotropic model, Sichuan Basin[J]. Natural Gas Geoscience, 29(12): 1775-1780, 1808. (in Chinese with English abstract) [42] 程远方, 程林林, 黎慧, 等, 2015. 不同渗透性储层Biot系数测试方法研究及其影响因素分析[J]. 岩石力学与工程学报, 34(S2): 3998-4004. doi: 10.13722/j.cnki.jrme.2014.1212 [43] 贾利春, 2023. 横观各向同性页岩动、静态有效应力系数试验研究[J]. 岩石力学与工程学报, 42(S2): 4130-4139. doi: 10.13722/j.cnki.jrme.2022.1143 [44] 李中, 刘和兴, 李磊, 等, 2019. 基于改进的Bowers法预测南海陵水深水高温地层异常压力[J]. 西安石油大学学报(自然科学版), 34(6): 60-66, 73. [45] 刘建, 惠晨, 樊建明, 等, 2021. 鄂尔多斯盆地合水地区长6致密砂岩储层现今地应力分布特征及其开发建议[J]. 地质力学学报, 27(1): 31-39. [46] 孟文, 田涛, 孙东生, 等, 2022. 基于原位地应力测试及流变模型的深部泥页岩储层地应力状态研究[J]. 地质力学学报, 28(4): 537-549. [47] 孙东生, 庞飞, 李阿伟, 等, 2020. 基于流变模型的地应力剖面预测: 以贵州黔北地区安页1井为例[J]. 天然气工业, 40(3): 58-64. doi: 10.3787/j.issn.1000-0976.2020.03.007 [48] 夏宏泉, 彭梦, 宋二超, 2019. 岩石各向异性Biot系数的获取方法及应用[J]. 测井技术, 43(5): 478-483. doi: 10.16489/j.issn.1004-1338.2019.05.007 [49] 郑健, 何永生, 汪勇, 等, 2024. 基于FEM-DFN的页岩气井复杂裂缝扩展与优化: 以长宁页岩气藏X1水平井组为例[J]. 断块油气田, 31(3): 415-423. doi: 10.6056/dkyqt202403007 [50] 朱维耀, 马东旭, 2018. 页岩储层有效应力特征及其对产能的影响[J]. 天然气地球科学, 29(6): 845-852. doi: 10.11764/j.issn.1672-1926.2018.05.018 [51] 邹贤军, 陈亚琳, 2018. 四川盆地涪陵地区龙马溪组页岩横向各向同性地应力测井评价方法[J]. 天然气地球科学, 29(12): 1775-1780, 1808. doi: 10.11764/j.issn.1672-1926.2018.10.017 -

 下载:
下载:


计量
- 文章访问数: 1633
- HTML全文浏览量: 94
- PDF下载量: 165
- 被引次数: 0
