

Intelligent prediction method and application of single-well in-situ stress in shale reservoirs driven by multi-source data
-
摘要: 针对深层页岩具有“高温、高压、高应力及强塑性”的特点,现有地应力测试方法与测井解释模型存在预测精度低、耗时且推广能力弱等缺点,限制了地应力大小解释结果对页岩气勘探开发的有效指导。以川南复杂构造页岩气区块作为典型解剖区,充分利用井点钻、录、测、压裂等各类动、静态多源数据,并结合不同实验条件下的岩石物理参数、岩石力学及地应力大小的测试技术,采用机器学习与地质力学知识双向驱动的方法,构建了多方法融合的地应力大小智能预测方法,并将精细地应力解释剖面应用于页岩气高效开发。龙马溪组一段(龙一段)页岩受有机质含量、矿物组构及围压影响,使得整体下部①—④号小层的各向异性、力学性质及孔隙弹性效应明显强于上部小层。基于这种力学特征的差异,建立了适用于深层页岩的地应力各向同性解释模型。基于实验数据、工程数据及多向标定的地应力解释人工合成数据,形成了川南地区页岩储层地应力标准数据集。采用Pearson因子算法筛选了横波时差、电阻率、声波时差及杨氏模量等敏感特征参数,优化后的轻量级与极限梯度提升混合(L-XGBoost)融合智能模型实现三向地应力大小解释精度均在90%以上,且均方根误差、平均绝对误差及决定系数分别为6.63,3.89及0.91,具有推广泛化应用能力。纵向上受龙一段页岩岩相变化引起的力学强度波动,使其内部发育了4套应力隔挡层,其中①号层顶与⑥号层为2套强应力隔层,储隔应力差大于6 MPa,且褶皱变形挤压应力扰动区局部派生的挤压应力会增强纵向应力的隔挡作用,使得最小水平主应力值变大,造成压裂改造效果变差。研究揭示了龙一段页岩力学各向异性受控地质因素,并据此建立了适用于深层页岩的各向同性地应力解释模型。采用L-XGBoost融合智能模型实现三向地应力预测精度超过90%,明确了龙一段页岩4套应力隔挡层发育特征及其对压裂效果的影响。研究成果将为川东南复杂构造区页岩气纵向开发小层划分和水力压裂优化设计提供科学指导。Abstract:
Objective Deep shale reservoirs are characterized by high temperature, high pressure, elevated in situ stress, and strong plasticity. Conventional in-situ stress testing methods and log interpretation models, often calibrated under simplified laboratory conditions, suffer from limited predictive accuracy, high operational cost, and poor generalizability—challenges that constrain their utility in guiding shale gas exploration and development. Methods Focusing on a structurally complex shale gas block in southern Sichuan as a representative case, we integrated dynamic and static multi-source data across drilling, logging, testing, and production stages. Along with experimental measurements of the physical and mechanical properties of rock under different conditions, we developed a hybrid stress prediction model by combining machine learning techniques with geomechanical principles. This multi-method, log-based intelligent prediction framework enables the generation of high-resolution in-situ stress profiles for efficient shale gas development. Results In the first member of the Longmaxi Formation (Long-1 Member), organic content, confining pressure, and lamination structures significantly influence mechanical anisotropy, particularly in Beds 1–4, which exhibit stronger anisotropy than the upper beds. Based on these findings, we developed a mechanically calibrated anisotropic stress interpretation model for deep shales. Using laboratory- and field-calibrated synthetic stress datasets, we established a standardized stress database for the southern Sichuan shale reservoir. Key sensitive logging parameters, including shear wave slowness, resistivity, acoustic logs, and Young's modulus were identified via Pearson correlation analysis. An optimized XGBoost model achieved interpretation accuracies above 90% for all three principal stress components, with an RMSE of 6.63, an MAE of 3.89, and a coefficient of determination (R2) of 0.91, indicating strong robustness and generalizability. The results revealed four distinct stress barrier layers from the Wufeng Formation to the Longmaxi Formation, and the top of Bed 1 and Bed 6 acted as dominant stress-sealing interfaces. Localized compressive stresses induced by fold-related deformation further enhanced vertical stress compartmentalization and increased the minimum horizontal principal stress, thereby exerting significant influence on hydraulic fracturing performance. Conclusions The study revealed the geological factors controlling the mechanical anisotropy of the shale in the Long-1 Member, and established an isotropic in-situ stress interpretation model suitable for deep shale reservoirs accordingly. An integrated intelligent model, L-XGBoost, was adopted to achieve a prediction accuracy exceeding 90% for three-dimensional in-situ stresses. The research also clarified the development characteristics of four sets of stress barrier layers within the Long-1 Member shale and their impact on fracturing effectiveness. Significance These insights provide a scientific basis for fine-scale stratigraphic subdivision and three-dimensional well pattern design for shale gas development in the tectonically complex southeastern Sichuan Basin. -
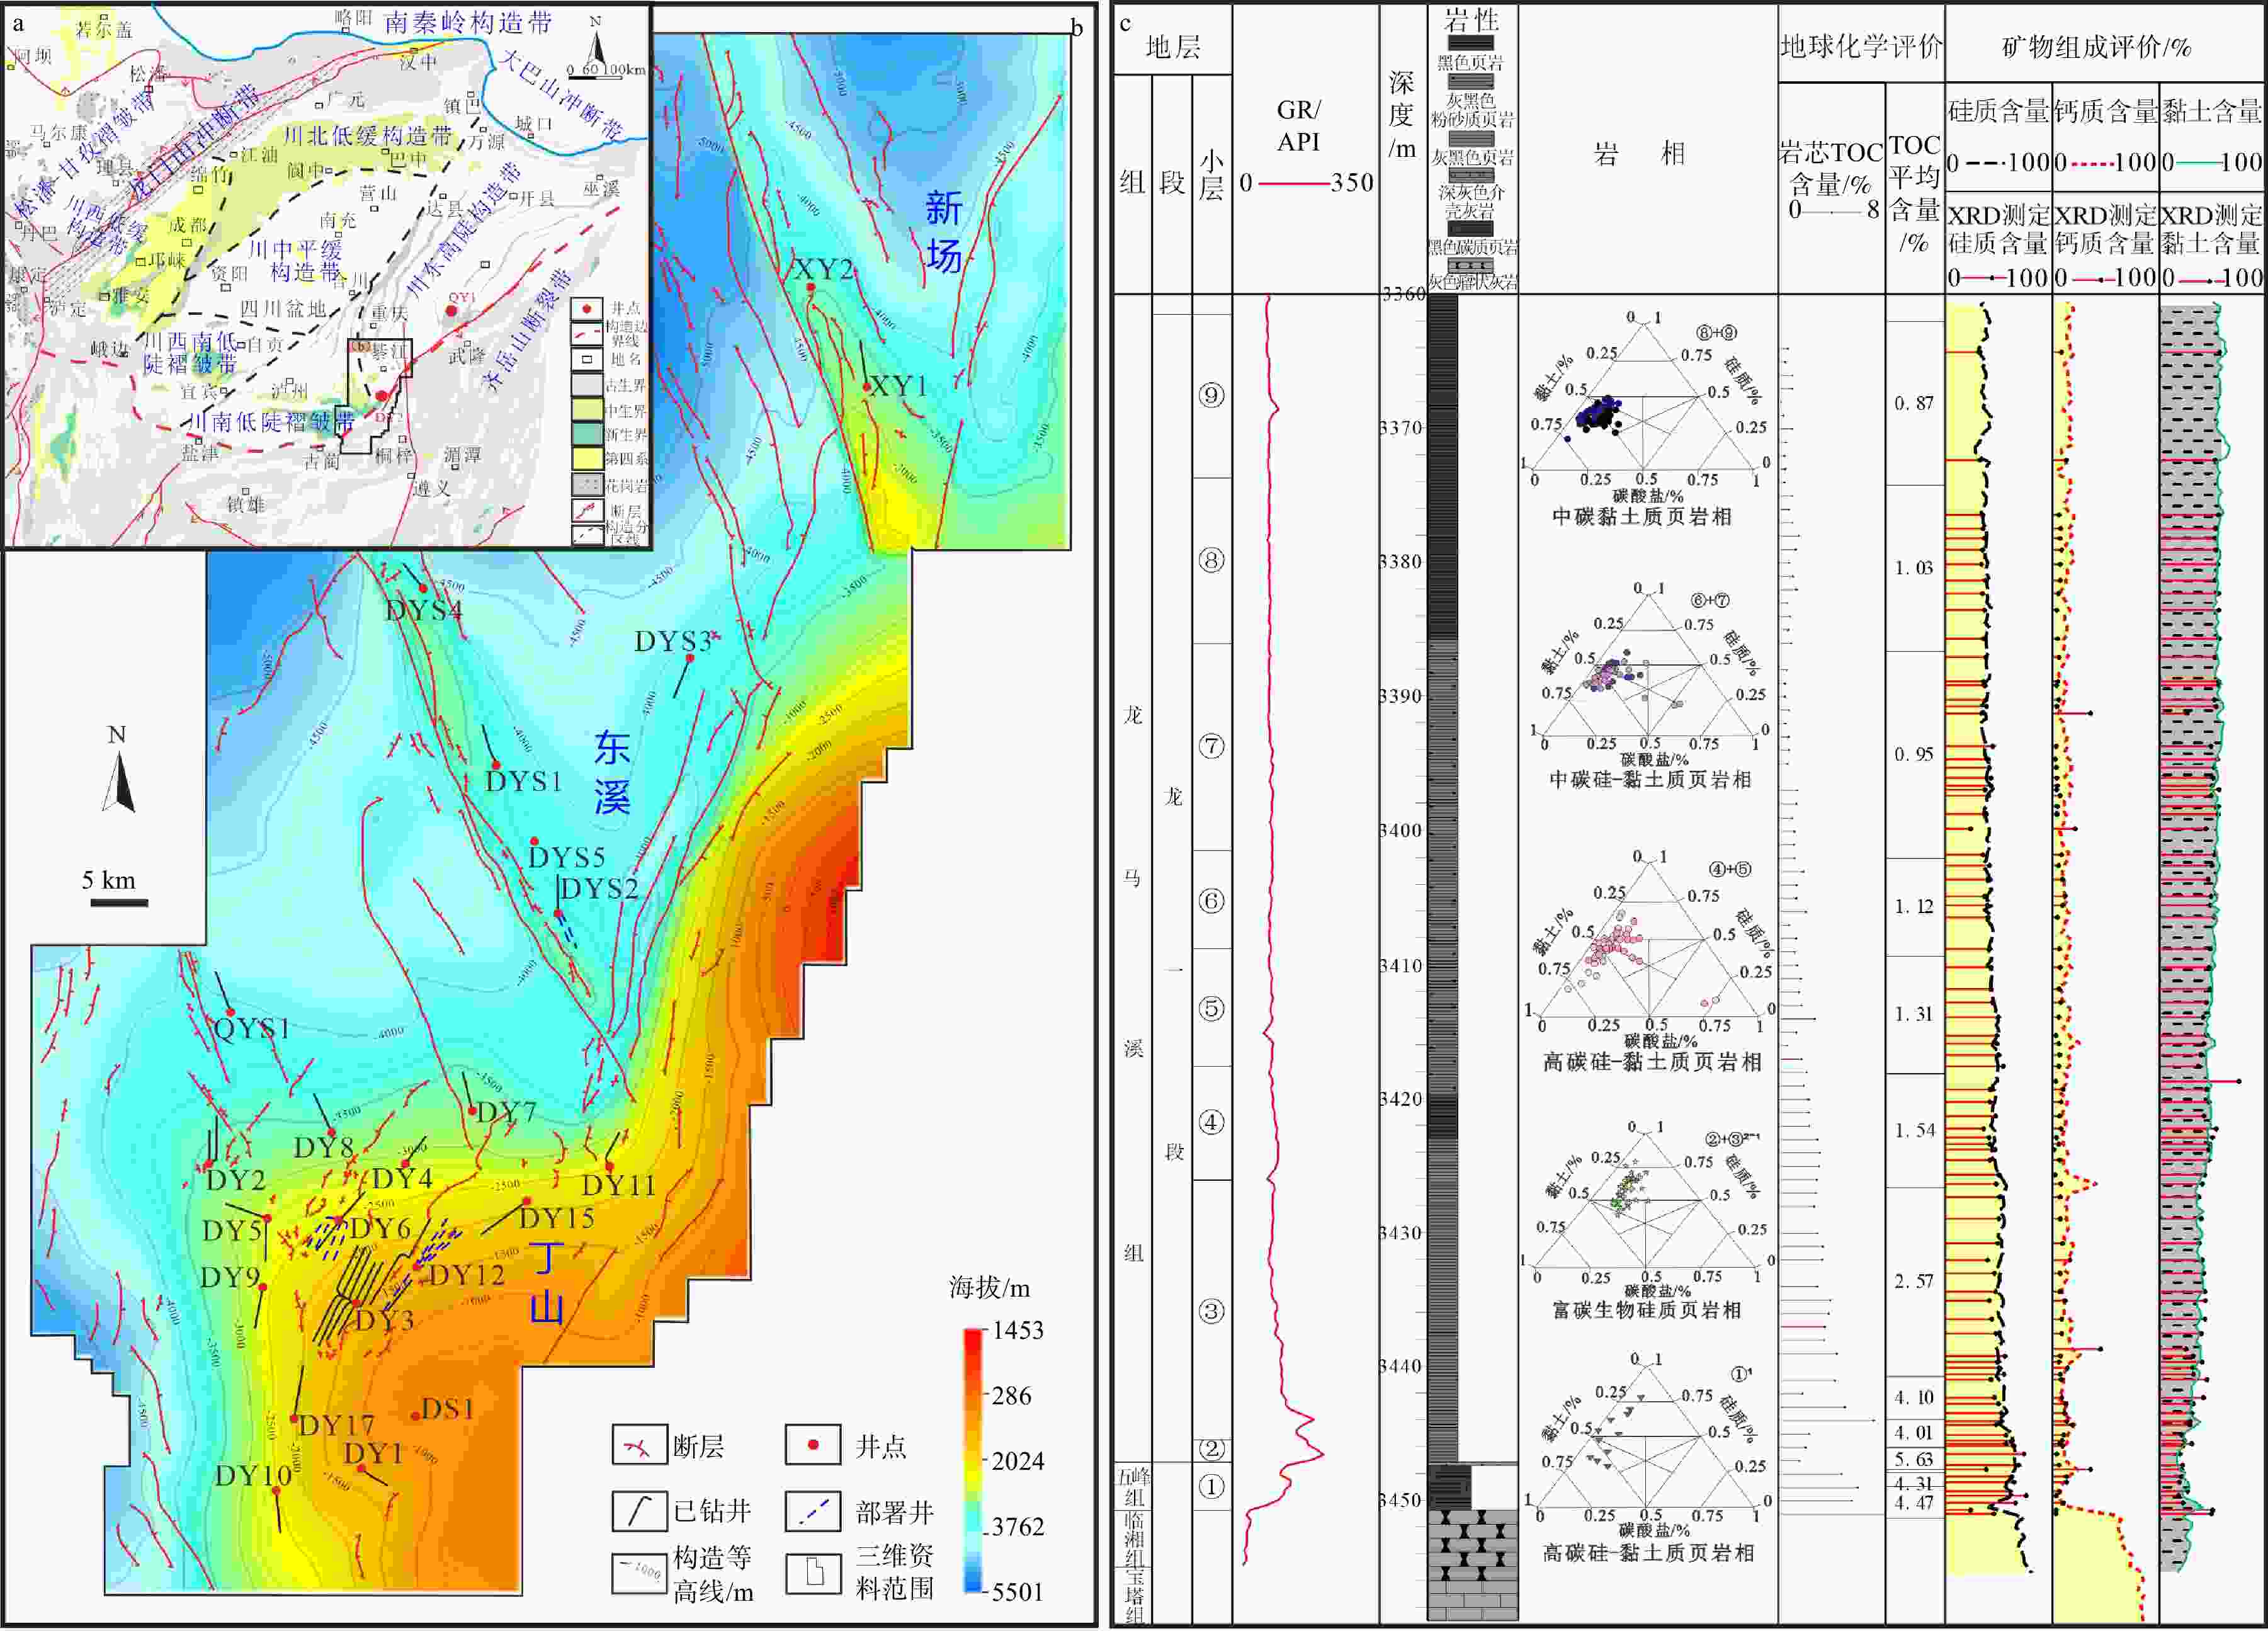
图 1 四川盆地构造单元划分及研究区构造特征和地层划分图
a—四川盆地及其周缘构造单元划分图;b—丁山—新场南五峰组—龙马溪组构造特征图;c—DY6-1井五峰组—龙一段页岩开发小层划分与储层综合评价图(硅质含量—测井解释获得的石英和长石含量总和;钙质含量—测井解释获得的方解石与白云石含量总和)
Figure 1. Tectonic framework and stratigraphic division of the Sichuan Basin and the study area
(a) Tectonic subdivision of the Sichuan Basin and adjacent structural units; (b) Structural characteristics of the Wufeng Formation to Longmaxi Formation in the Dingshan–Xinchangnan region; (c) Subdivision and reservoir evaluation of the Wufeng Formation to the first member of the Longmaxi Formation in Well DY6-1(siliceous content—total quartz and feldspar from log interpretation; calcareous content—total calcite and dolomite from log interpretation)
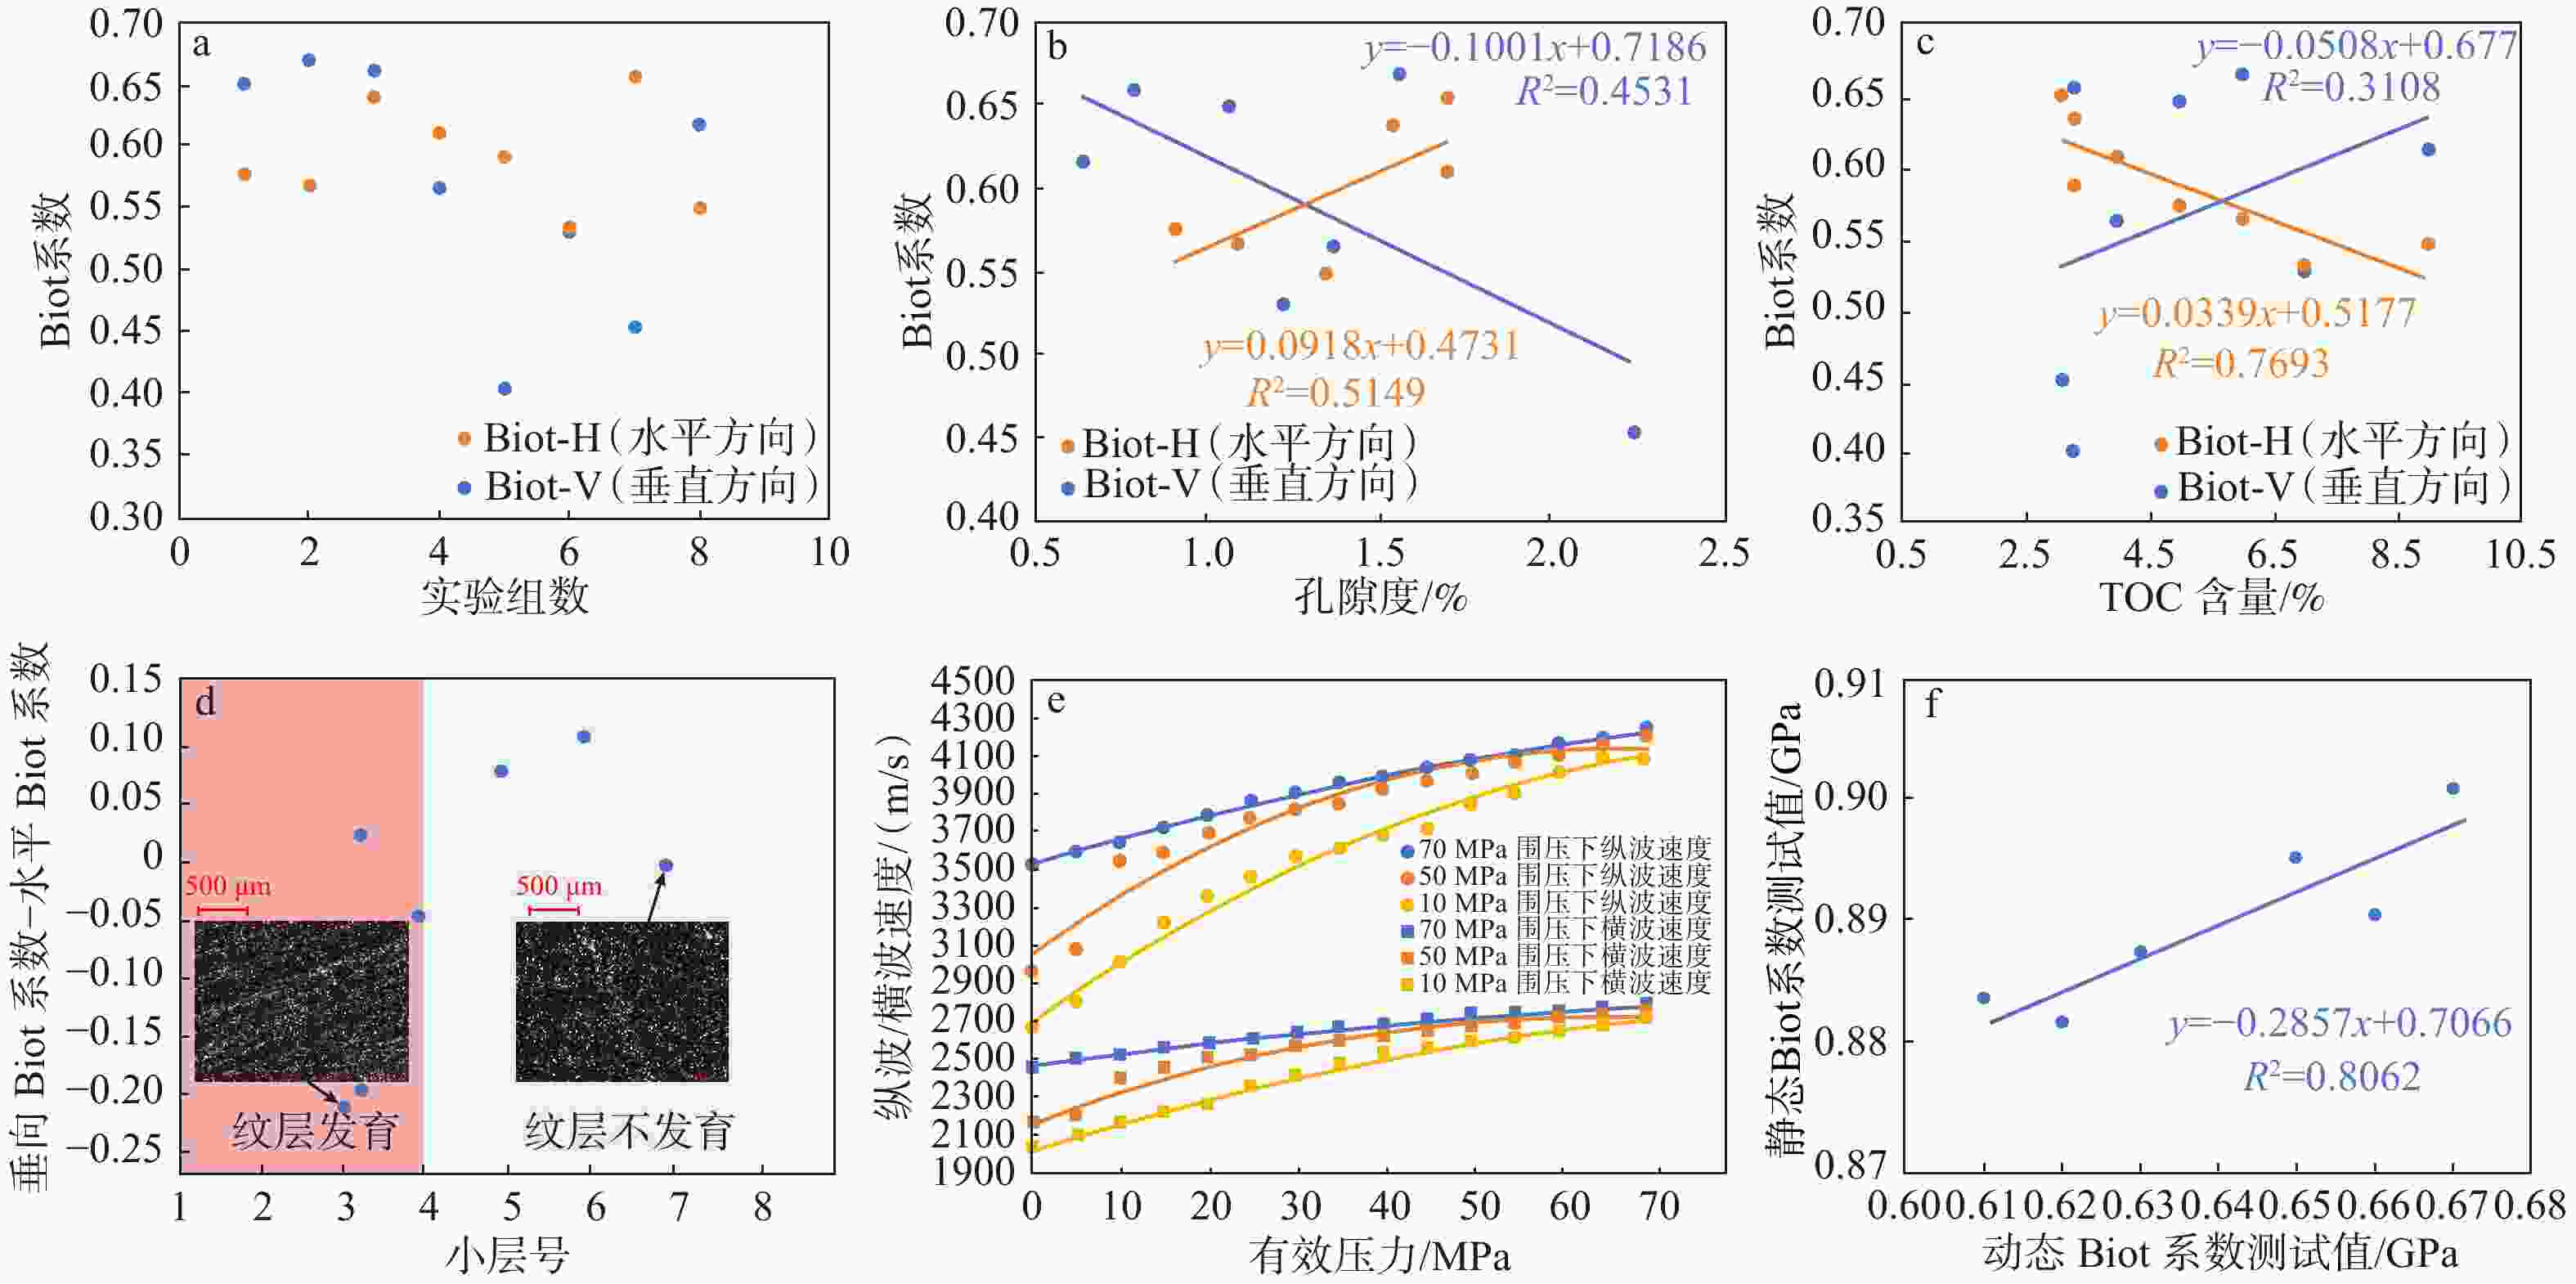
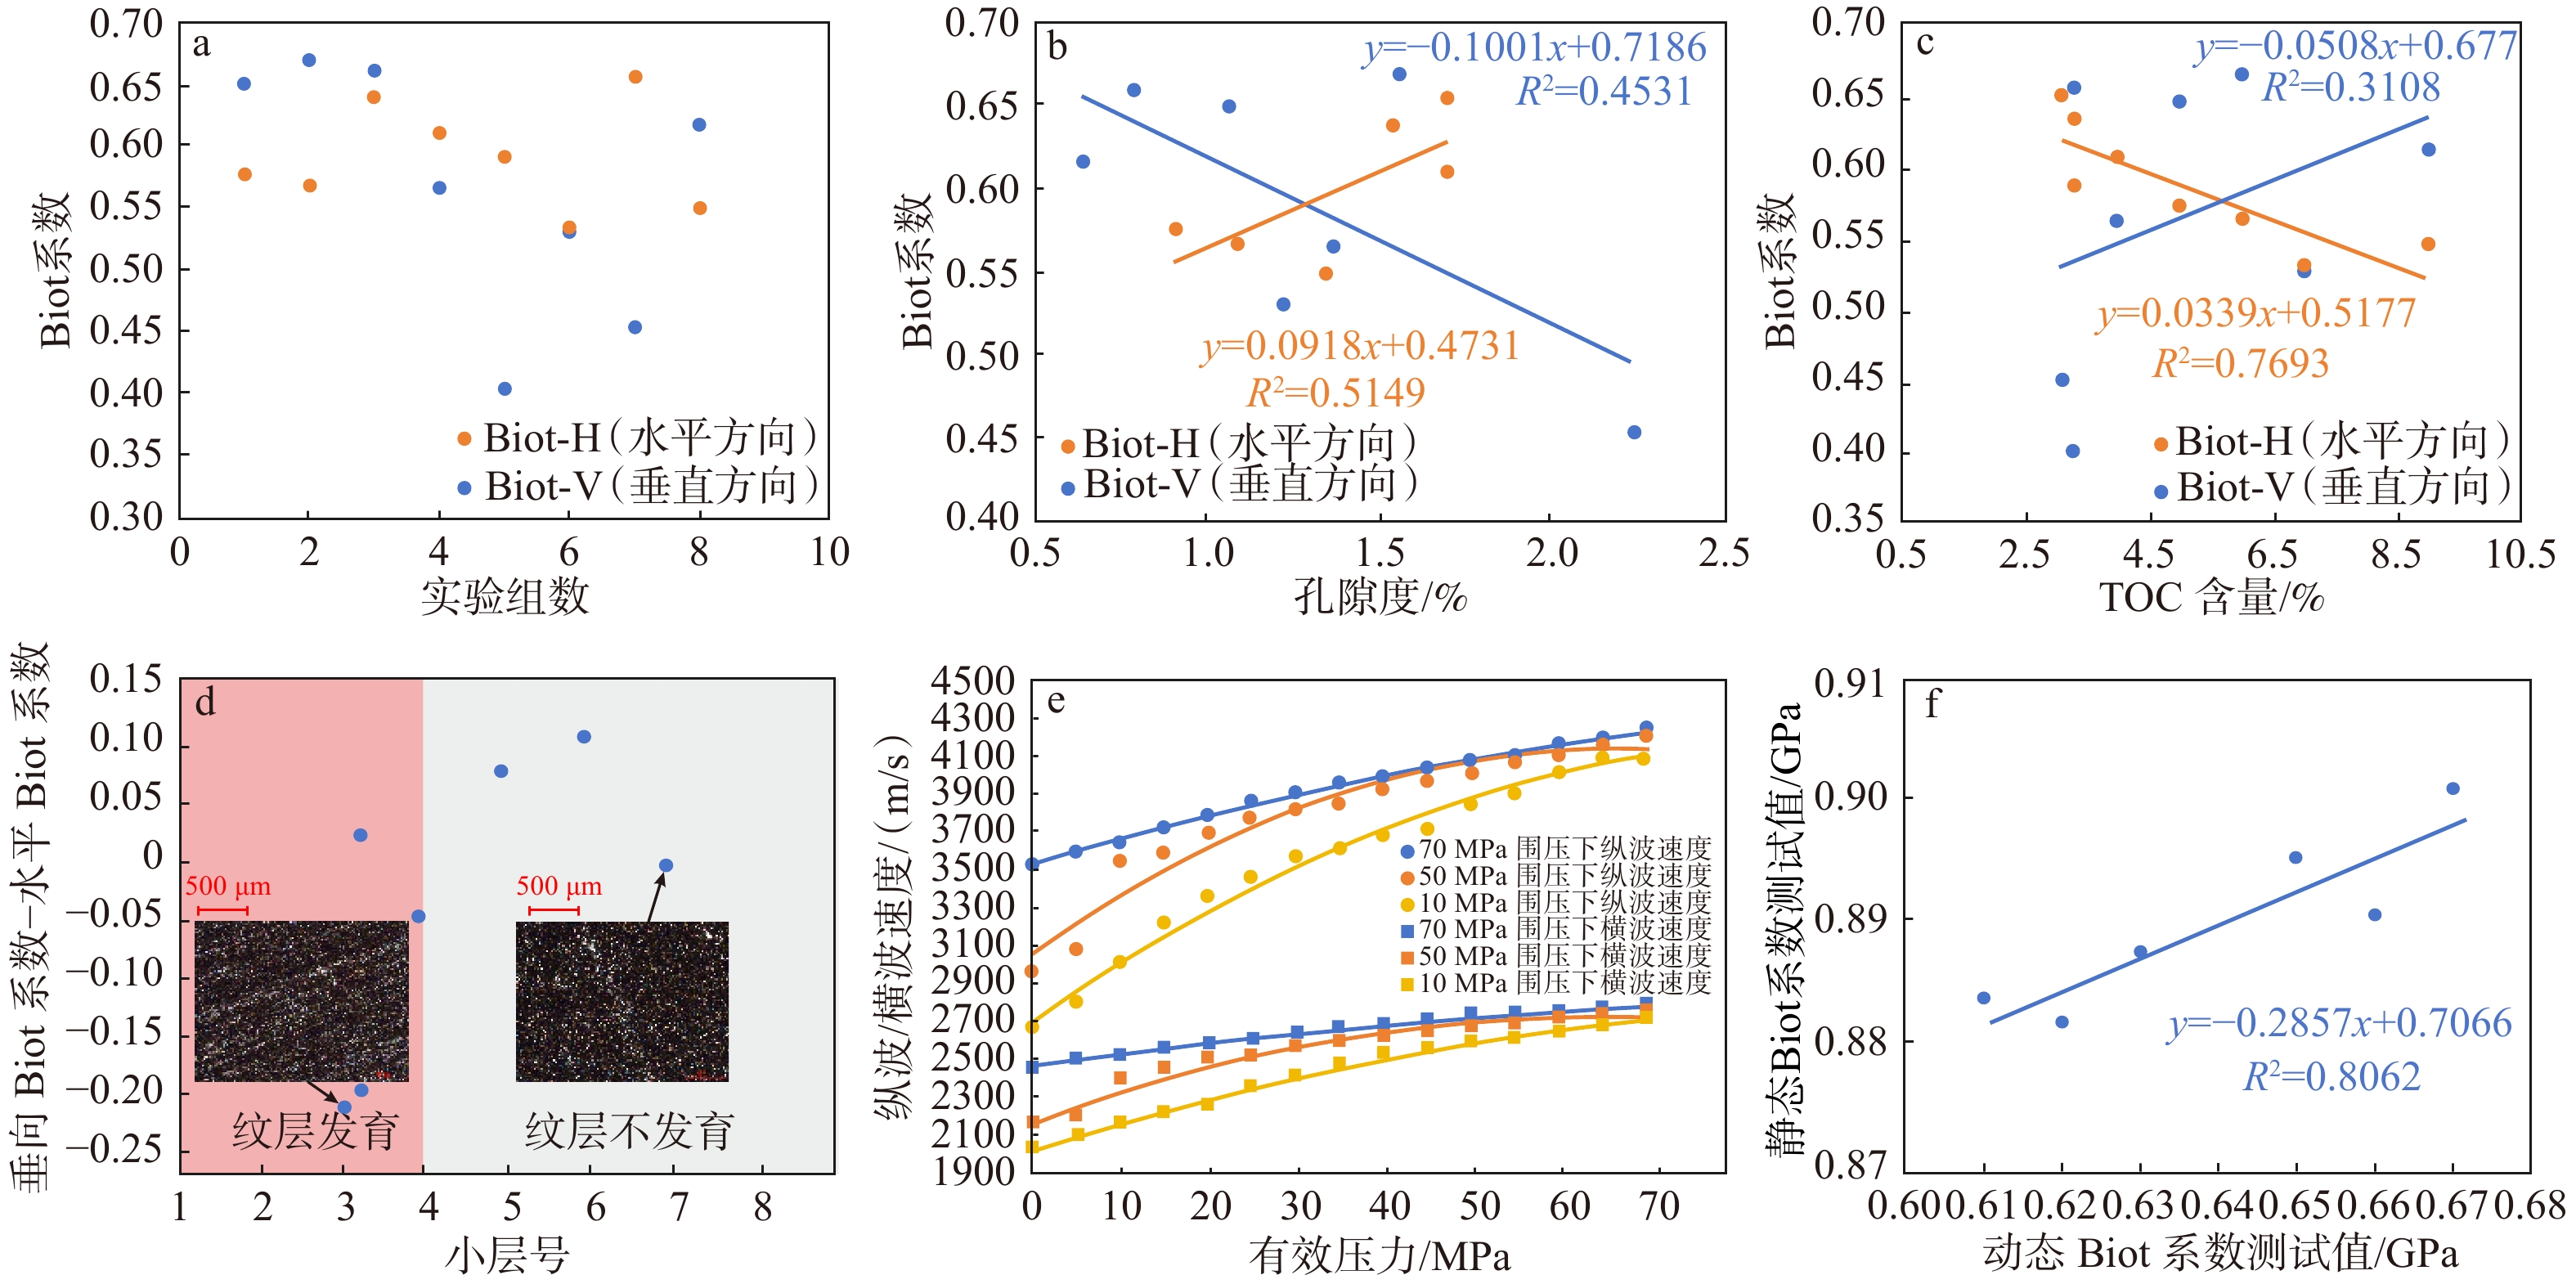
图 2 不同小层岩芯动态与静态Biot系数测试结果及其影响因素分析
a—8组动态Biot系数实验测试结果图;b—页岩孔隙度与Biot系数关系图;c—TOC含量与Biot系数关系图;d—龙一段各小层垂向和水平Biot系数测试差异值关系图;e—纵波速度和横波速度值随有效应力的变化关系图;f—动态和静态Biot系数校正关系模型图
Figure 2. Test results of dynamic and static Biot coefficients for cores from different beds and analysis of their influencing factors
(a) Experimental results from eight groups of dynamic Biot coefficient tests; (b) Relationship between shale porosity and dynamic Biot coefficient; (c) Relationship between total organic carbon (TOC) content and dynamic Biot coefficient; (d) Variations in vertical and horizontal dynamic Biot coefficients across beds of the first member of the Longmaxi Formation; (e) Variation of P-wave and S-wave velocities with effective stress; (f) Correlation between dynamic and static Biot coefficients
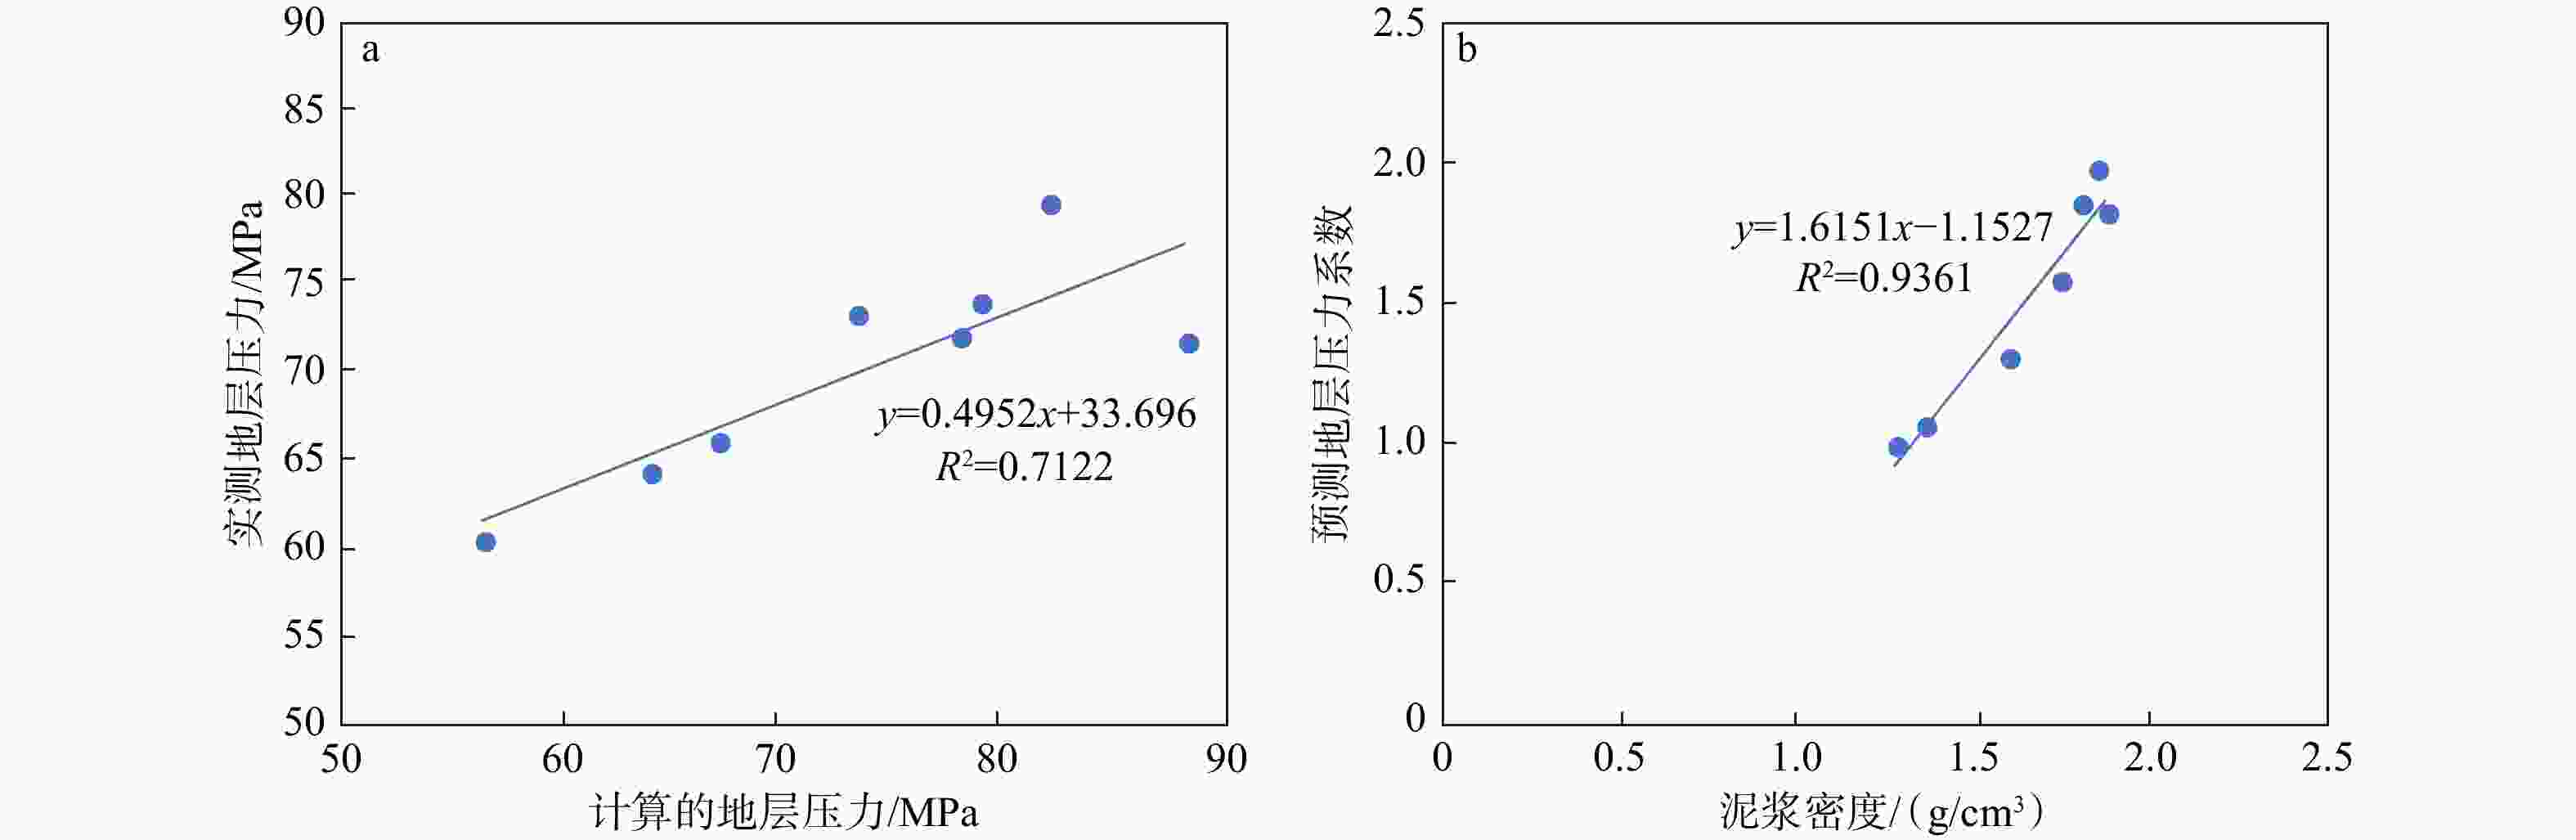
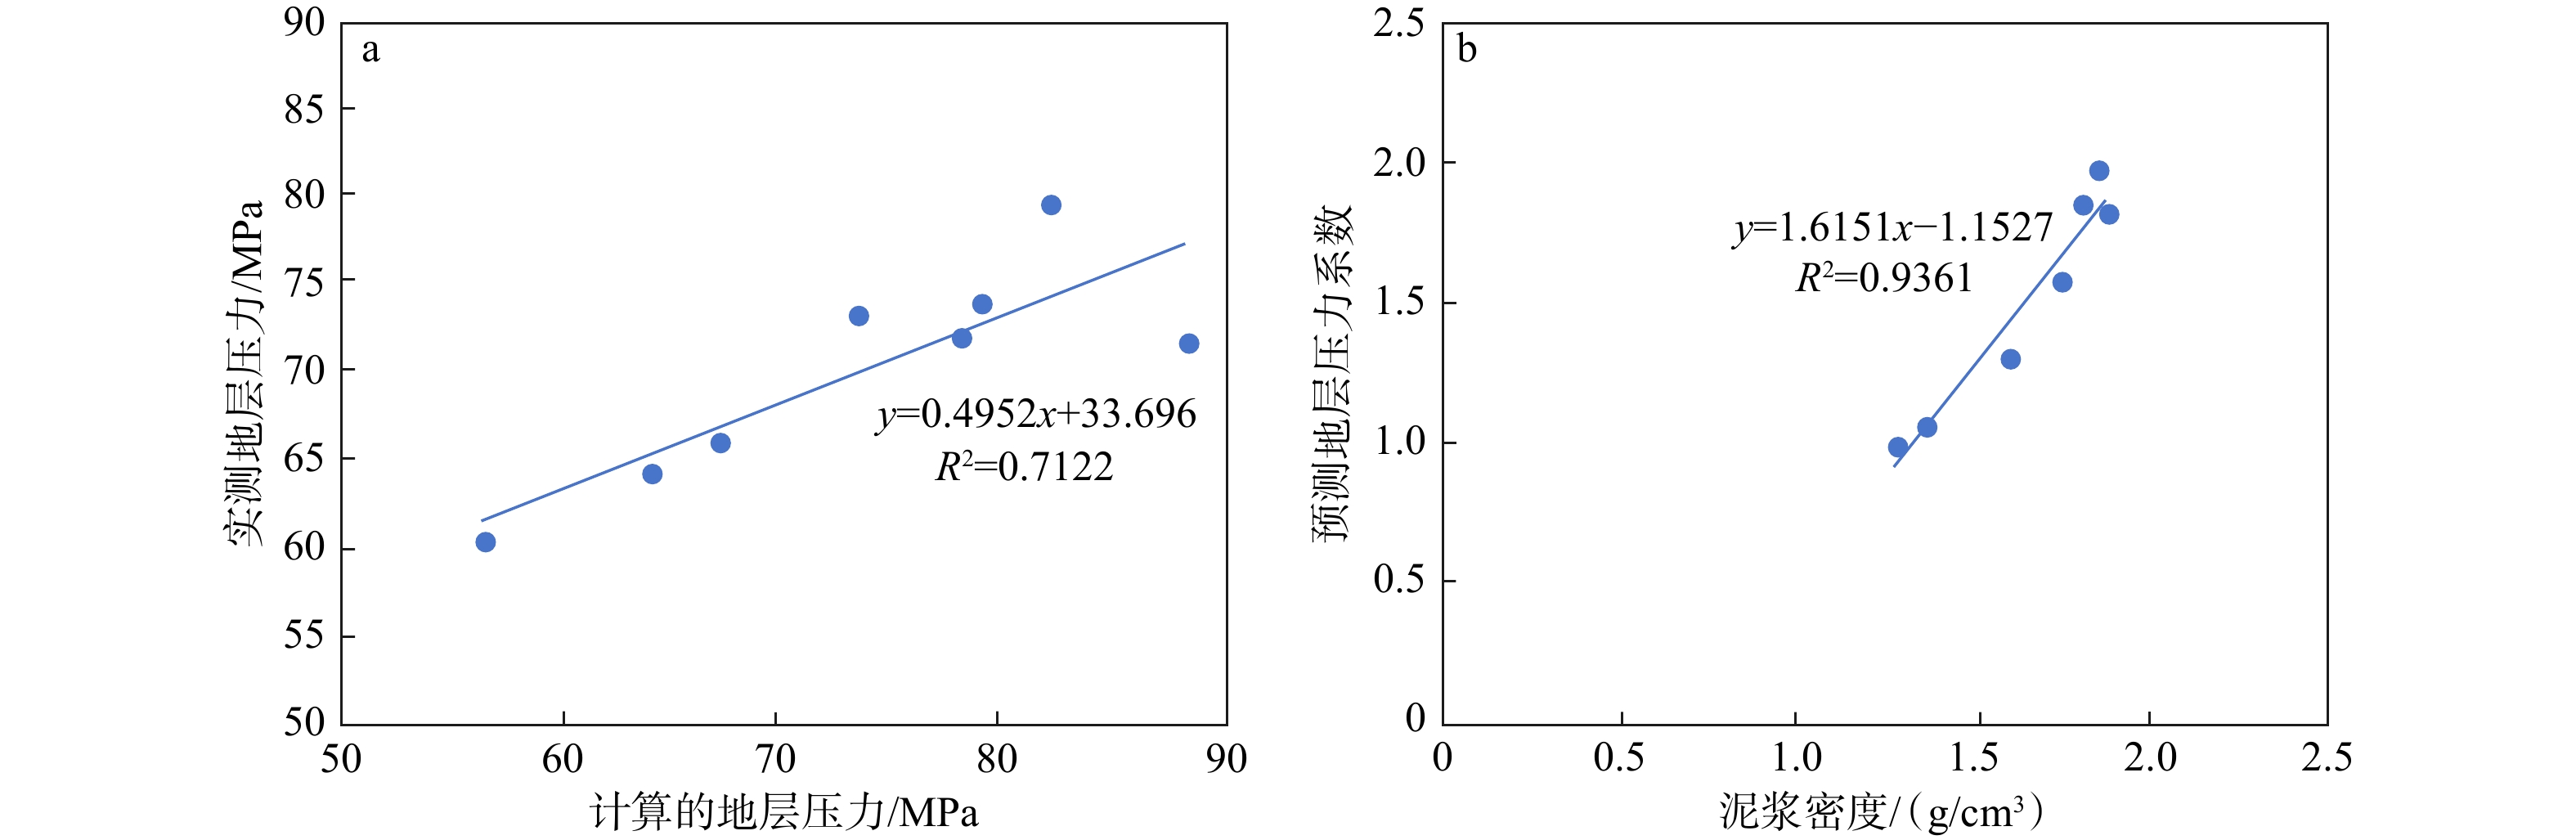
图 3 地层压力预测结果与校验分析图
a—基于有效应力法计算的孔隙压力计算值与实测值对比;b—预测孔隙压力与泥浆密度关系图
Figure 3. Formation pressure prediction and validation analysis
(a) Comparison between calculated pore pressure (based on the effective stress method) and measured values; (b) Relationship between pore pressure and mud density
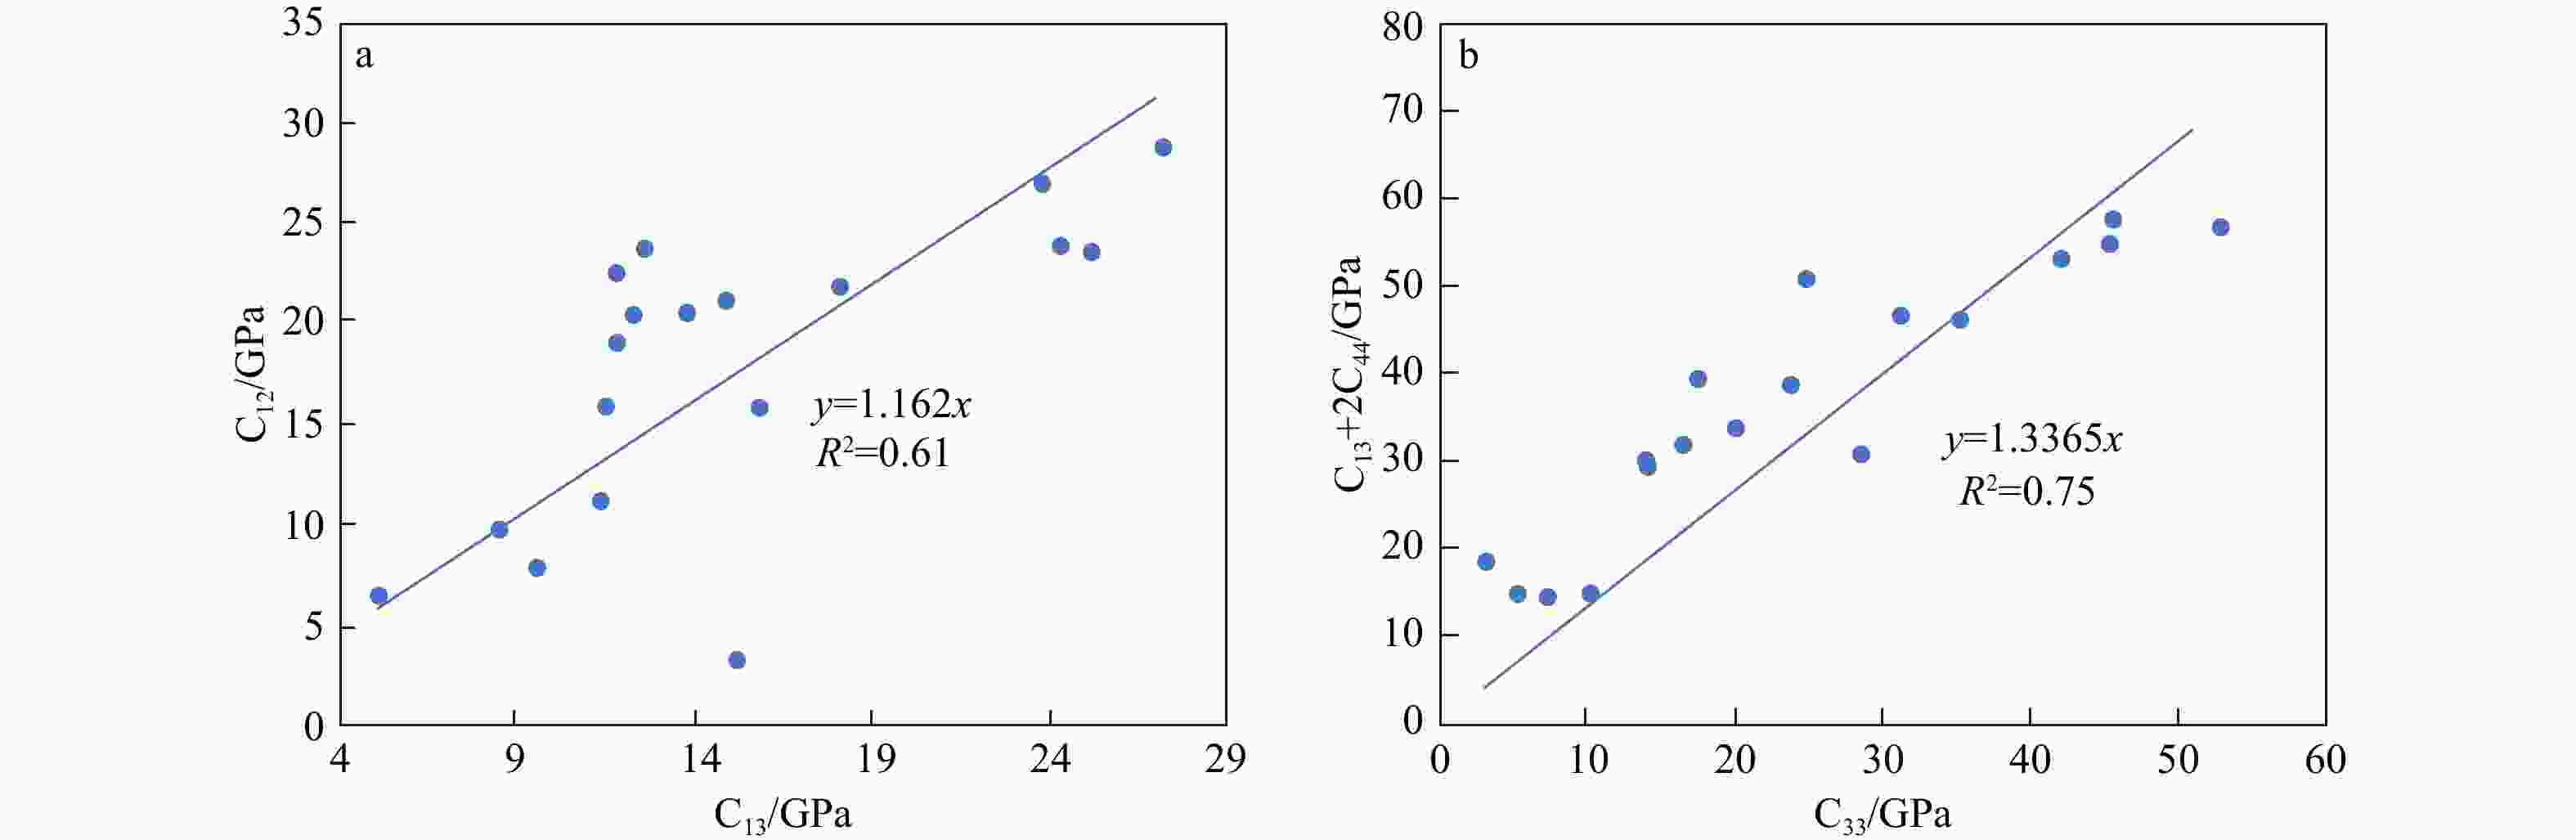
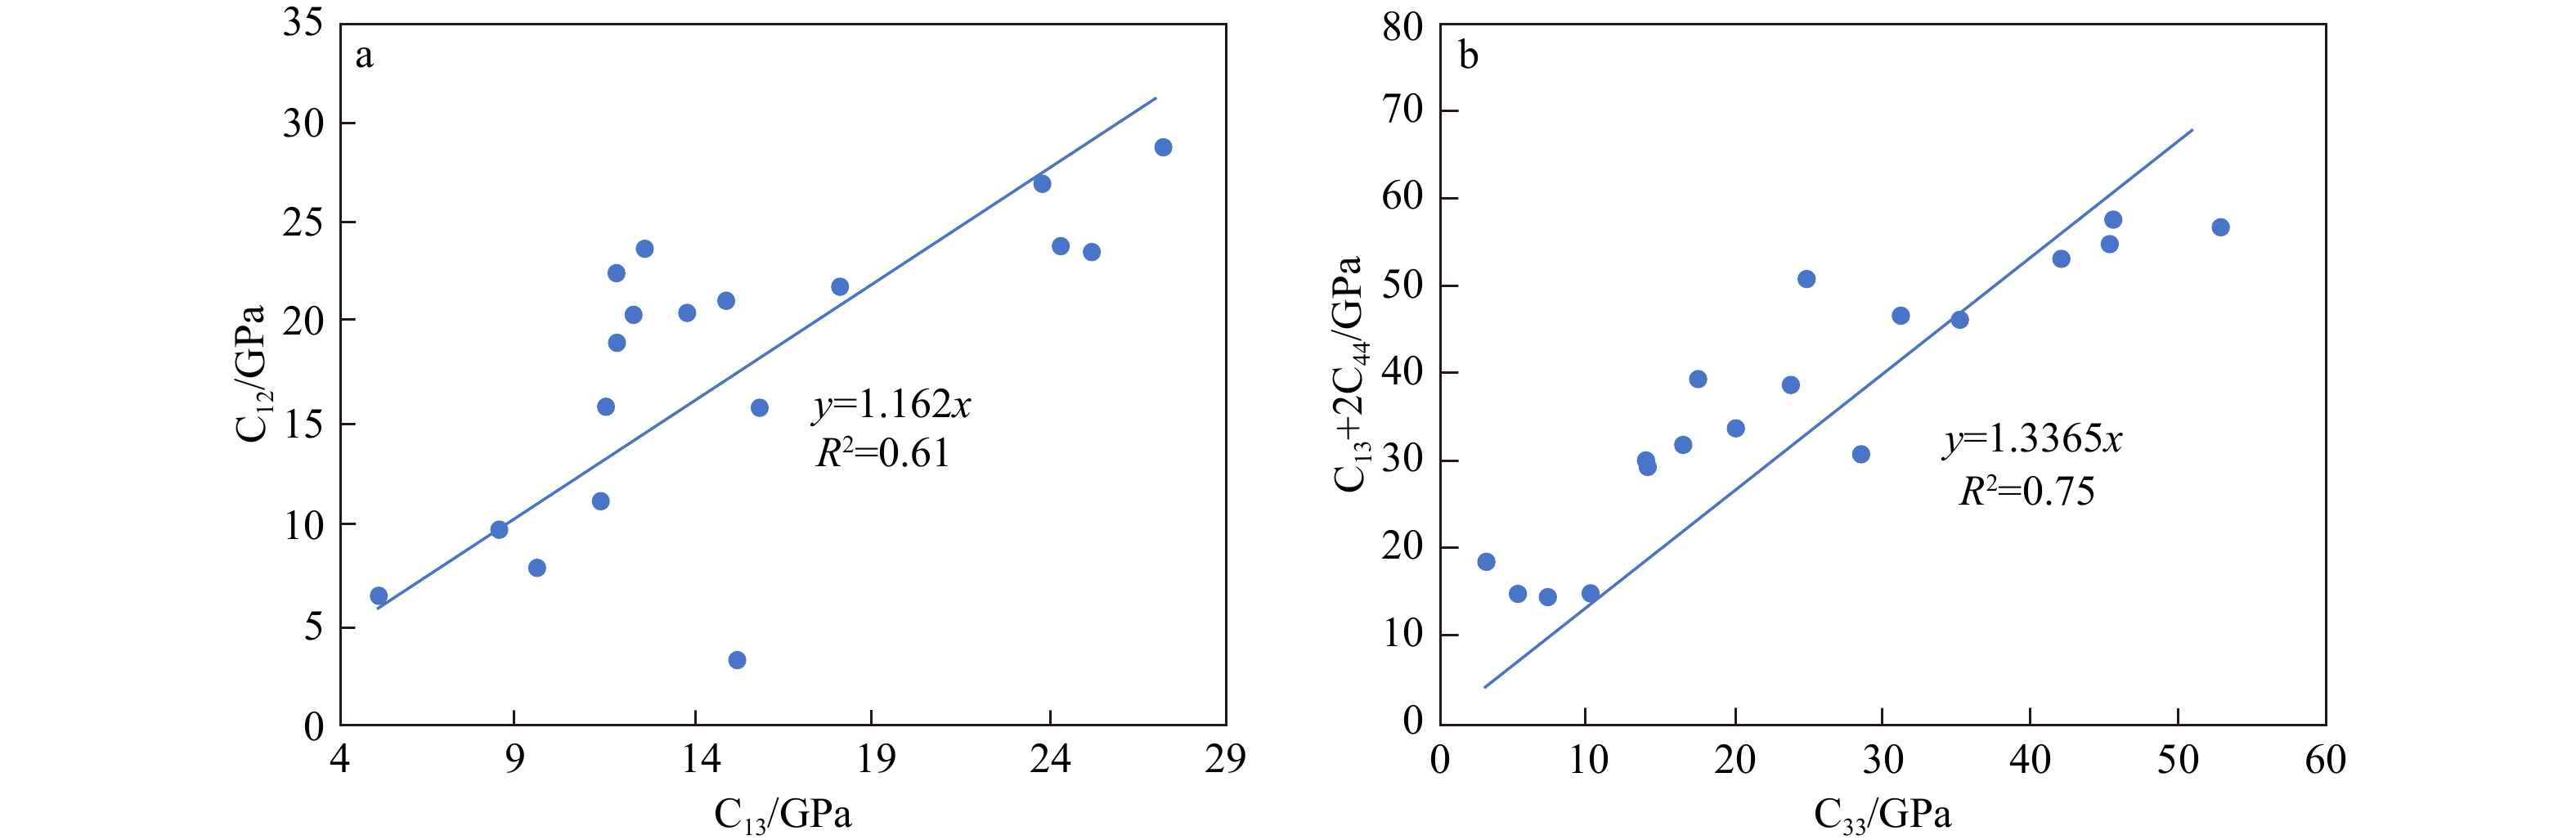
图 4 龙马溪组页岩刚度系数矩阵关键参数解释模型构建图
a—参数C12和C13的关系图;b—参数C33和C13+2C44的关系图
Figure 4. Diagram illustrating the construction of the interpretation model for key parameters in the stiffness coefficient matrix of Longmaxi Formation shale
(a) Relationship between parameters C12 and C13; (b) Relationship between parameters C33 and C13+2C44

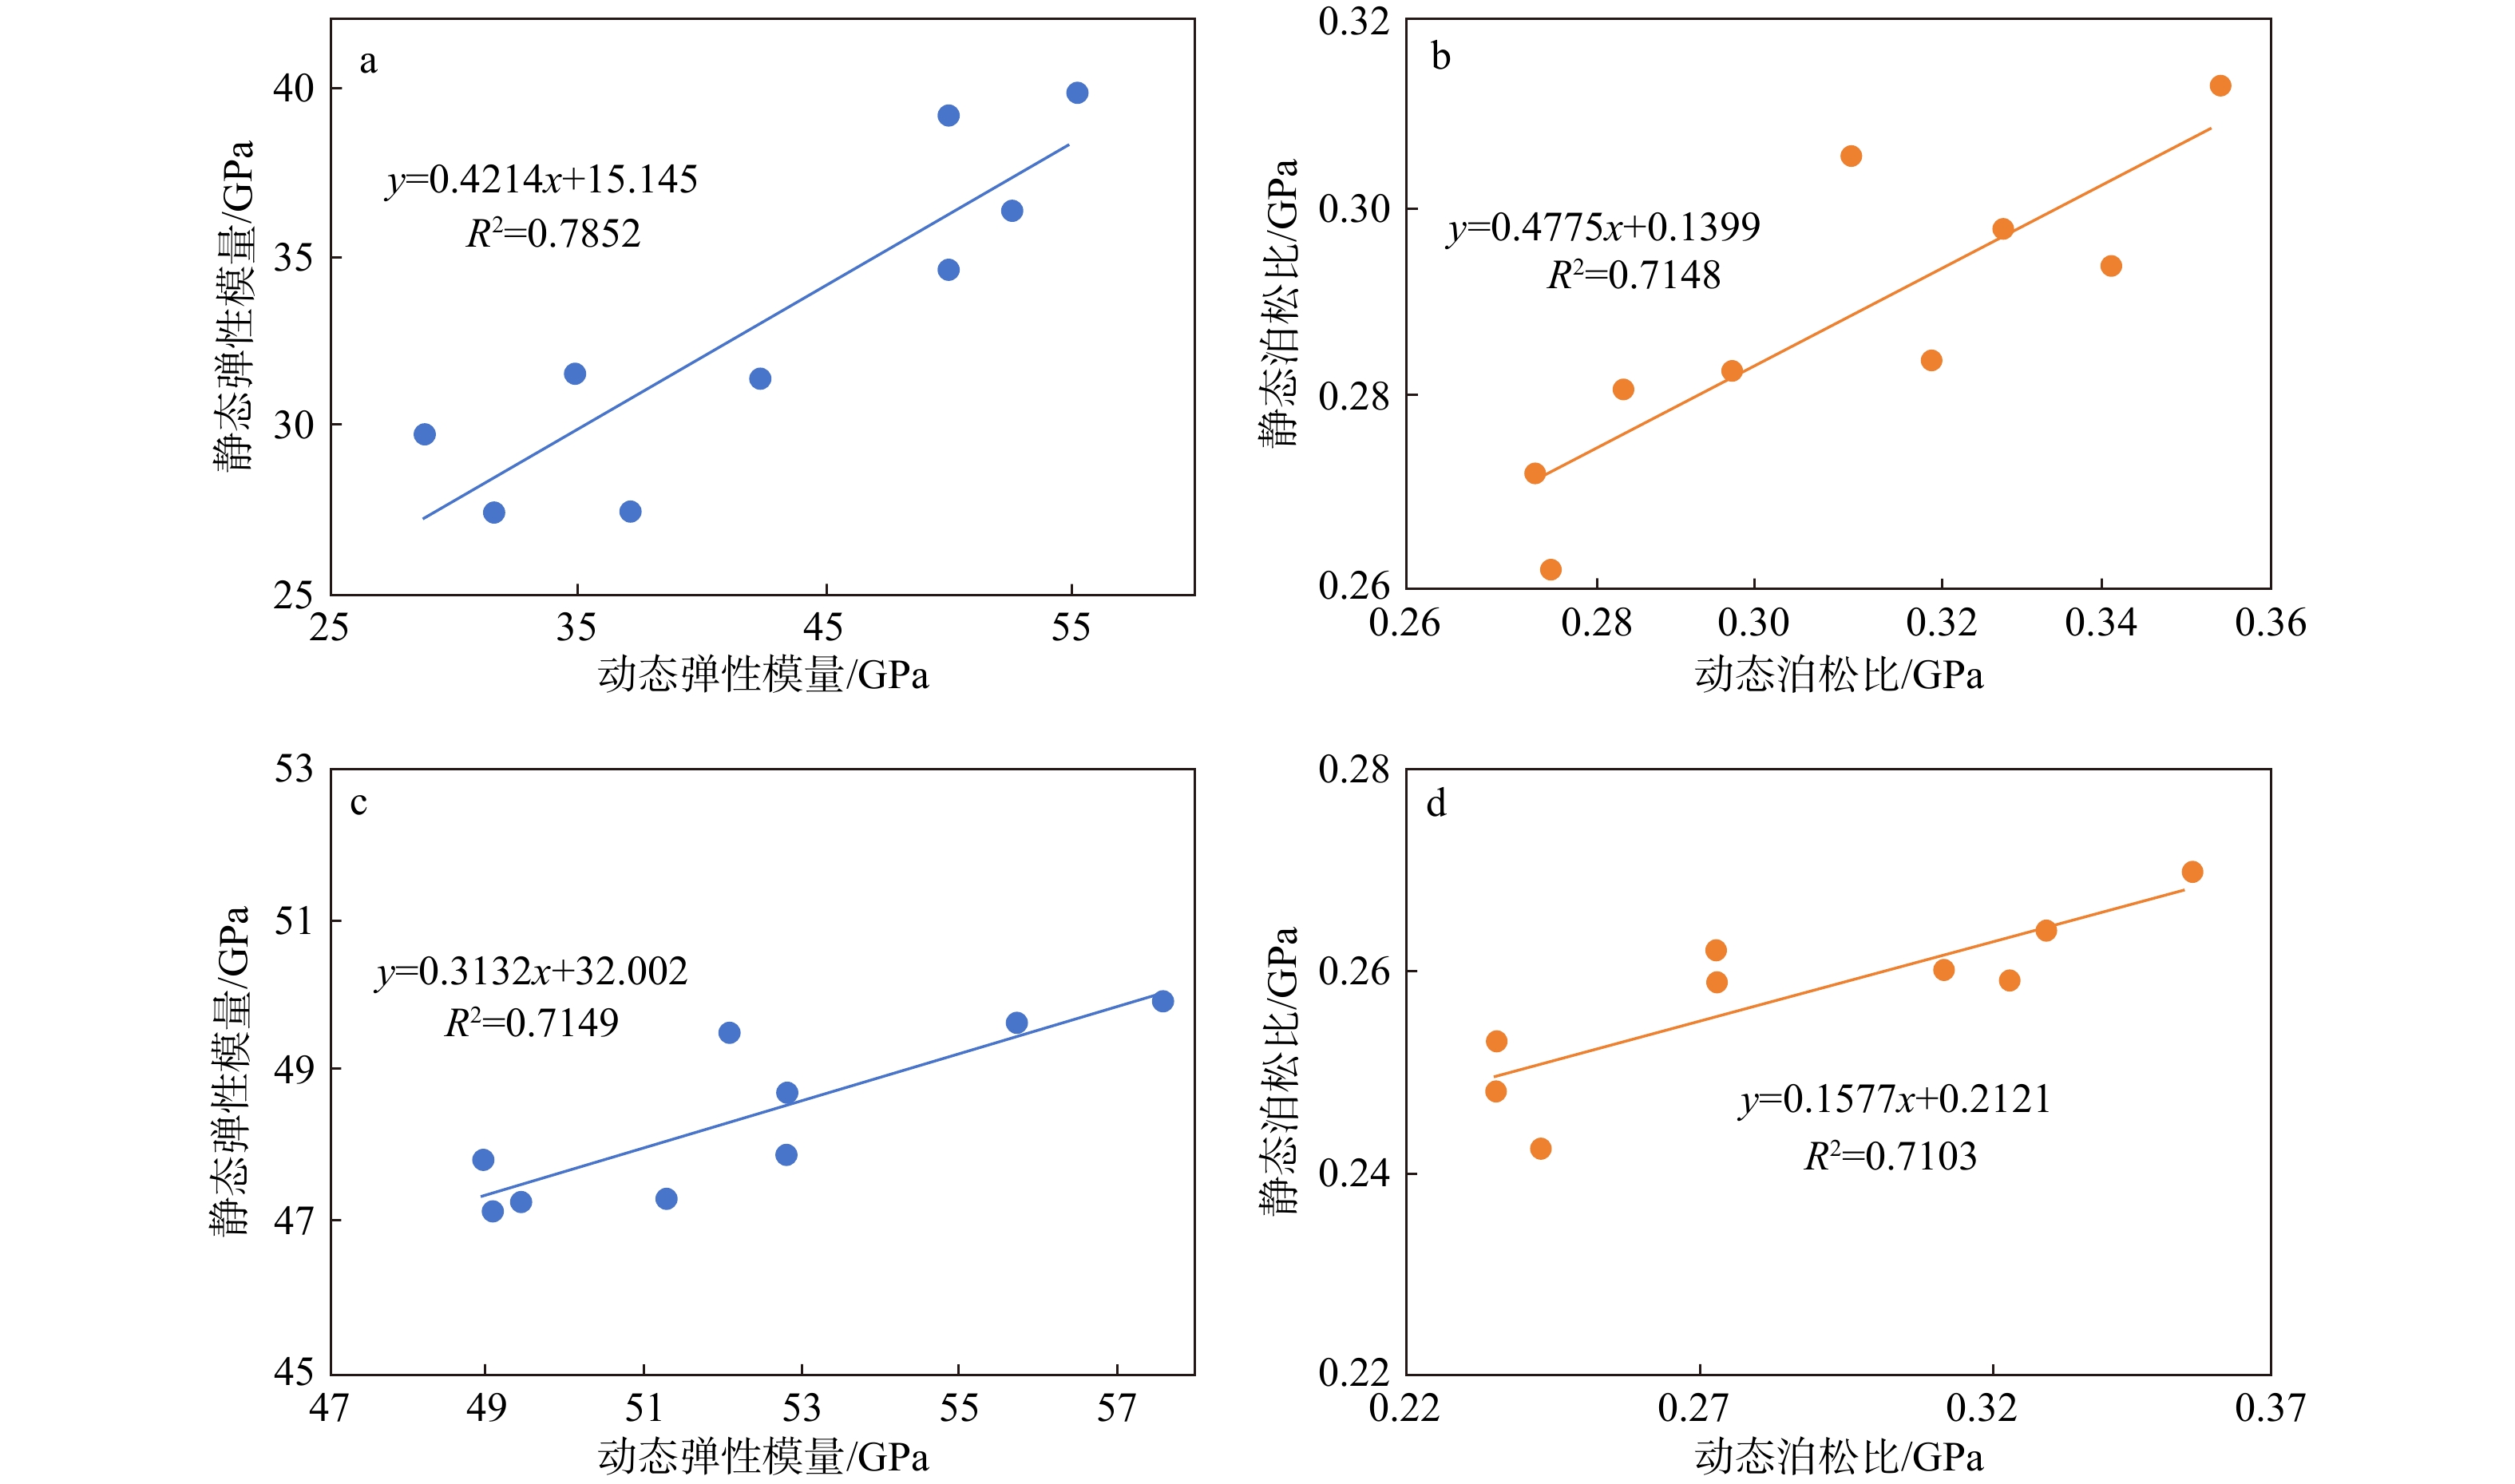
图 5 垂直和水平方向岩石力学参数动静态转换关系模型图
a—垂直方向弹性模量动、静态转换关系图;b—垂直方向泊松比动、静态转换关系图;c—水平方向弹性模量动、静态转换关系图;d—水平方向泊松比动、静态转换关系图
Figure 5. Dynamic-to-static conversion of mechanical rock parameters of the first member of Longmaxi Formation
(a) Vertical elastic modulus; (b) Vertical Poisson 's ratio; (c) Horizontal elastic modulus; (d) Horizontal Poisson 's ratio
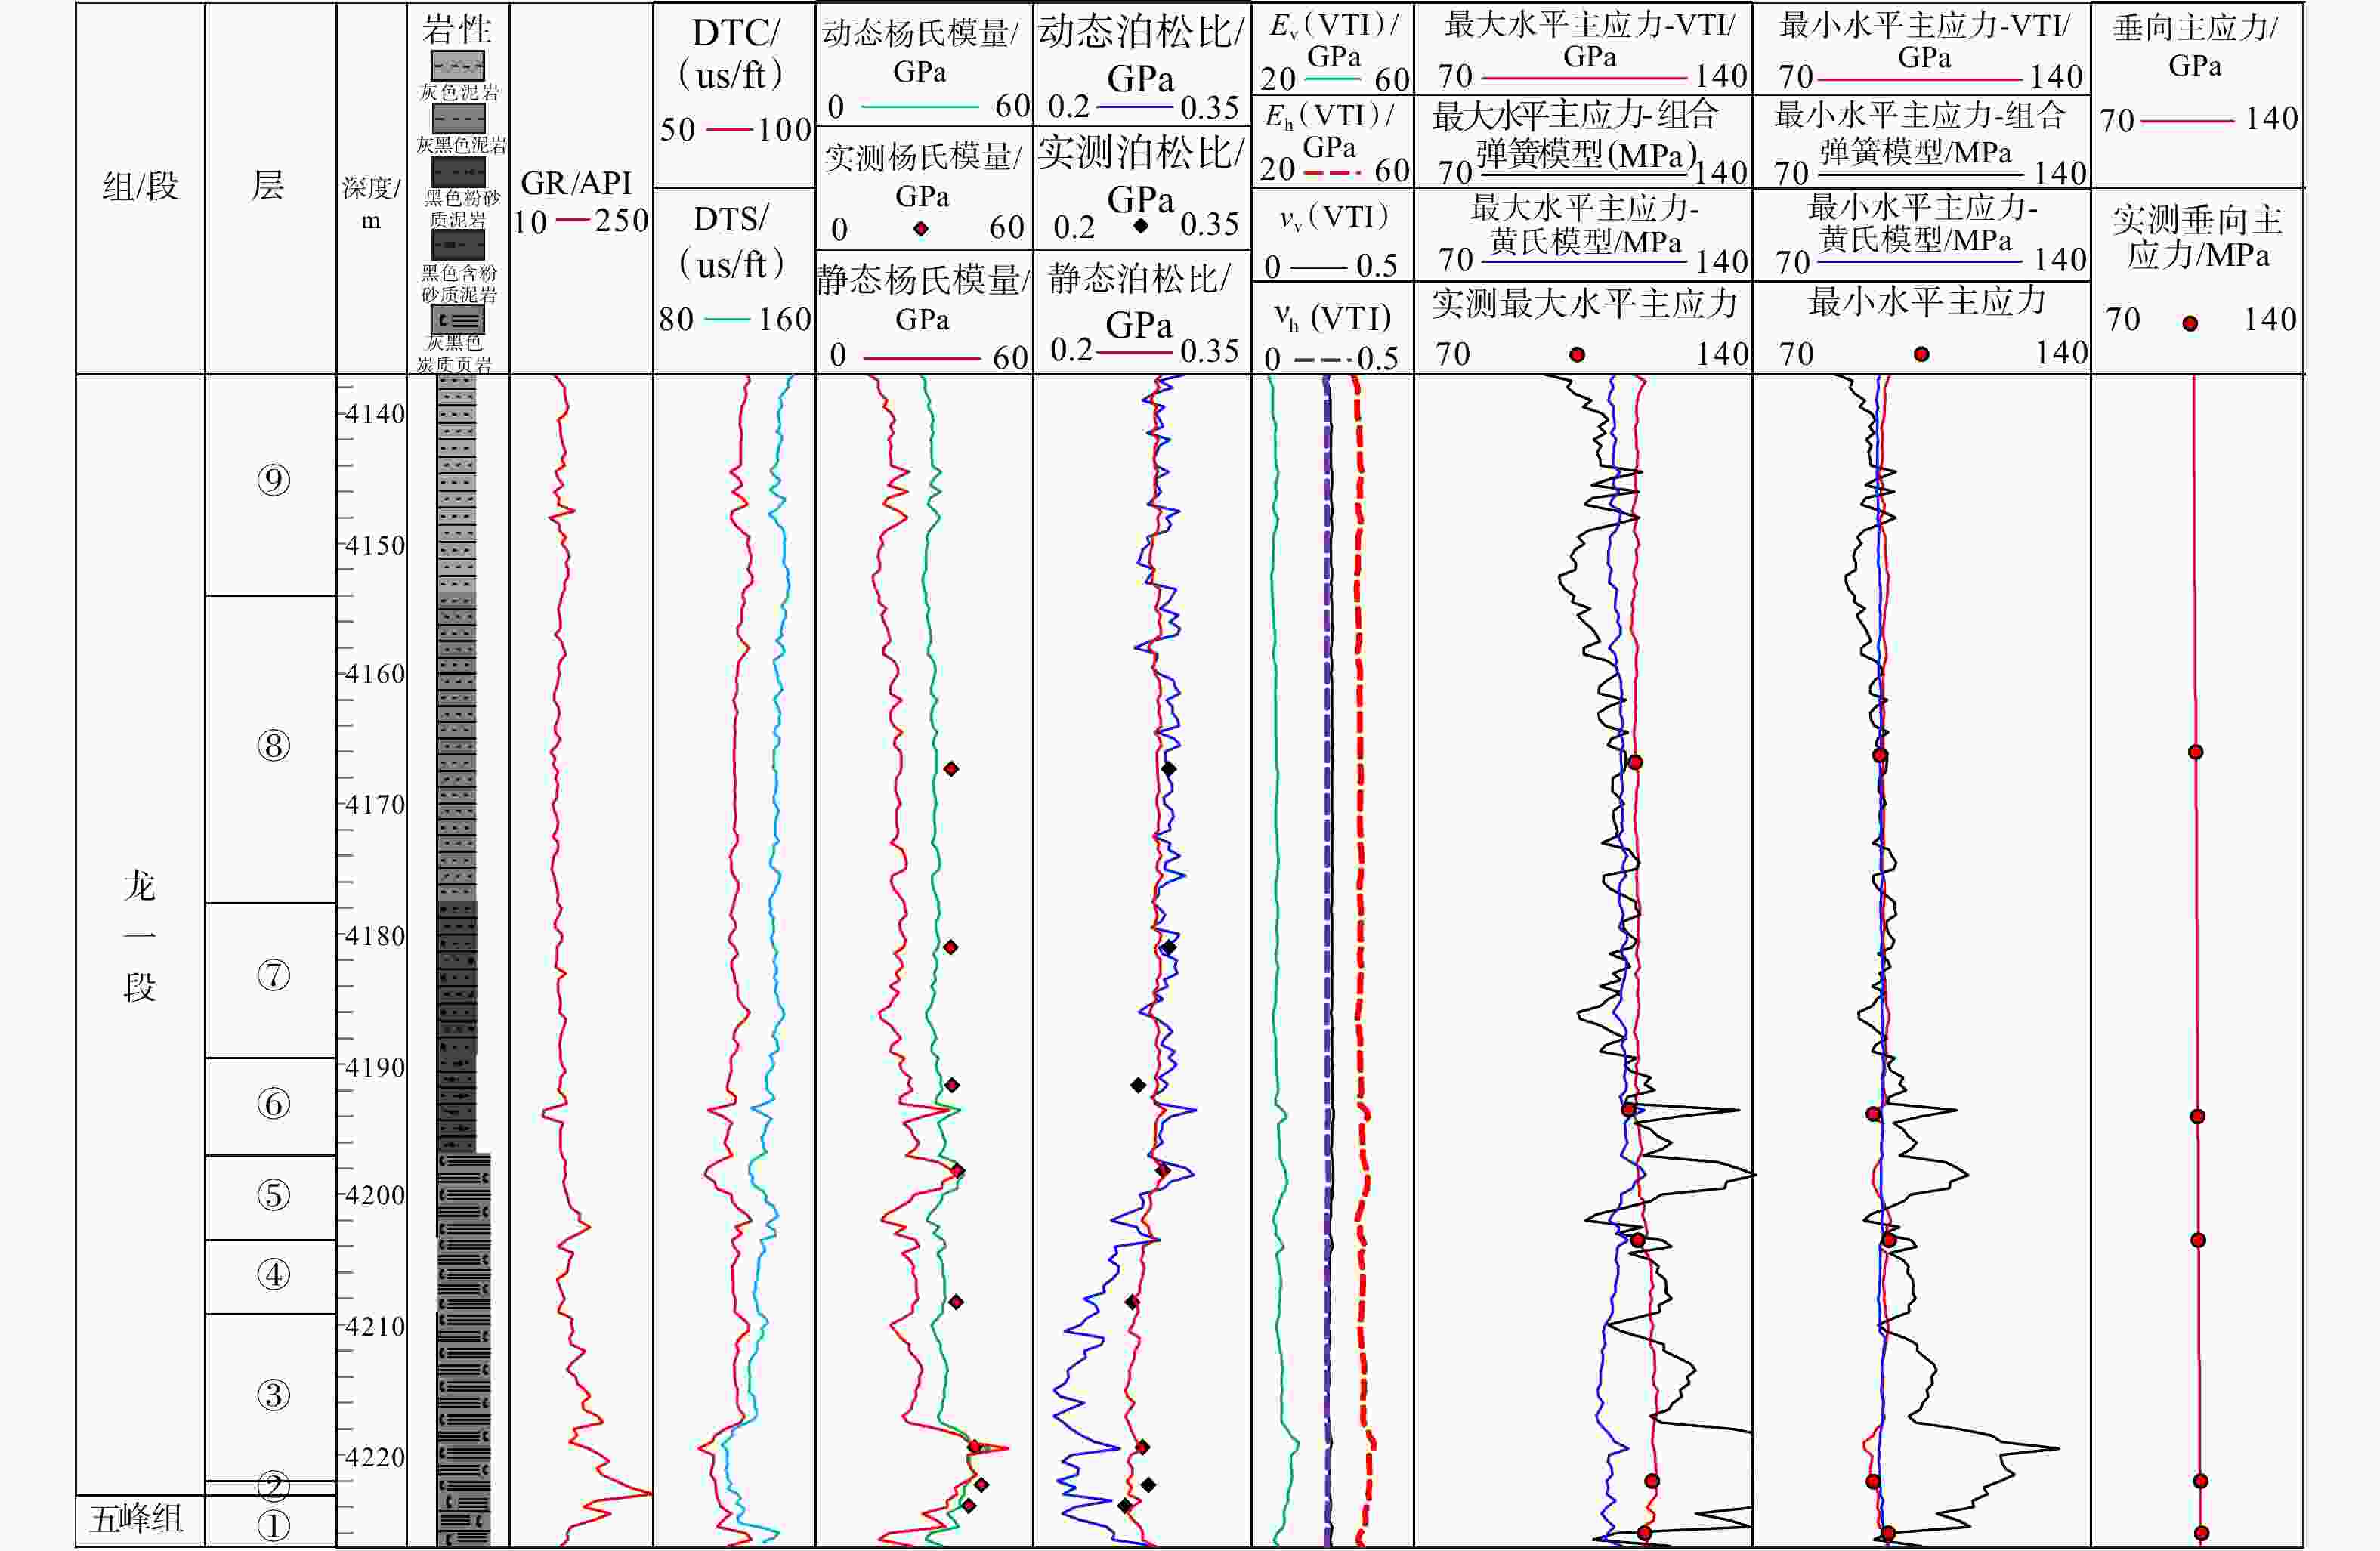
图 6 DYS1井龙一段各模型计算地应力大小结果
DTS—横波时差;DTC—纵波时差;GR—自然伽马;Ev—垂直方向的弹性模量;Eh—水平方向的弹性模量;νv—垂直方向的泊松比;νh—水平方向的泊松比
Figure 6. Variable model-derived in situ stress magnitudes for the first member of Longmaxi Formation at well DYS1
DTS—shear wave slowness; DTC—compressional wave slowness; GR—gamma ray; Ev—vertical Young‘s modulus; Eh—horizontal Young’s modulus; νv—vertical Poisson‘s ratio; νh—horizontal Poisson’s ratio
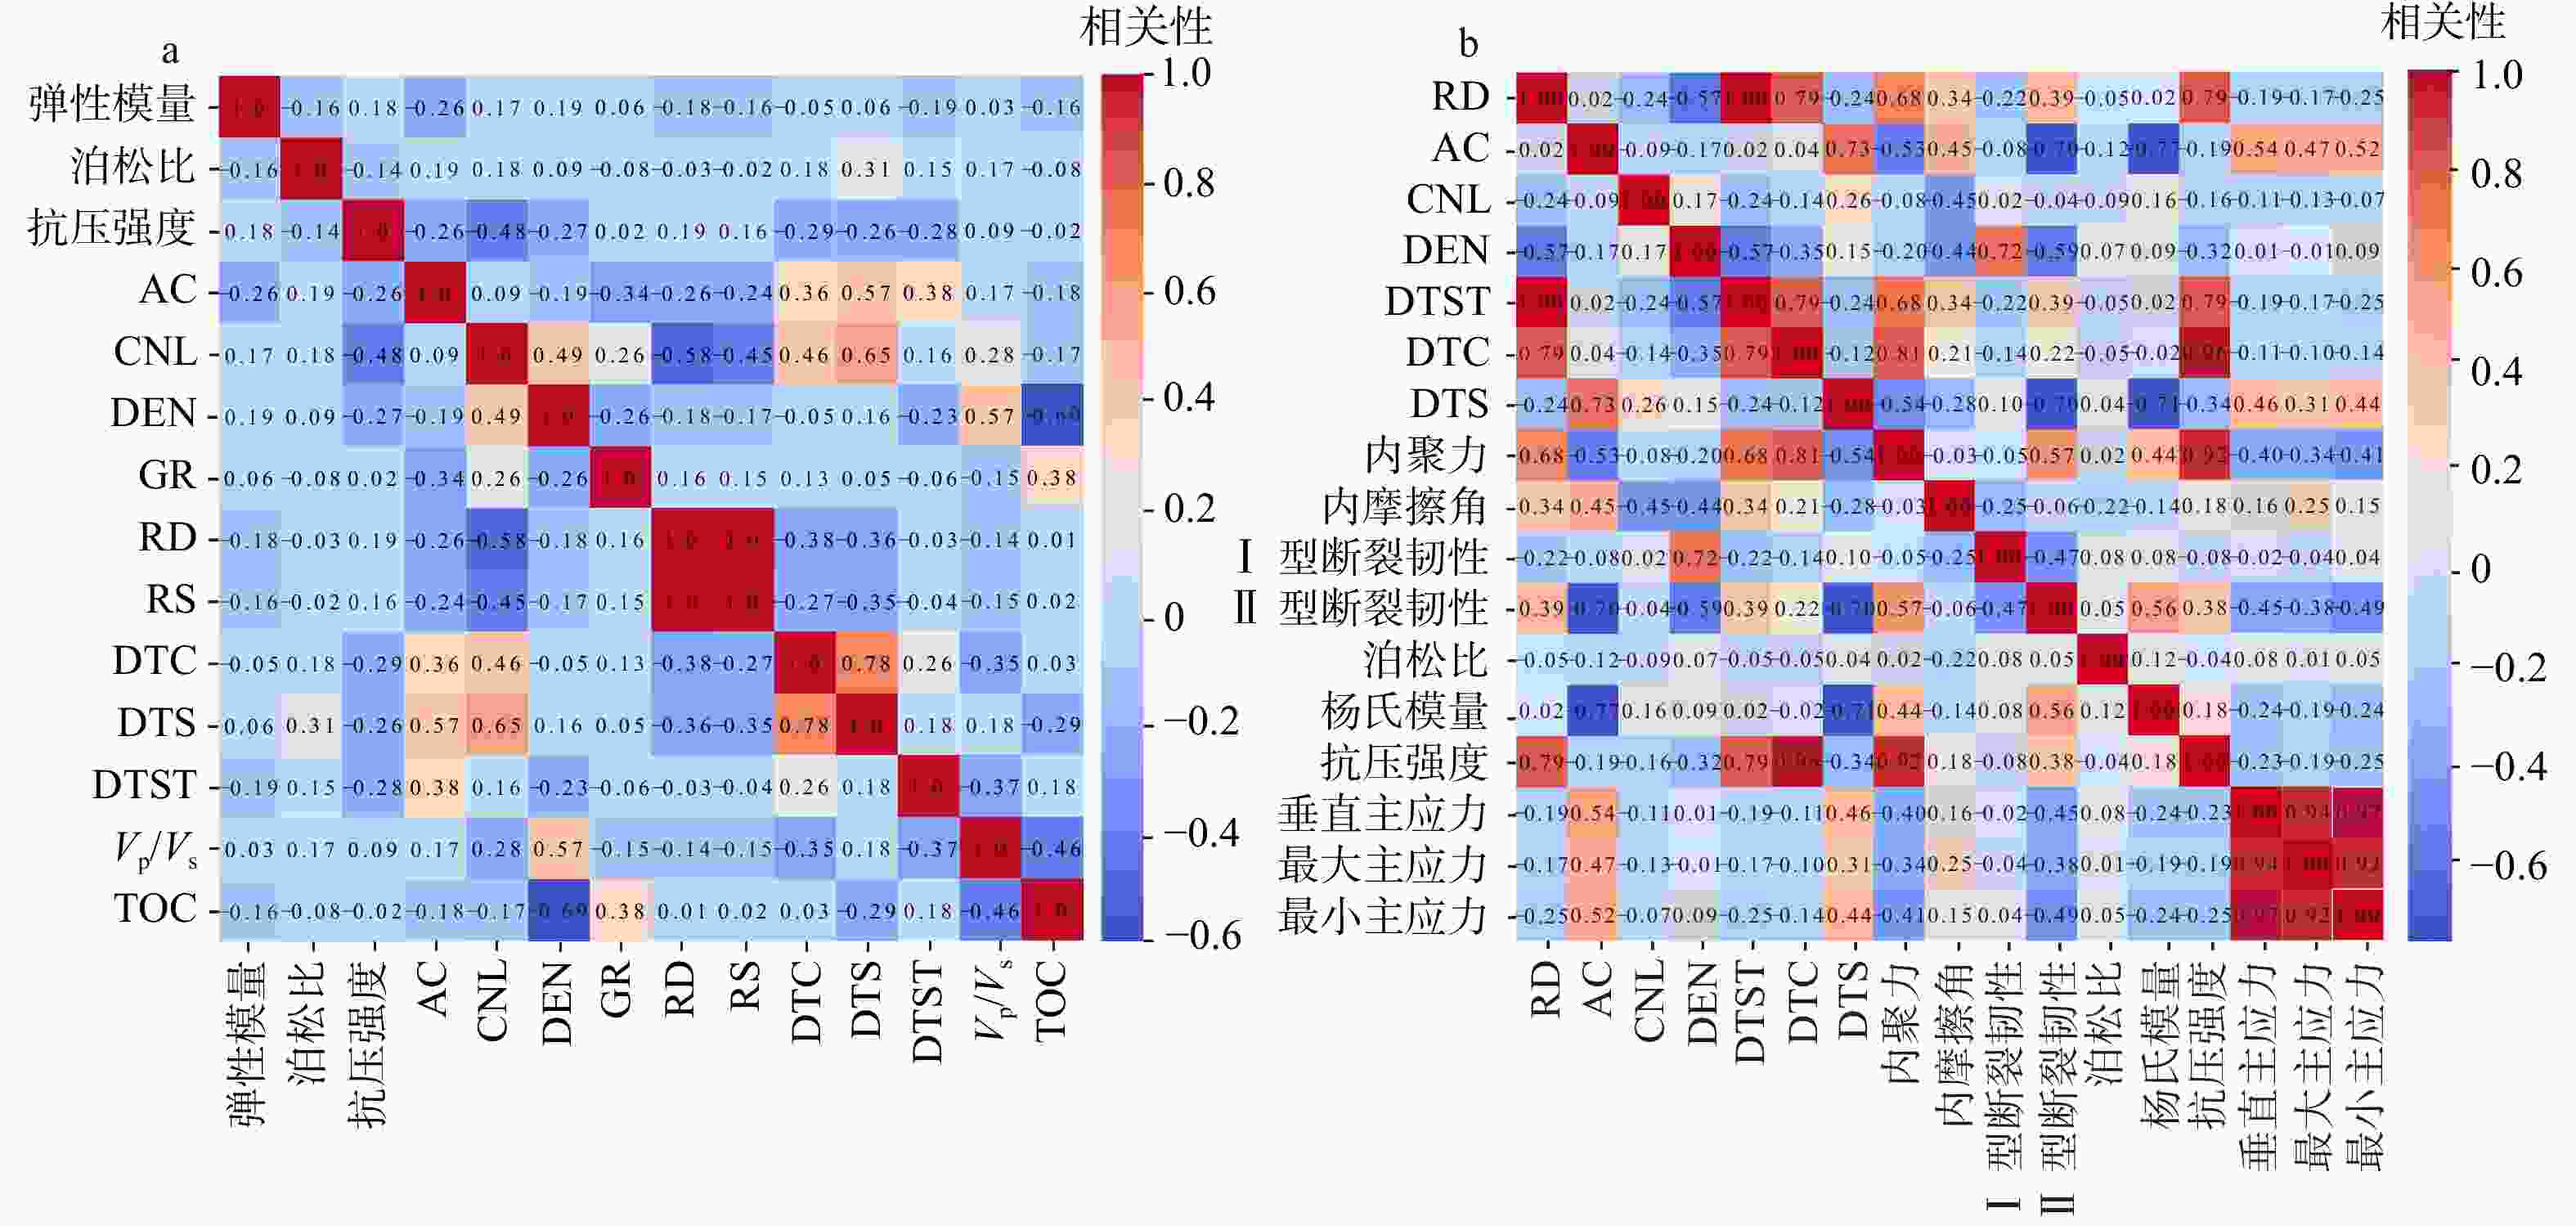
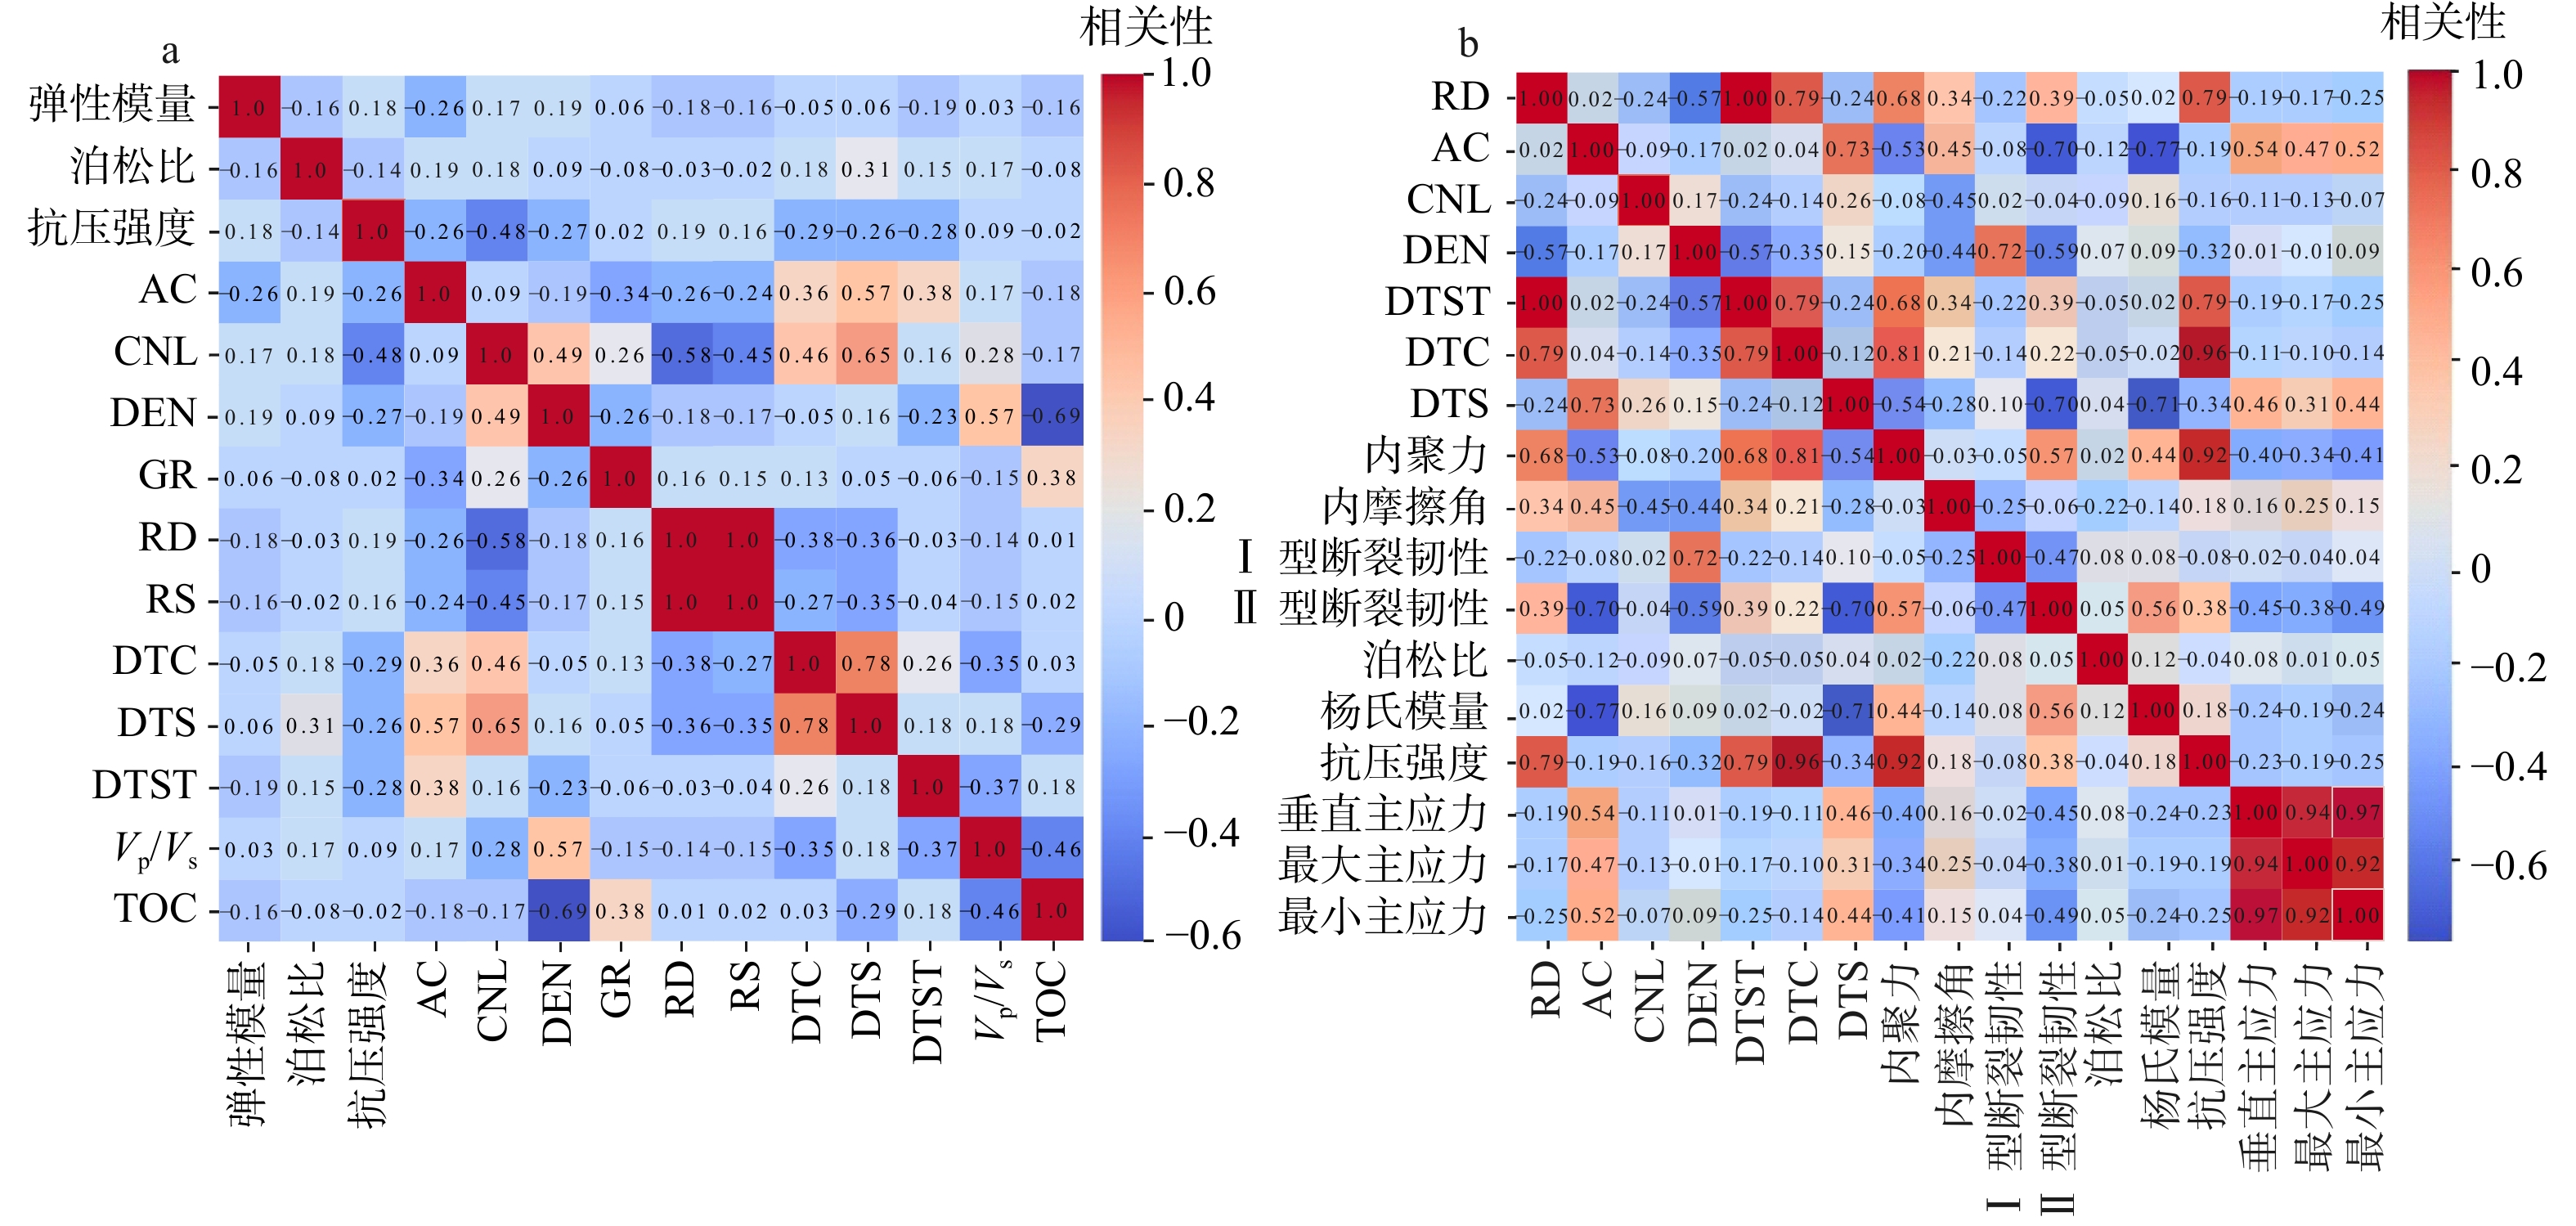
图 7 岩石力学和地应力与各测井参数之间关系的Pearson热力图
AC—声波时差测井;CNL—补偿中子测井;DEN—体积密度测井;GR—自然伽马测井;RD—深电阻率测井;RS—浅电阻率测井;DTS—横波时差;DTC—纵波时差;DTST—斯通利波时差;Vp—纵波速度;Vs—横波速度;TOC—总有机碳含量a—各岩石力学参数与各类测井参数之间的相关性热力图;b—三向地应力与各类参数之间的相关性热力图
Figure 7. Pearson correlation heatmap between rock mechanical, in-situ stress, and well-logging parameters
(a) Correlation heatmap between rock mechanical parameters and various well-logging parameters; (b) Correlation heatmap between the three principal in situ stresses and various parametersAC—acoustic (slowness) log; CNL—compensated neutron log; DEN—bulk density log; GR—gamma ray log; RD—deep resistivity log; RS—shallow resistivity log; DTS—shear wave slowness; DTC—compressional wave slowness; DTST—stoneley wave slowness; Vp—compressional wave velocity; Vs—shear wave velocity; TOC—total organic carbon
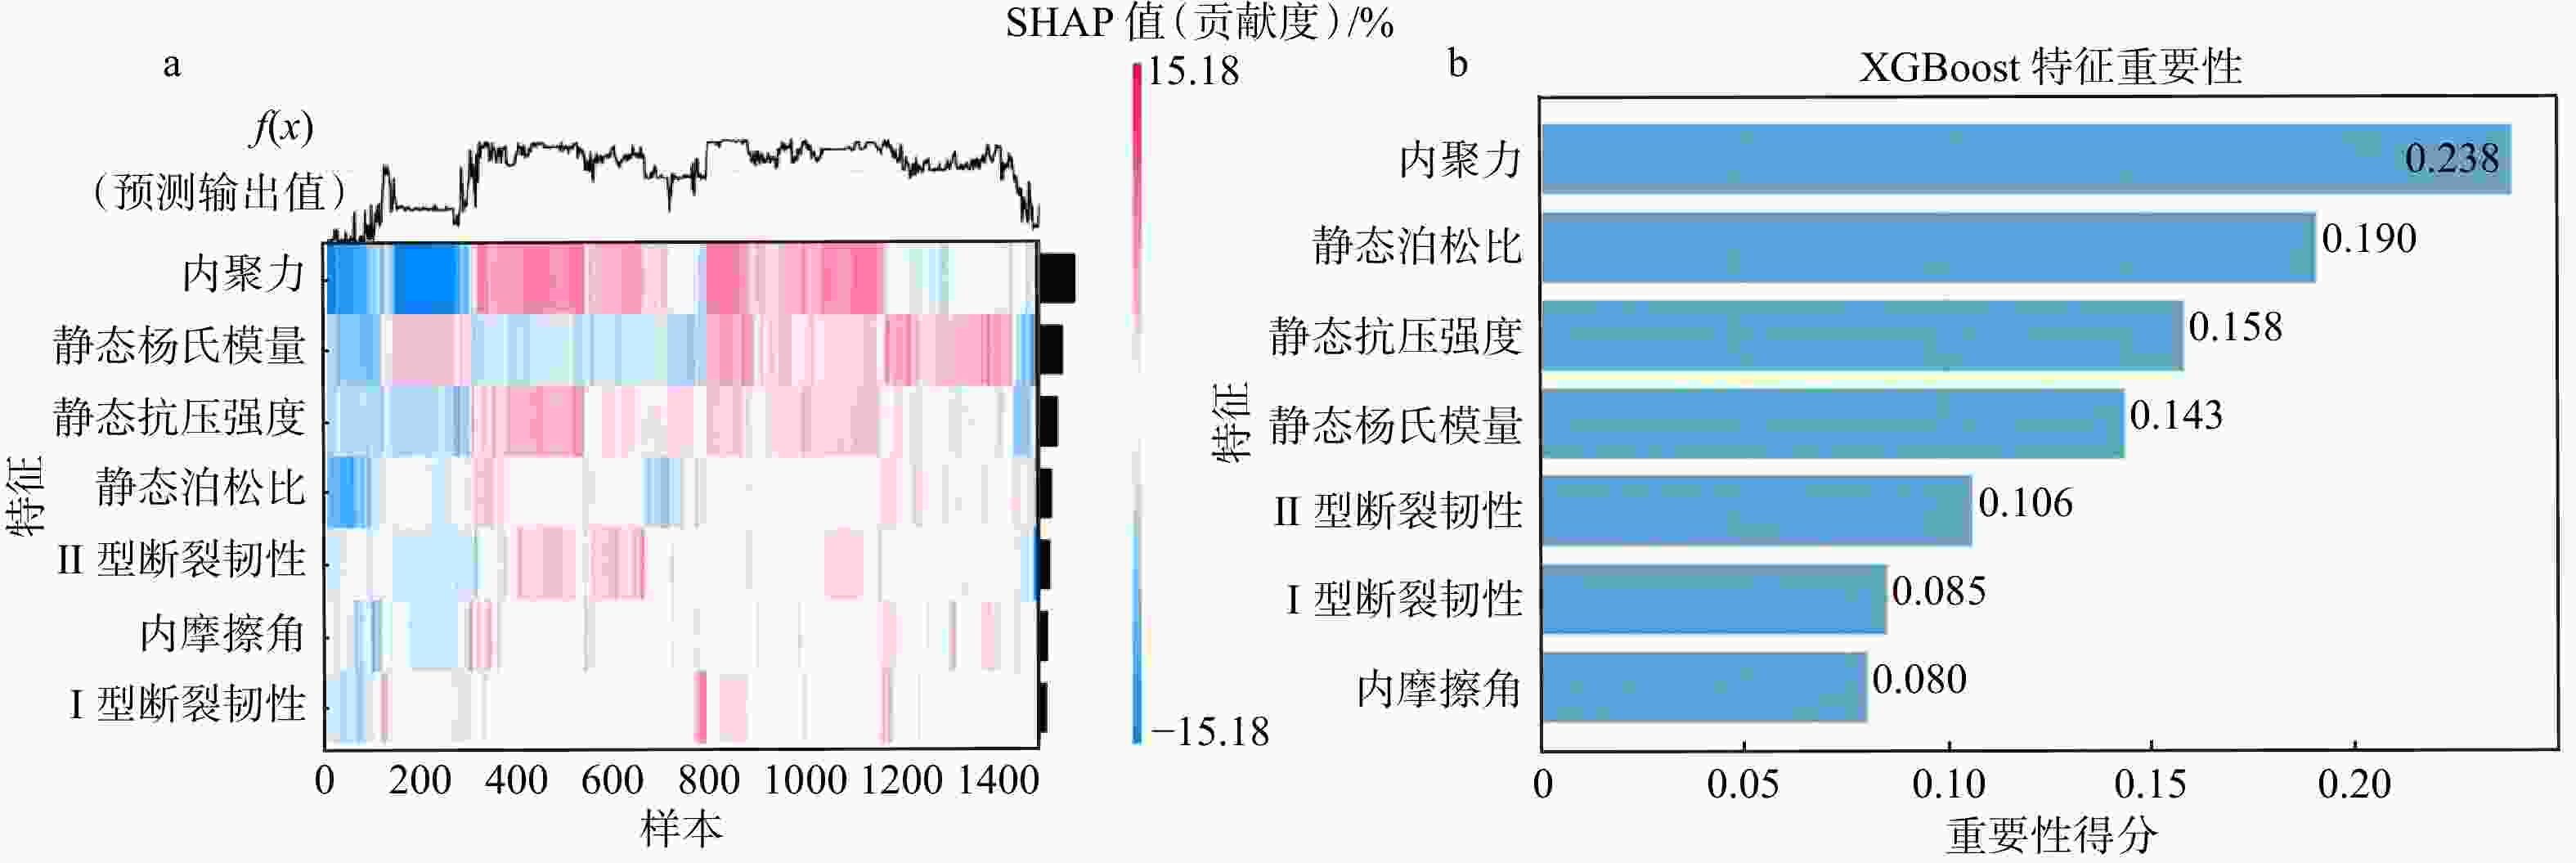
图 8 基于XGBoost模型输出的特征重要性分析图
a—模型输出特征重要性的SHAP热图;b—模型输出特征重要程度统计图
Figure 8. Feature importance analysis diagrams based on XGBoost model output
(a) SHAP heatmap of the importance of model output features; (b) Statistical chart of the importance of model output features
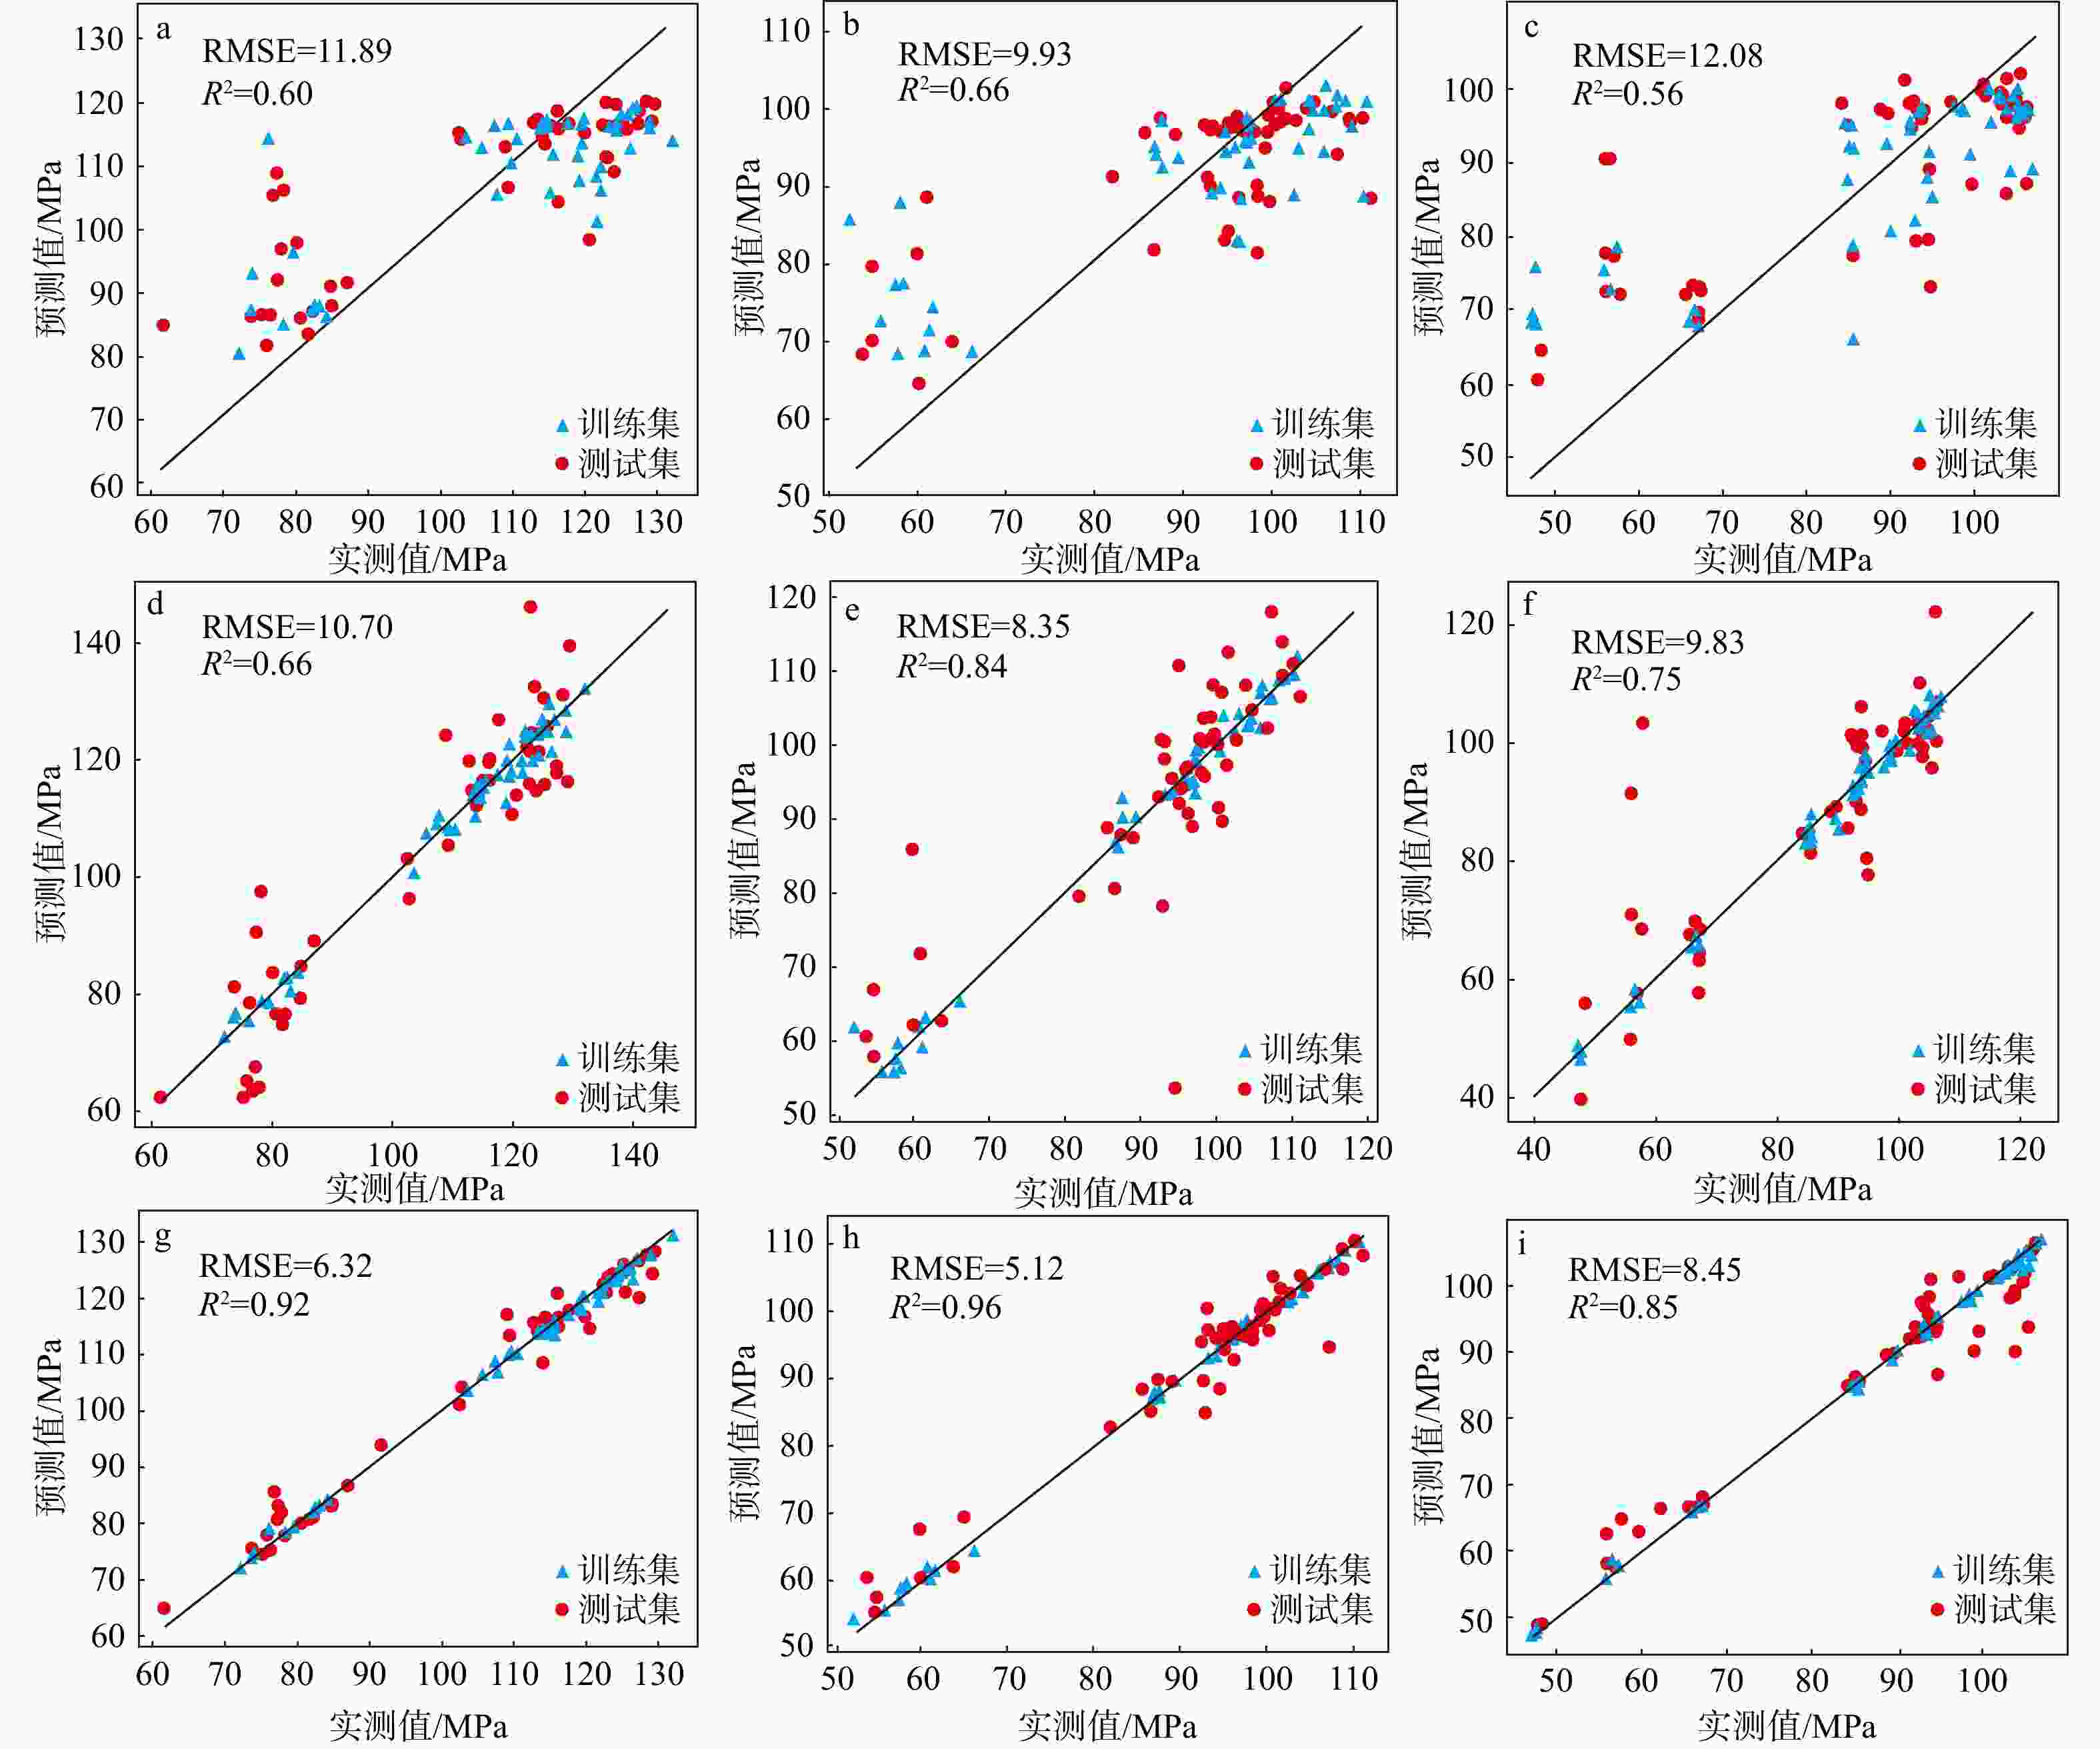
图 9 不同机器学习模型预测三向地应力大小与实测值对比图
a—基于ANN-PSO模型的最大水平地应力大小的预测值与实测值对比图;b—基于ANN-PSO模型的最小水平地应力大小的预测值与实测值对比图;c—基于ANN-PSO模型的垂向地应力大小的预测值与实测值对比图;d—基于LightGBM模型的最大水平地应力大小的预测值与实测值对比图;e—基于LightGBM模型的最小水平地应力大小的预测值与实测值对比图;f—基于LightGBM模型的垂向地应力大小的预测值与实测值对比图;g—基于XGBoost模型的最大水平地应力大小的预测值与实测值对比图;h—基于XGBoost模型的最小水平地应力大小的预测值与实测值对比图;i—基于XGBoost模型的垂向地应力大小的预测值与实测值对比图
Figure 9. Comparison of predicted and measured triaxial in situ stress magnitudes using different machine learning models
(a) Comparison between predicted and measured values of maximum horizontal in situ stress based on the ANN-PSO model; (b) Comparison between predicted and measured values of minimum horizontal in situ stress based on the ANN-PSO model; (c) Comparison between predicted and measured values of vertical in situ stress based on the ANN-PSO model; (d) Comparison between predicted and measured values of maximum horizontal in situ stress based on the LightGBM model; (e) Comparison between predicted and measured values of minimum horizontal in situ stress based on the LightGBM model; (f) Comparison between predicted and measured values of vertical in situ stress based on the LightGBM model; (g) Comparison between predicted and measured values of maximum horizontal in situ stress based on the XGBoost model; (h) Comparison between predicted and measured values of minimum horizontal in situ stress based on the XGBoost model; (i) Comparison between predicted and measured values of vertical in situ stress based on the XGBoost model
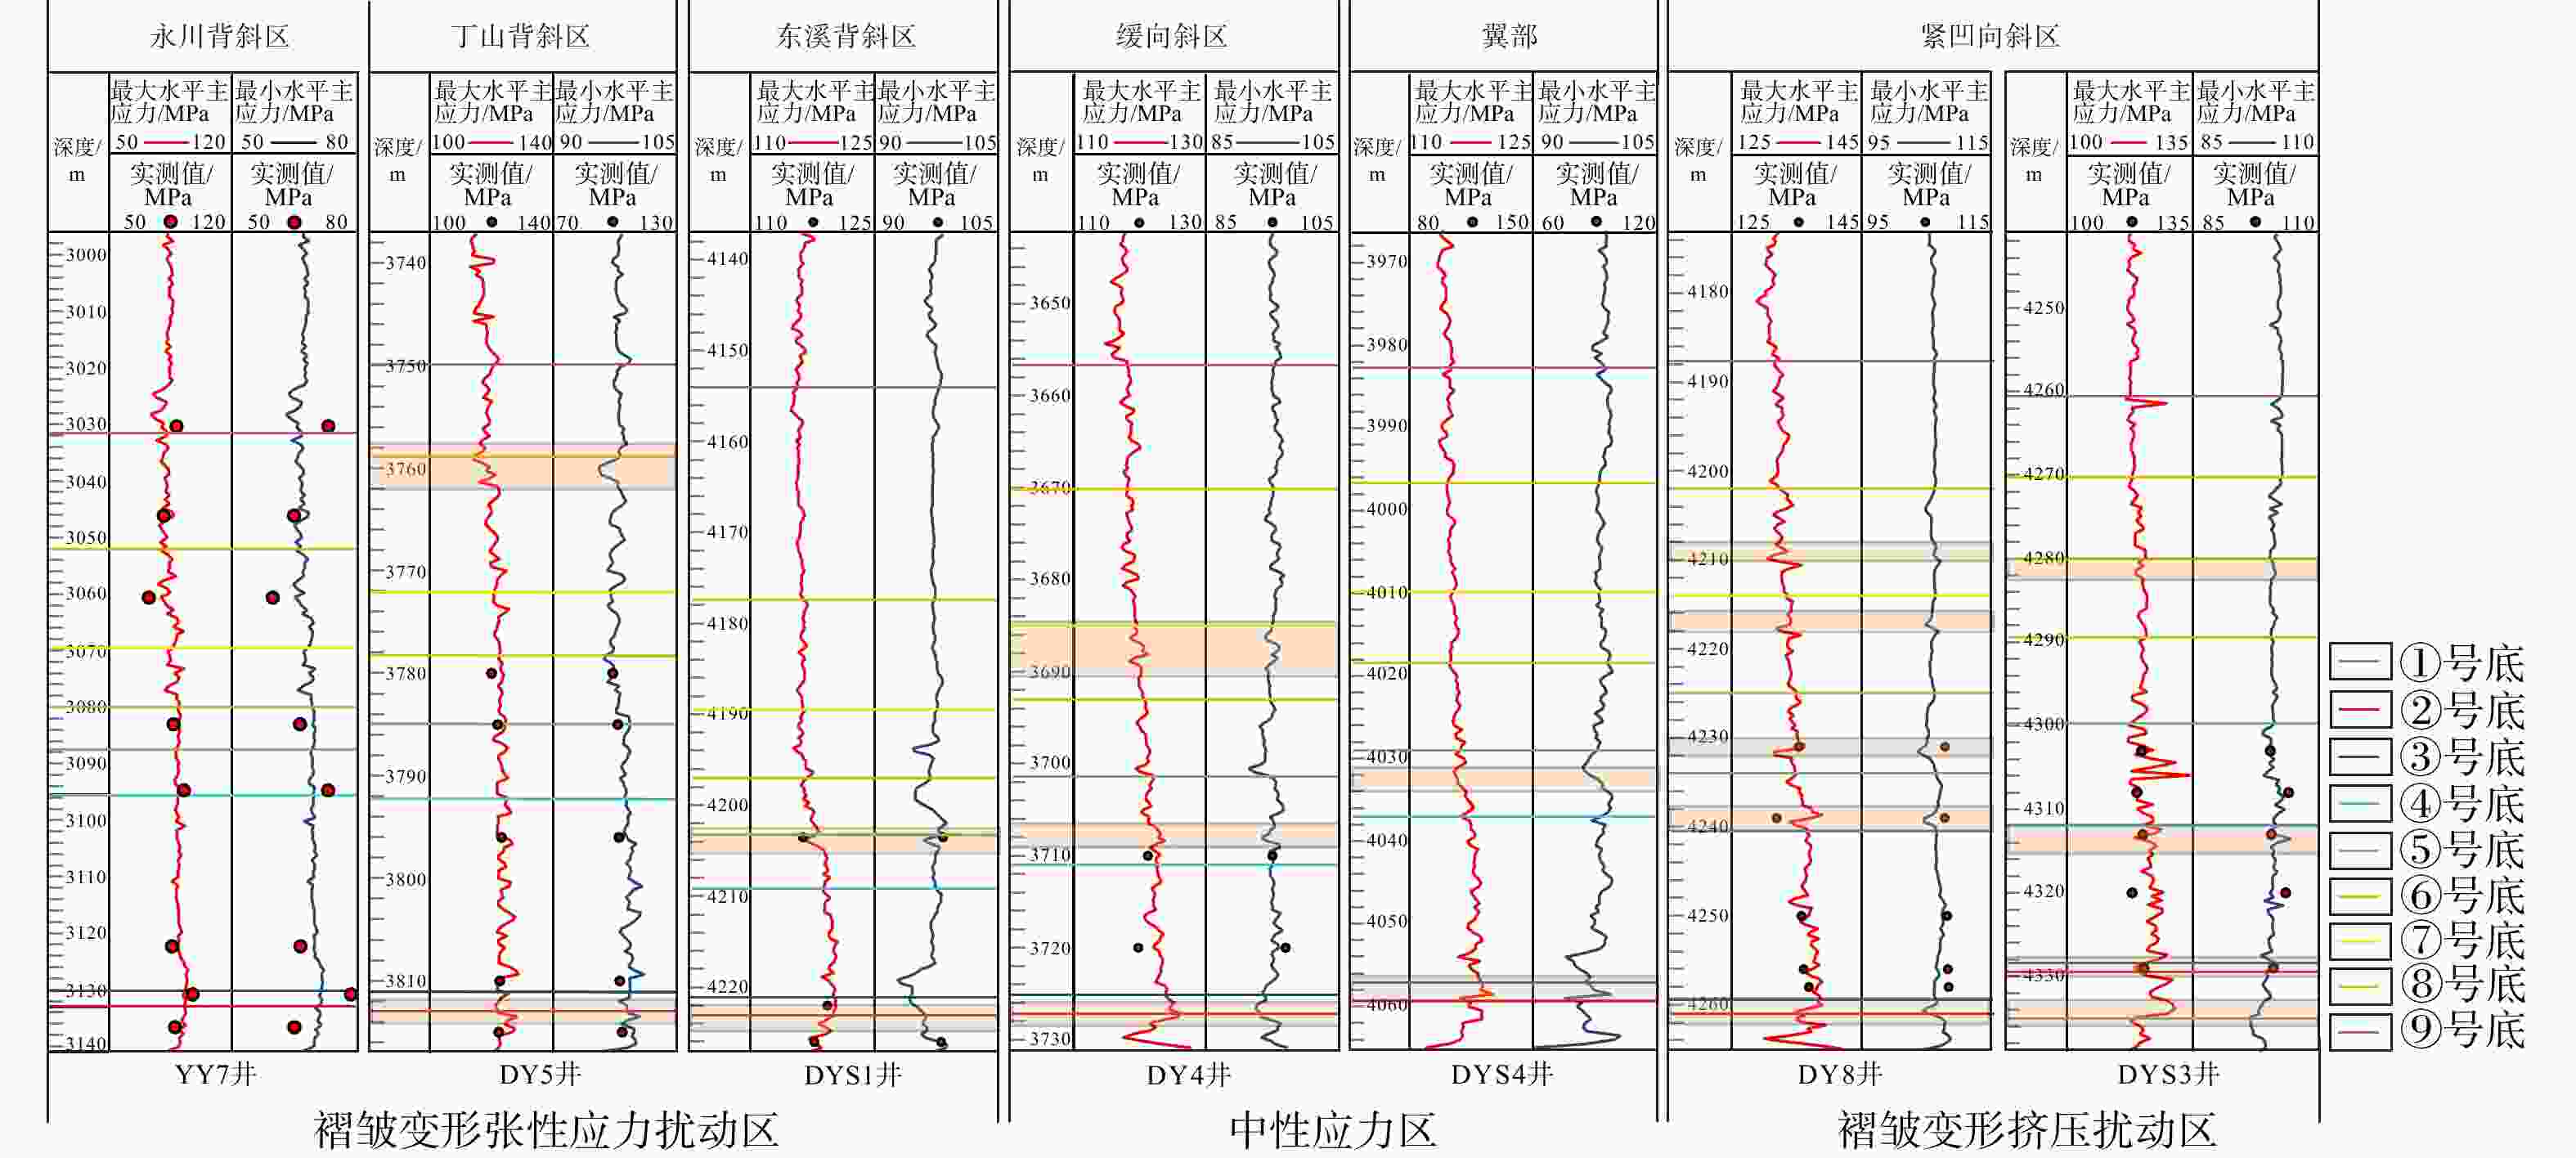
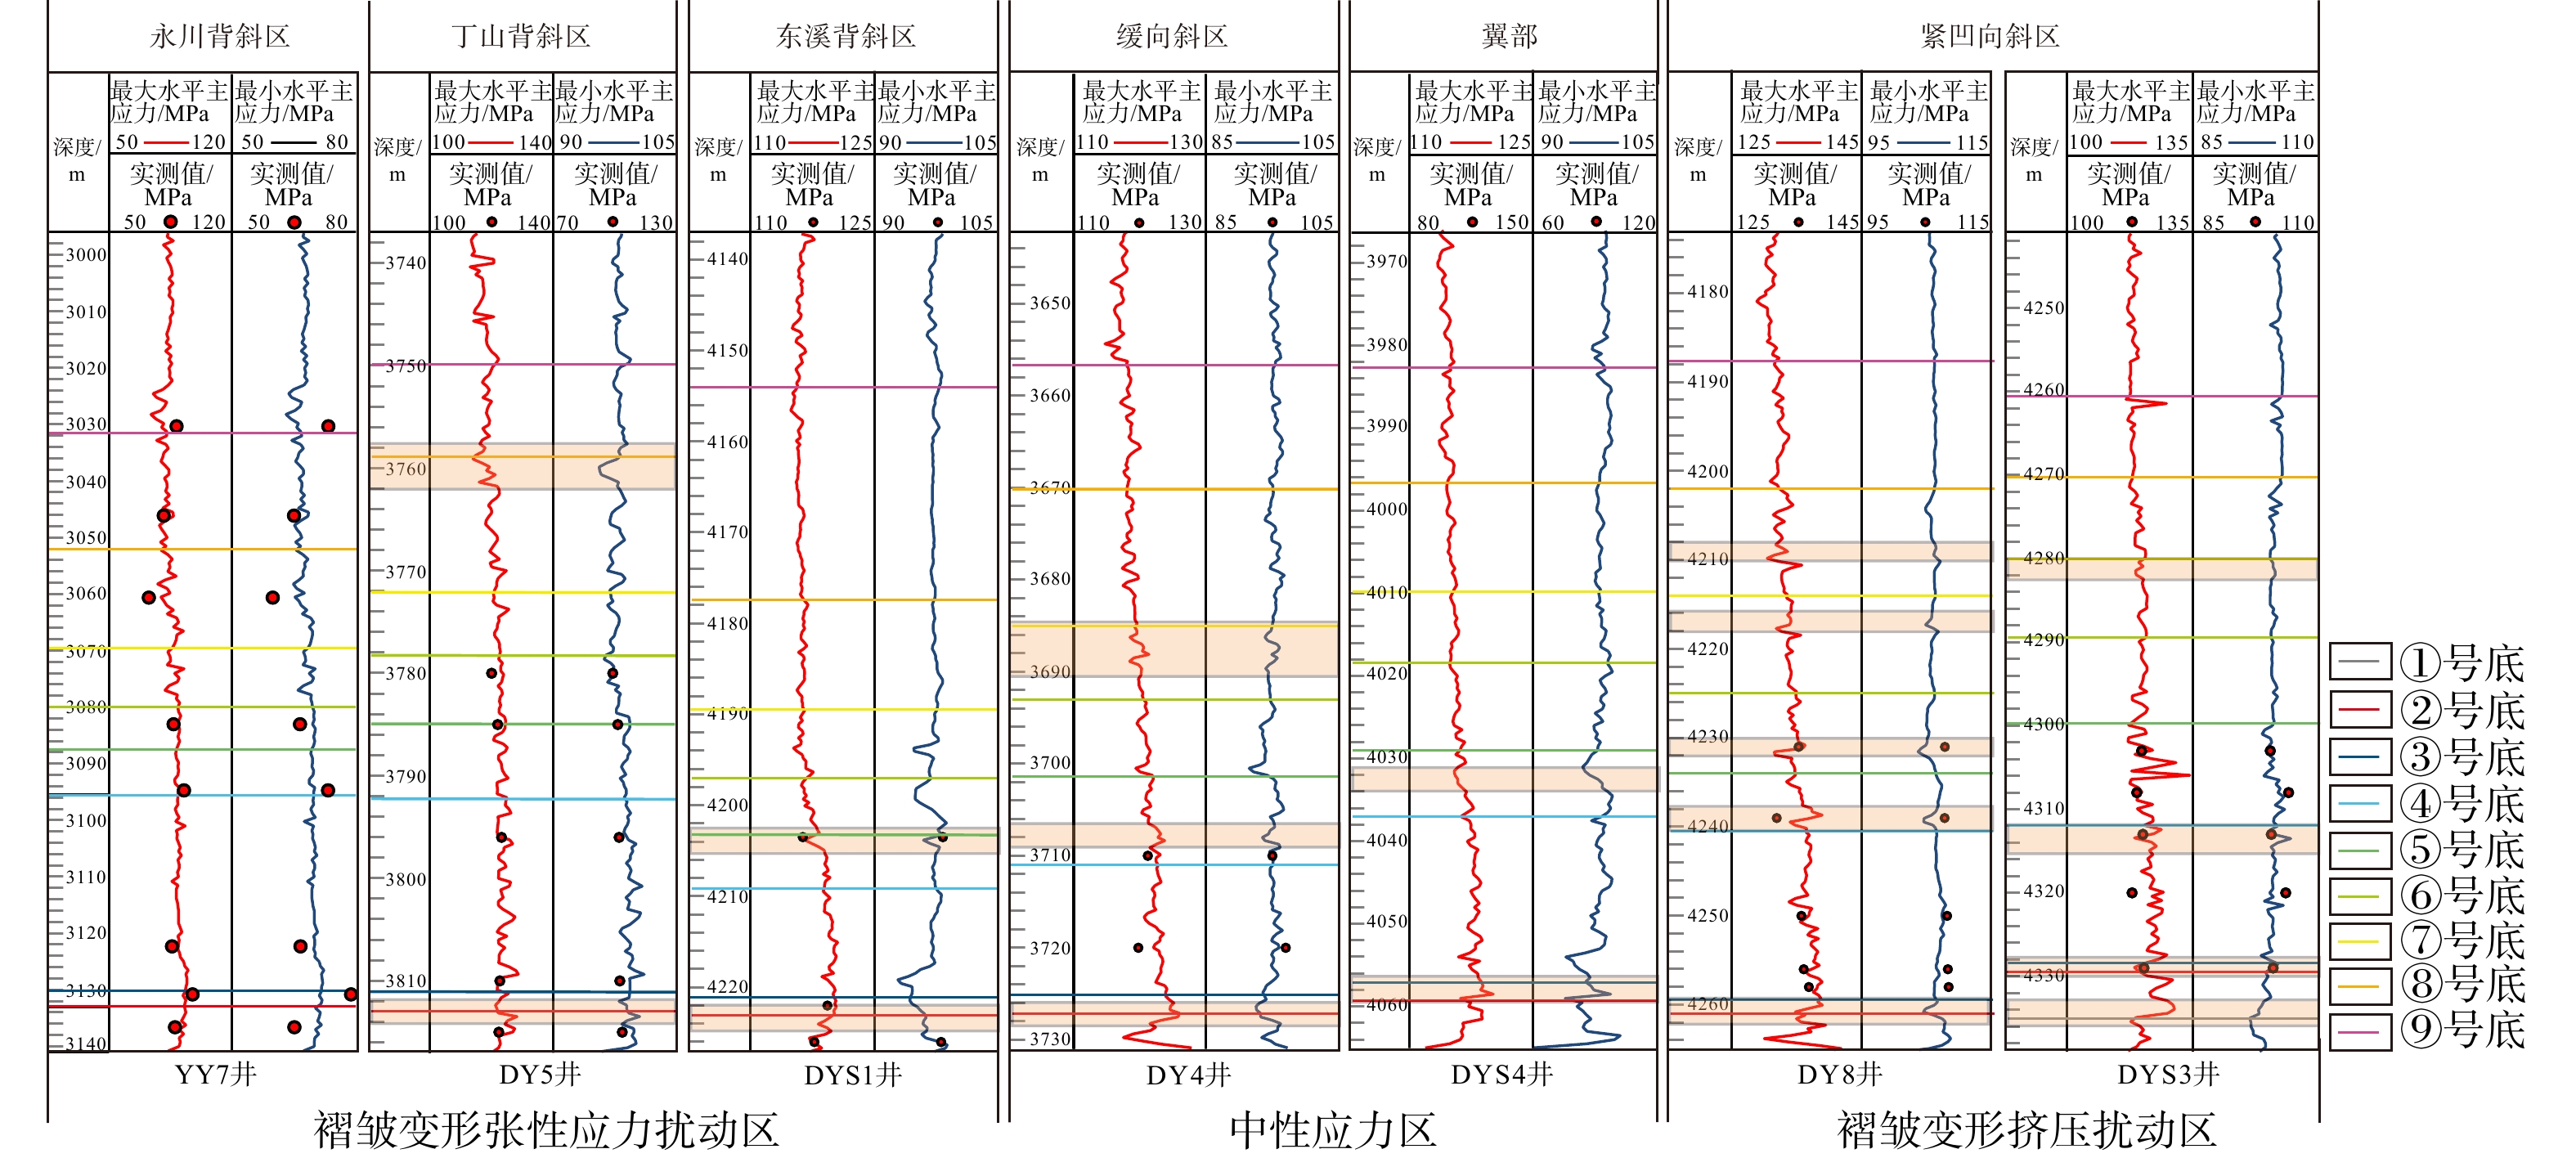
图 10 川南不同构造区地应力智能预测外推结果连井剖面图
Figure 10. Well cross-section of intelligent in-situ stress predictions across different tectonic units in southern Sichuan Basin
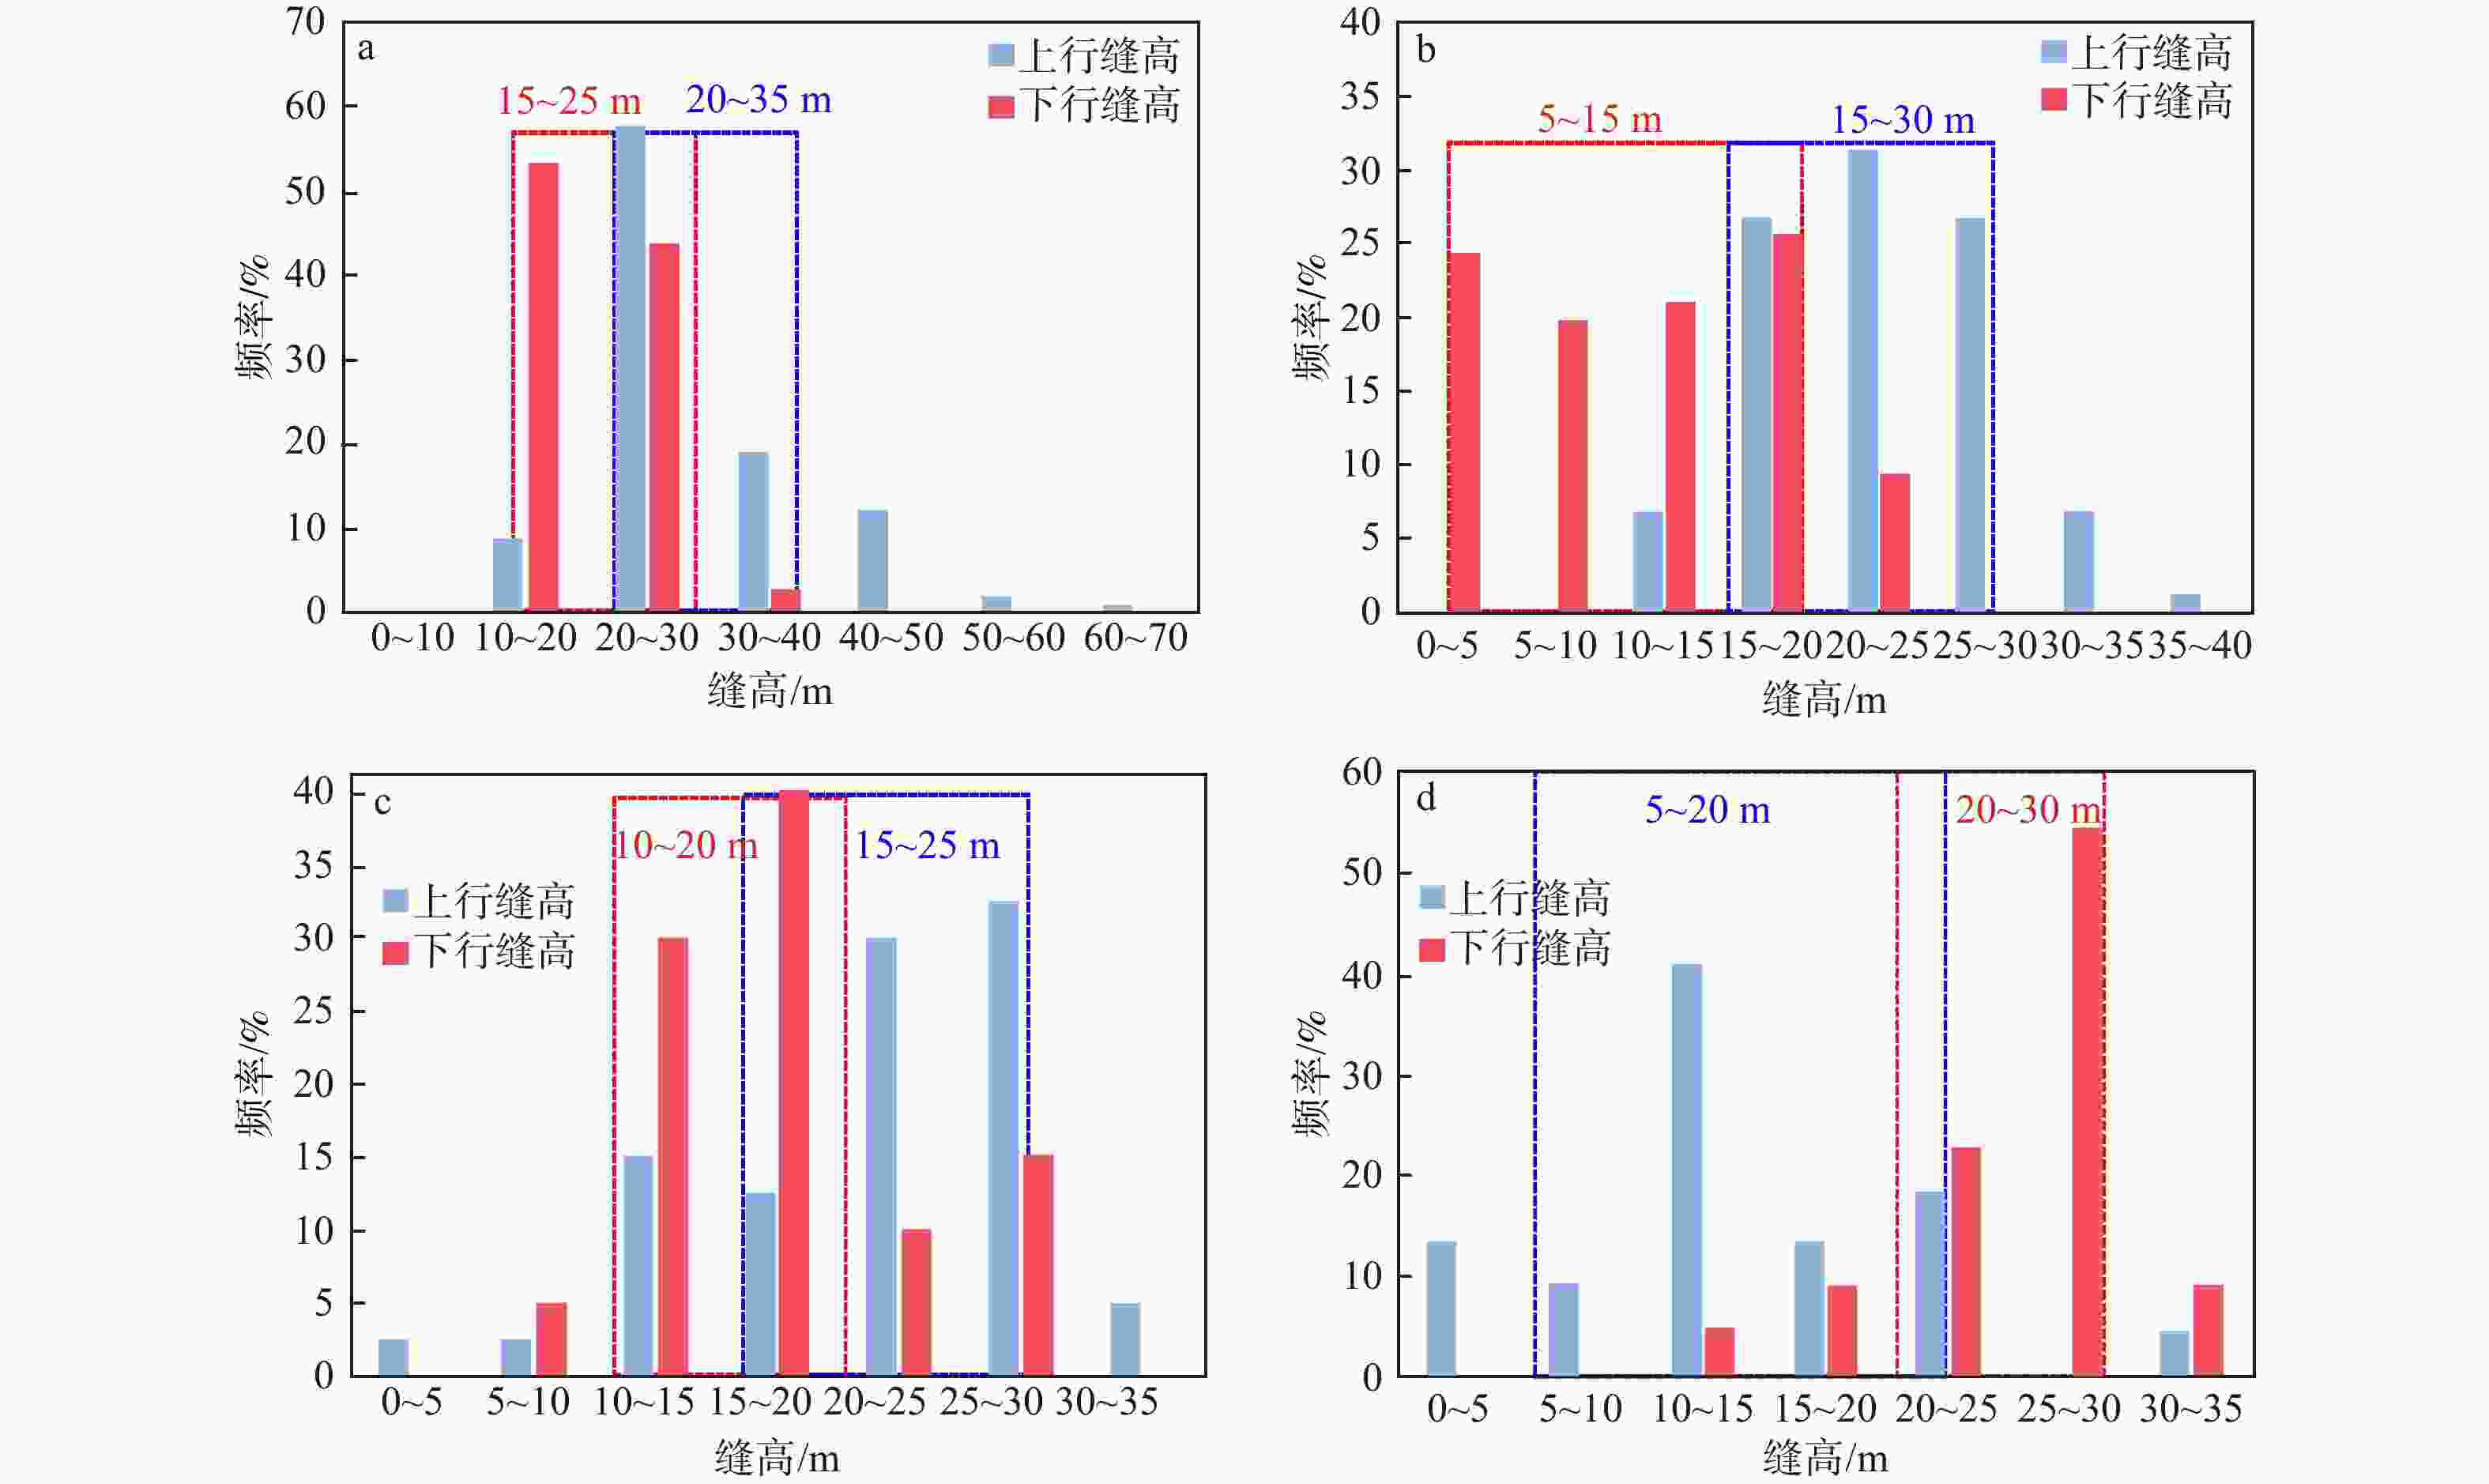
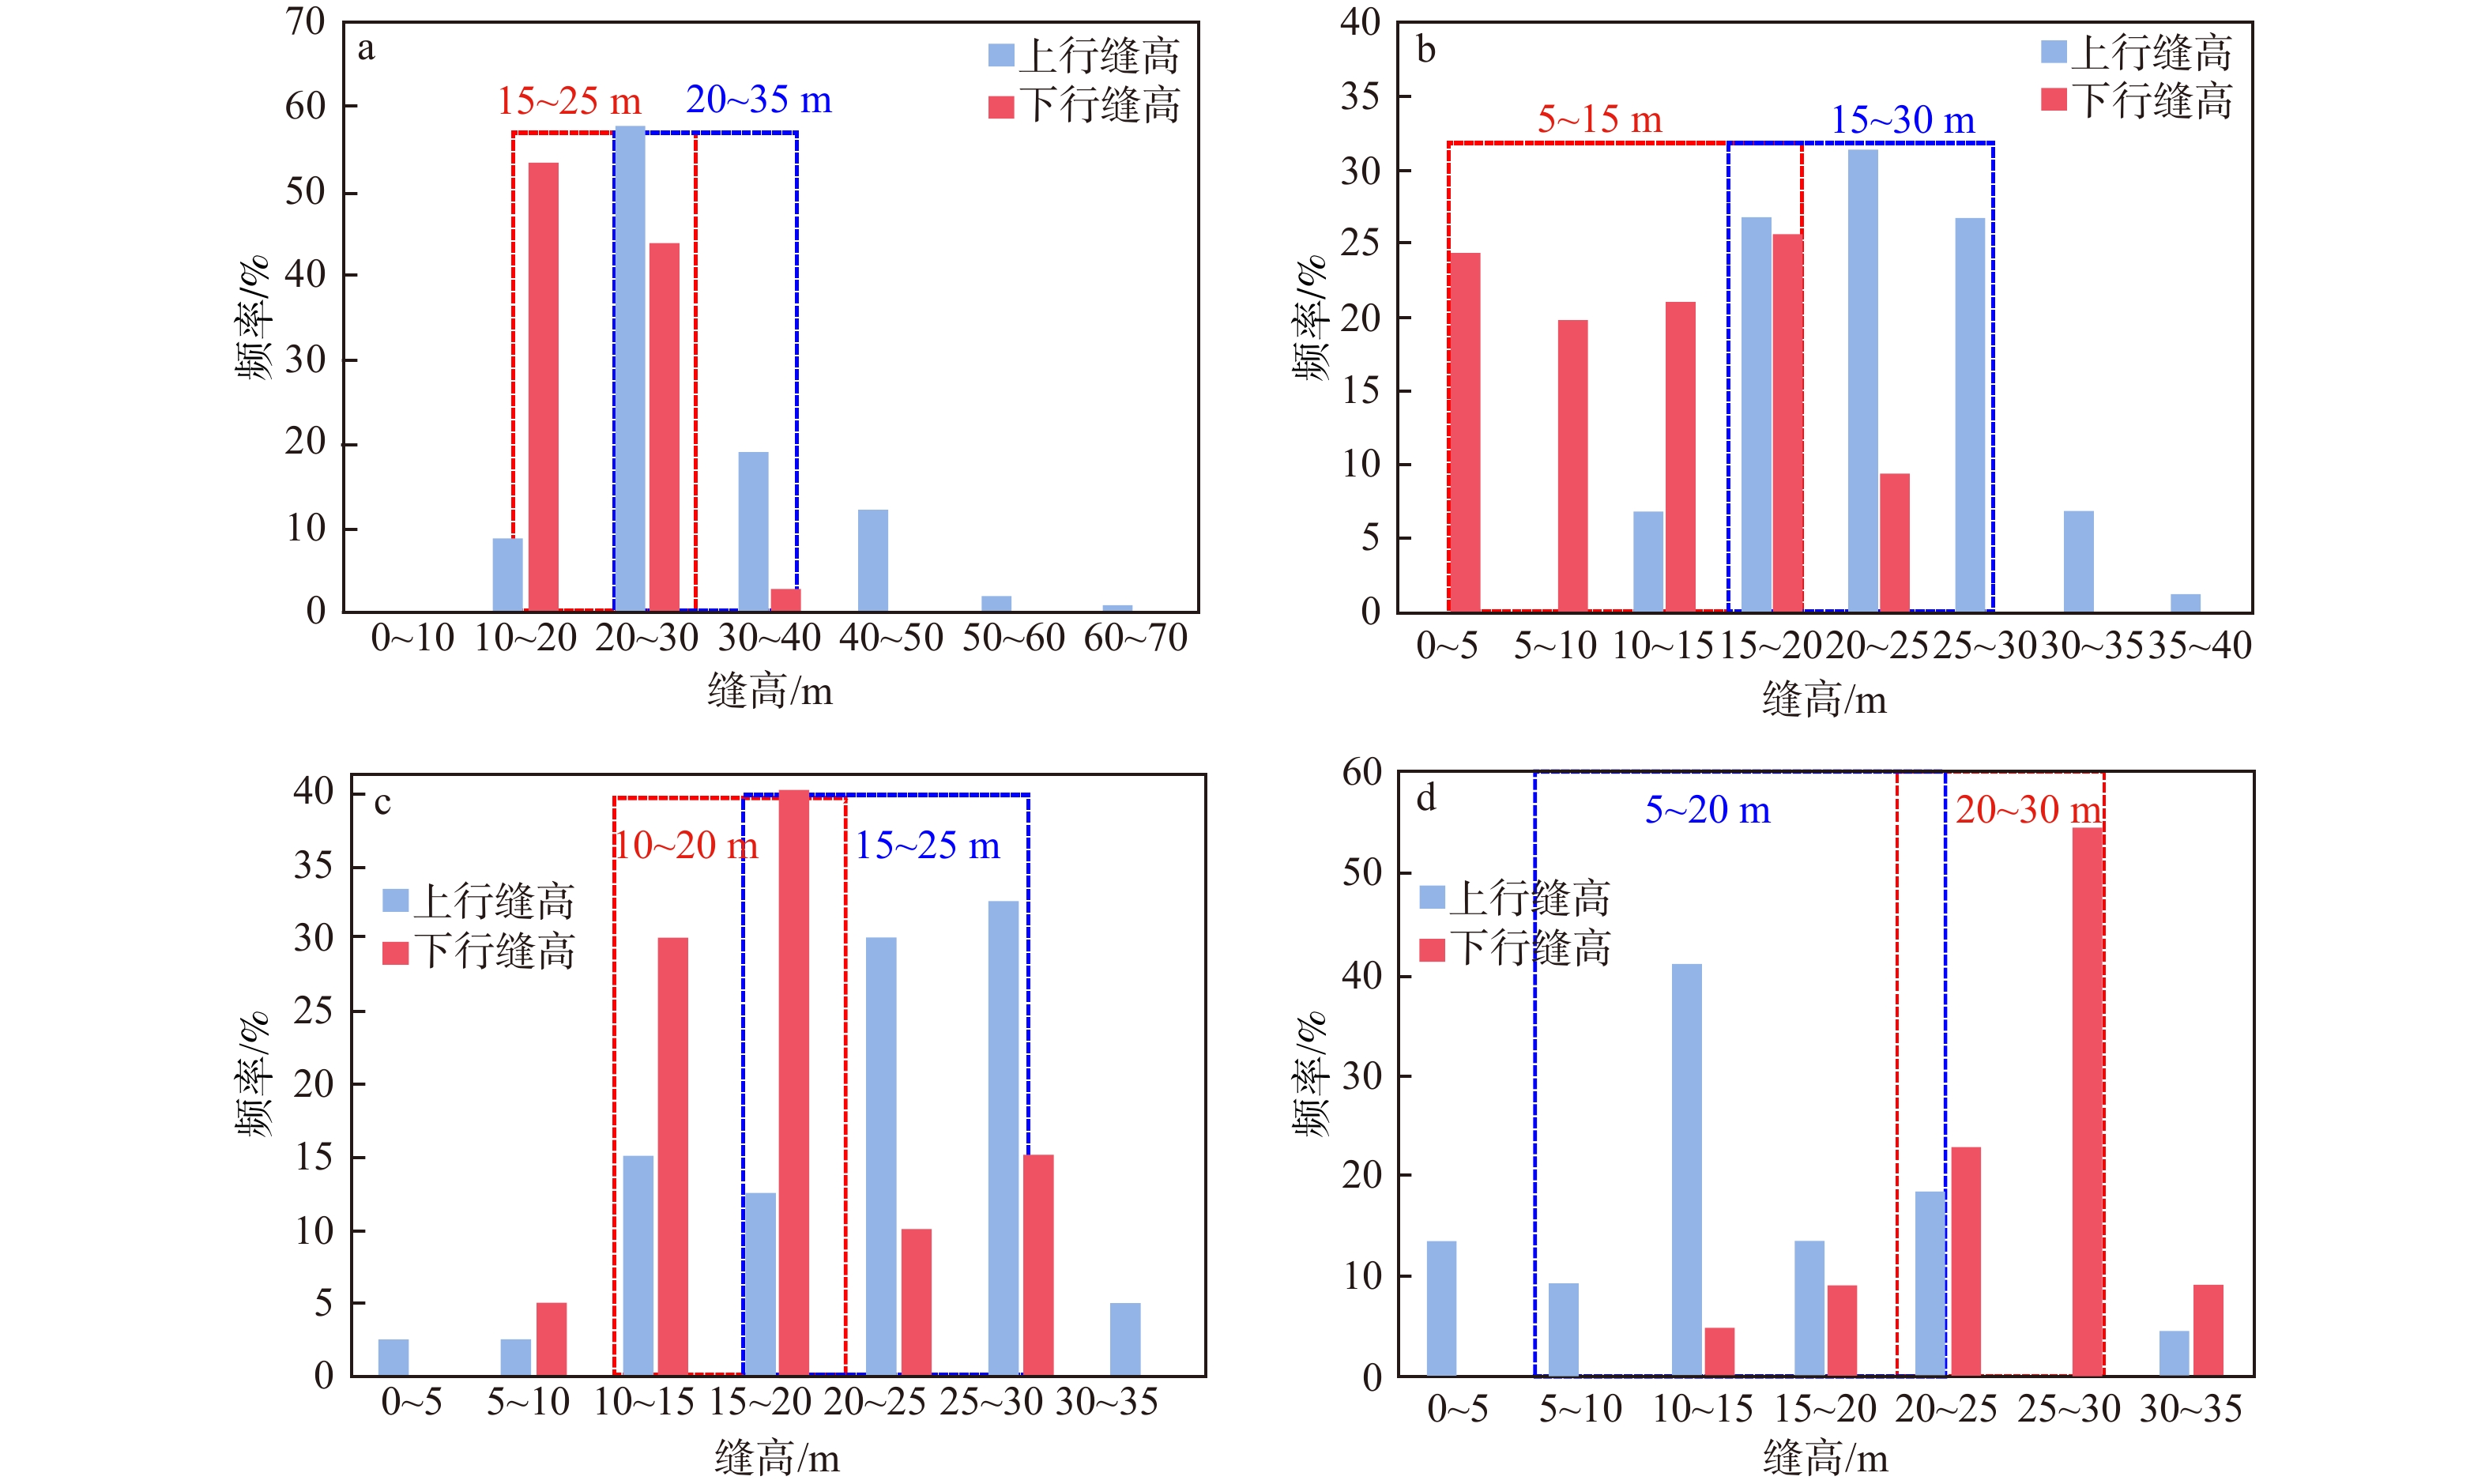
图 11 五峰组—龙一段页岩储层不同穿行小层内水力压裂缝上行和下行缝高统计图
a—丁山−东溪地区水平井穿行③号层压裂上、下行缝高占比图;b—丁山−东溪地区水平井穿行②号层压裂上、下行缝高占比图;c—焦石坝地区水平井穿行⑧号层压裂上、下行缝高占比图;d—焦石坝地区水平井穿行⑦号层压裂上、下行缝高占比图
Figure 11. Statistical distribution of upward- and downward-propagating hydraulic fractures within individual beds of the shale reservoir, Wufeng Formation to the Long 1 Member
(a) Proportion of upward vs. downward fracture height in horizontal wells through Bed 3, Dingshan–Dongxi area; (b) Proportion of upward vs. downward fracture height in horizontal wells through Bed 2, Dingshan–Dongxi area; (c) Proportion of upward vs. downward fracture height in horizontal wells through Bed 8, Jiaoshiba area; (d) Proportion of upward vs. downward fracture height in horizontal wells through Bed 7, Jiaoshiba area
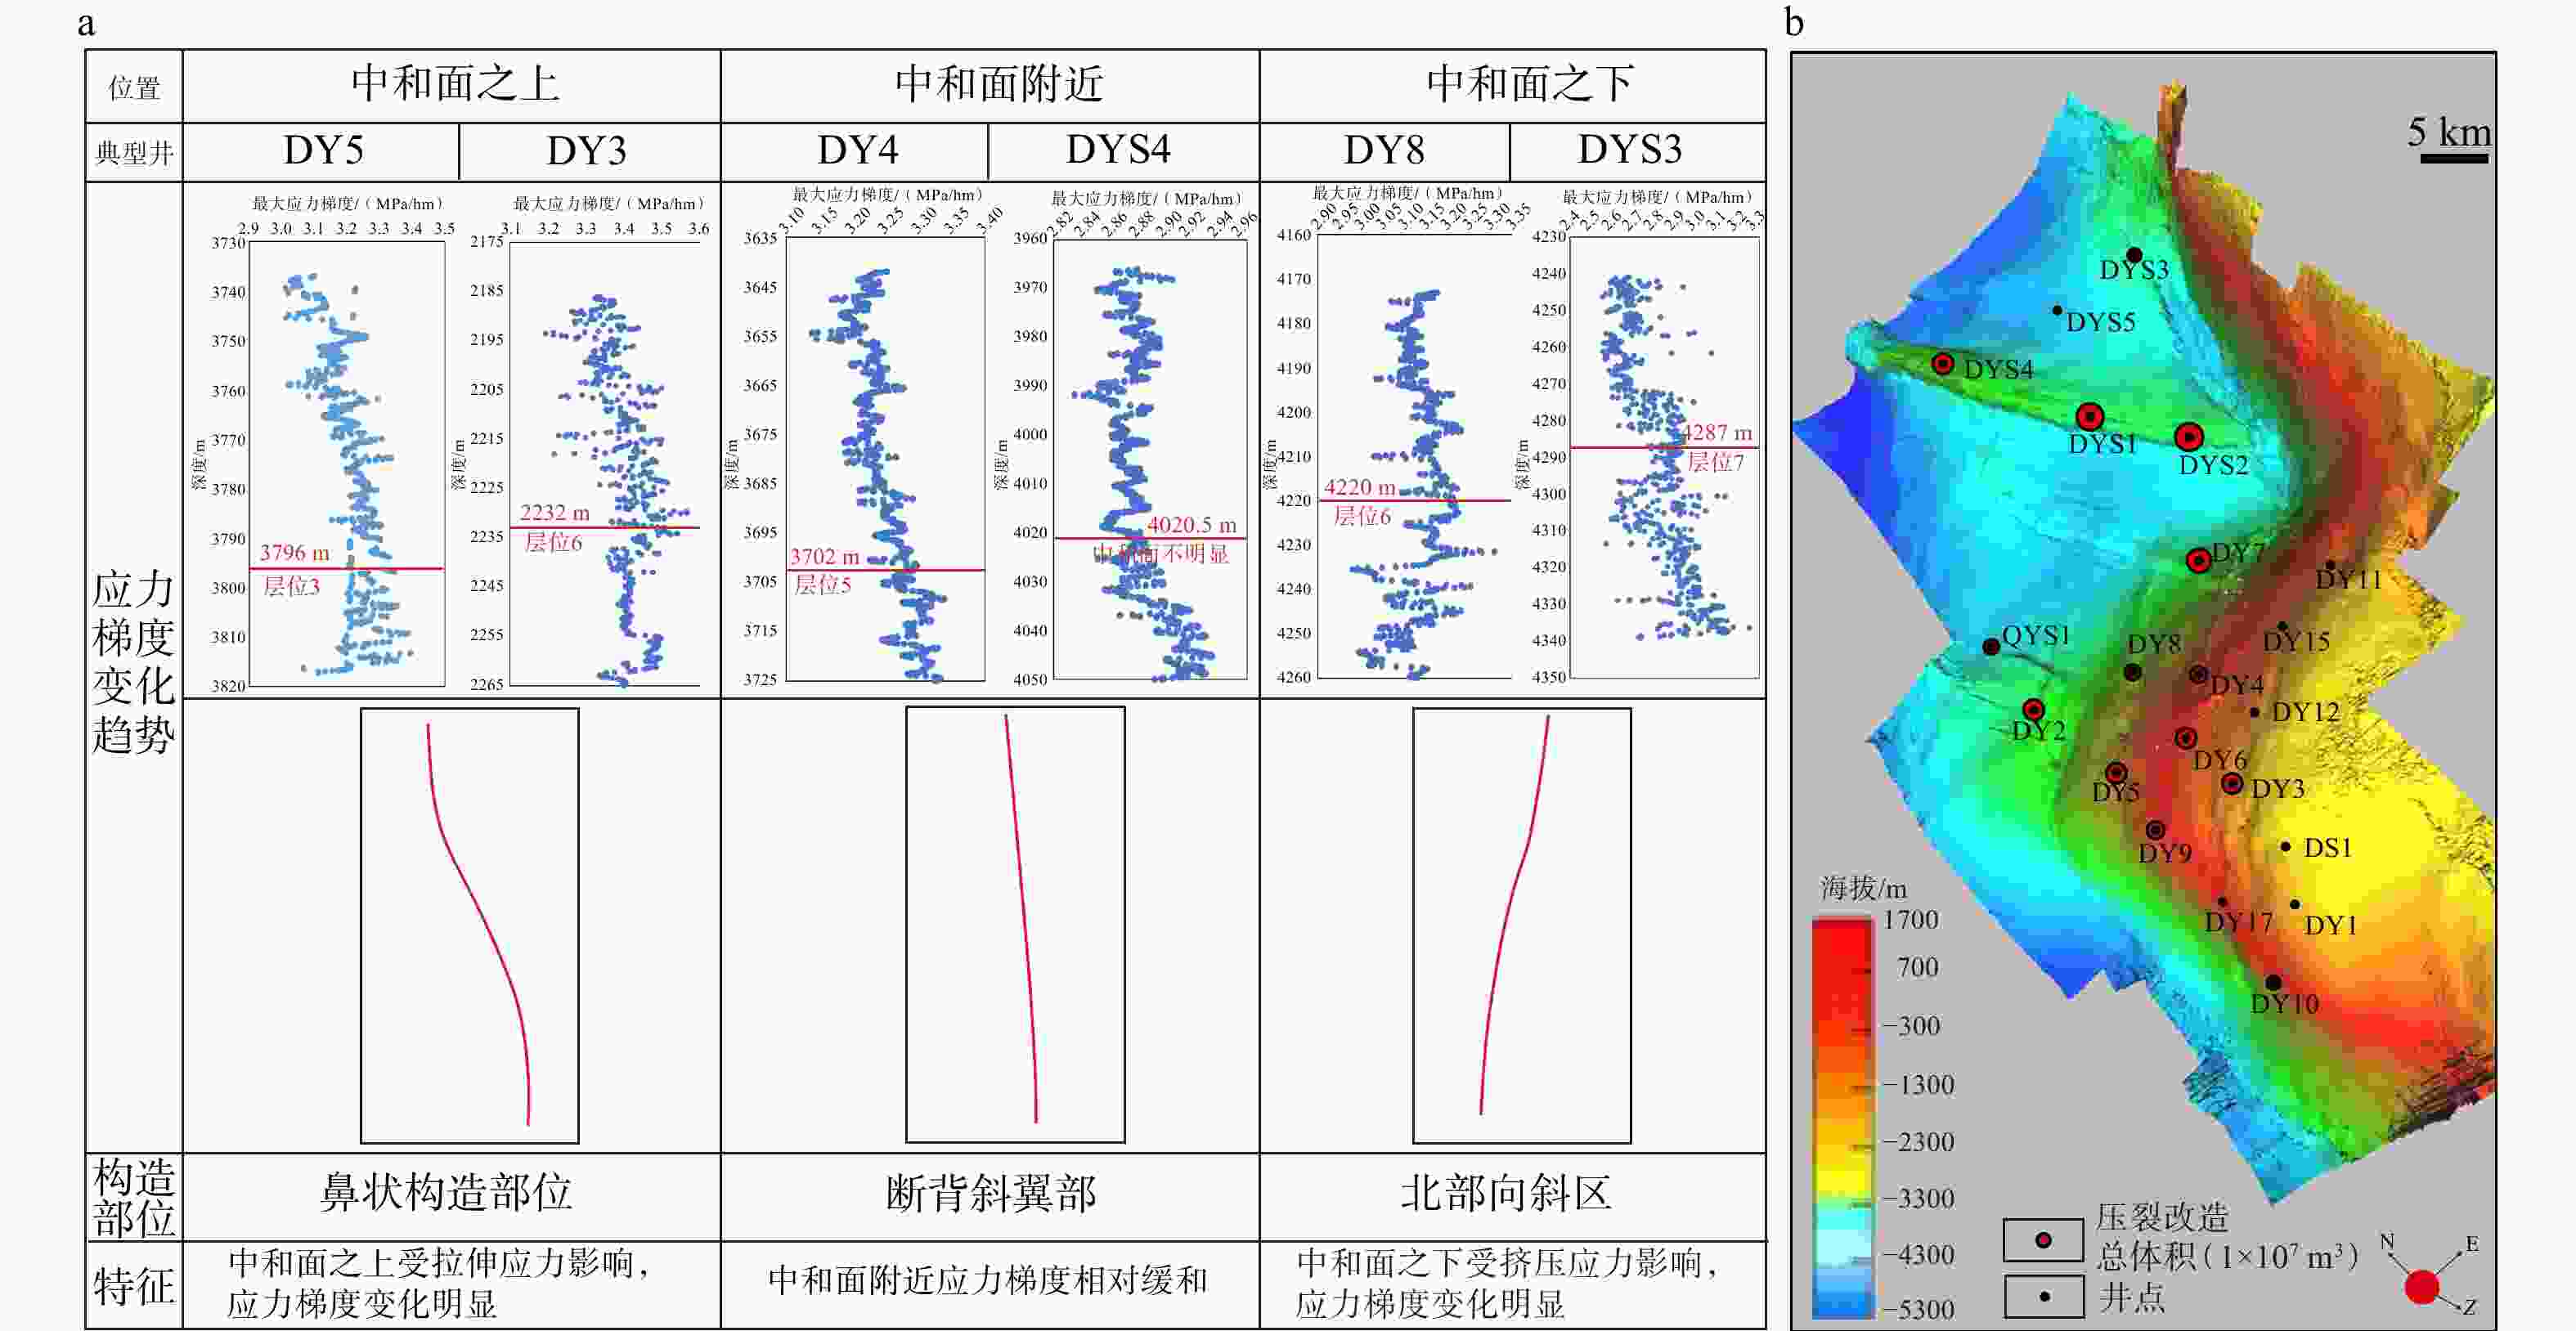
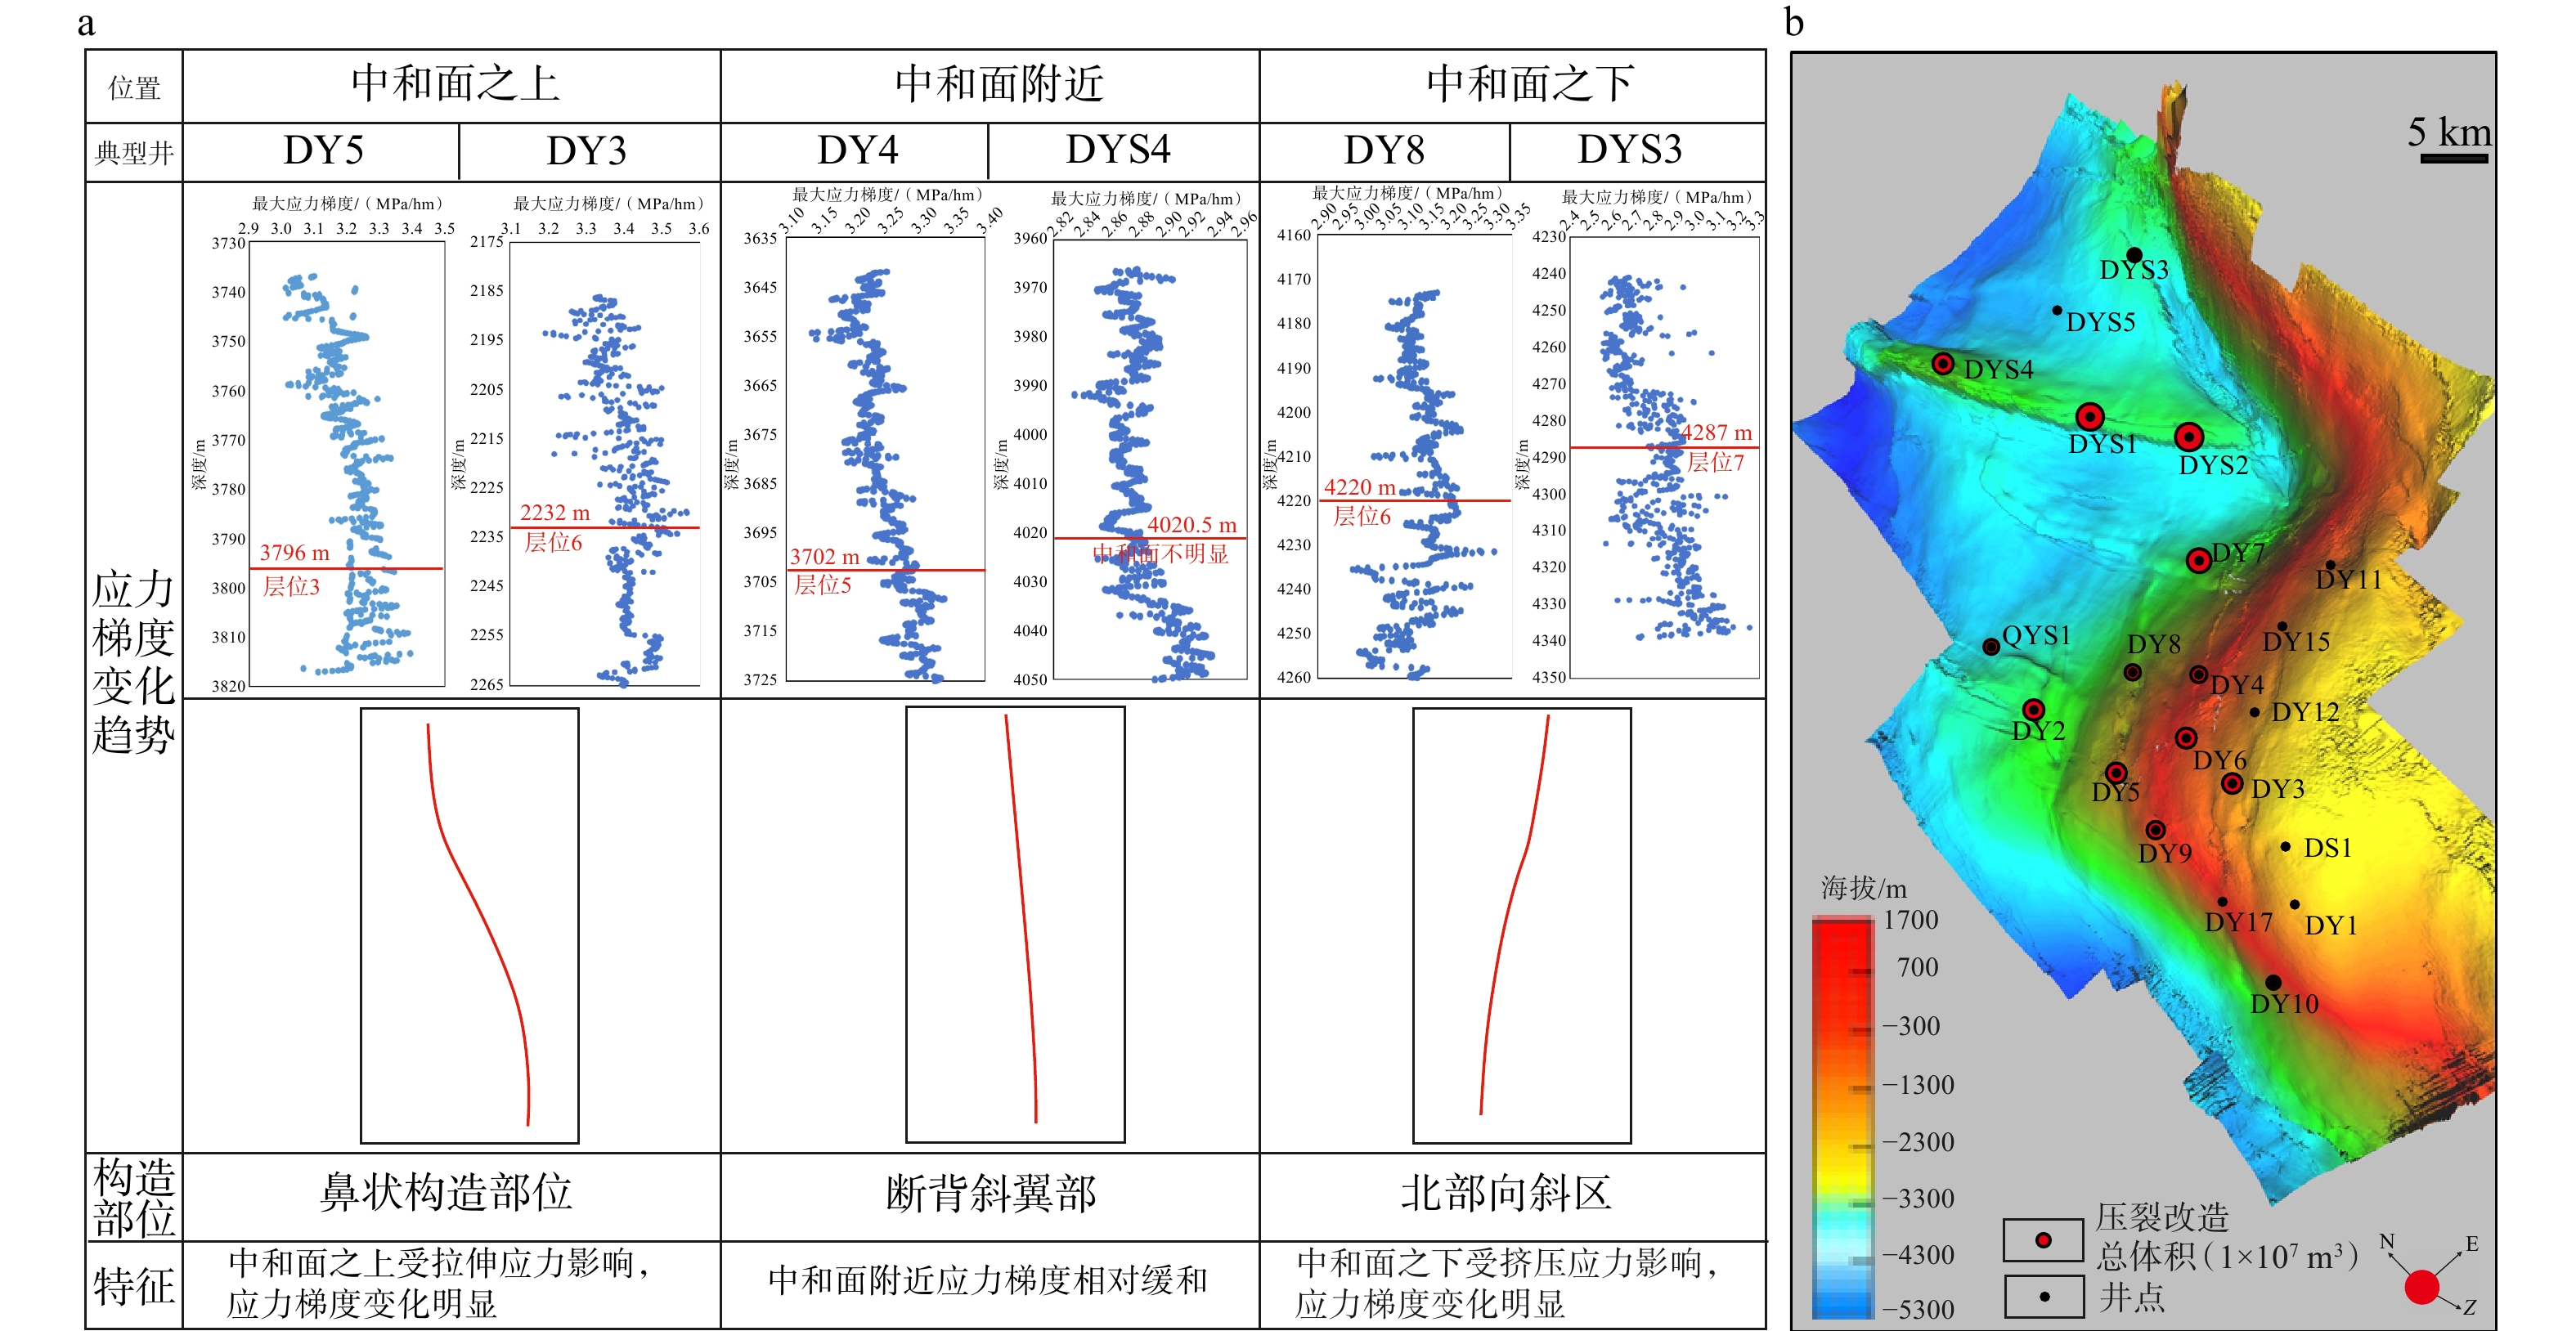
图 12 丁山−东溪地区不同构造变形部位纵向应力梯度变化规律及其对储层改造影响分析图
a—中和面不同构造位置关键钻井地应力的梯度变化规律模式图;b—不同构造位置关键井改造体积变化图
Figure 12. Analysis of minimum horizontal principal stress gradient variation patterns across different structural deformation zones in the Dingshan–Dongxi area and their impact on reservoir stimulation
(a) Schematic diagram of gradient variation patterns of in-situ stresses at key drilling locations across different structural positions of the neutral surface; (b) Variation diagram of stimulated reservoir volume for key wells at different structural positions
表 1 丁山—东溪地区龙一段声发射地应力大小测试结果
Table 1. Acoustic emission-based in-situ stress measurements for the first member of Longmaxi Formation in the Dingshan–Dongxi region
井号 深度/m 声发射Kaiser效应点值 最大水平
地应力/MPa最小水平
地应力/MPa垂向地应力/
MPa水力压裂裂缝
闭合压力/MPa0° 45° 90° 垂直 DY1 2045.00 37.45 31.65 36.35 38.51 54.10 43.54 49.76 46.36 DY1 2050.00 40.52 34.65 39.68 38.75 57.52 46.59 50.03 — DY2 4301.00 64.29 54.21 61.75 60.21 121.47 103.67 107.43 — DY2 4320.00 65.15 54.38 61.95 60.12 122.62 104.01 107.55 — DY2 4360.00 66.31 55.08 62.14 59.86 123.83 105.07 107.73 102.56 DY5 3779.42 62.18 51.28 57.91 49.39 107.62 89.58 92.81 91.25 DY6 3444.60 64.18 54.34 57.35 59.12 94.08 79.53 84.70 78.96 DY7 4106.30 55.13 42.72 50.21 47.27 114.04 93.54 100.04 — DY7 4109.49 58.83 46.02 53.08 47.86 117.46 96.77 100.67 97.70 DY7 4115.22 59.18 47.56 54.38 48.23 117.54 98.48 101.11 — DY7 4117.50 60.02 48.05 55.03 48.56 118.58 98.98 101.47 — DY8 4234.07 69.54 55.94 62.31 62.12 123.08 101.84 105.18 105.35 DYS1 4167.20 67.36 55.68 65.21 65.13 113.66 92.34 101.57 — DYS1 4186.36 69.62 58.27 67.03 66.38 115.35 95.07 102.99 — DYS1 4191.45 68.65 56.17 66.80 65.46 116.25 93.06 102.11 — DYS1 4198.10 66.83 56.27 65.53 65.86 113.10 93.24 102.57 — DYS1 4219.30 69.88 56.71 65.59 66.37 116.14 93.68 103.27 93.15 DYS1 4223.72 72.34 59.2 67.61 66.70 118.22 96.16 103.64 — DYS2 4217.31 67.45 54.46 62.18 74.26 119.66 98.29 104.89 101.73 DYS3 4250.00 76.15 67.86 73.59 69.85 117.06 102.81 104.91 103.25  下载: 导出CSV
表 2 不同构造单元构造应力系数
Table 2. Statistics of tectonic stress coefficients for different structural units
类型 断凹部位 褶皱窄闭凹部位 斜坡区 断背斜核部 丁山褶皱变形核部 井号 DY2 DY8 DY10 DY6 DYS3 DYS1 DYS2 DYS4 DY7 DY1 DY3 DY15 最大构造应力系数 1.44 1.55 1.53 1.52 1.42 1.35 1.48 1.42 1.31 1.38 1.14 1.20 最小构造应力系数 1.02 1.07 1.16 1.05 0.96 0.86 0.82 0.80 0.80 0.95 0.80 0.64
下载: 导出CSV
表 3 各机器学习模型对关键岩石力学与地应力预测效果的评价指标分布统计表
Table 3. Performance metrics of machine learning models for predicting key rock mechanical and in-situ stress parameters
有监督学习
模型评价指标 内聚力/
MPa内摩擦角/
(°)Ⅱ型断裂韧性/
MPa.m1/2泊松比 杨氏模量/
MPa抗压强度/
MPa垂直
主应力/MPa最大水平
主应力/MPa最小水平
主应力/MPaANN-PSO RMSE 1.330 1.878 0.059 0.043 4.538 4.383 12.08 11.89 9.93 MAE 1.006 1.338 0.046 0.038 3.514 3.324 8.64 9.29 7.64 R² 0.880 0.034 0.737 0.055 0.548 0.780 0.56 0.60 0.66 Light
GBMRMSE 0.163 0.116 0.010 0.023 1.567 0.541 9.83 10.70 8.35 MAE 0.731 0.222 0.81 6.630 2.503 0.235 5.91 6.68 5.79 R² 0.998 0.996 0.992 0.831 0.946 0.998 0.75 0.66 0.84 XG
BoostRMSE 0.397 0.217 0.018 0.036 1.809 0.384 8.45 6.32 5.12 MAE 1.88 0.44 1.534 13.930 2.100 0.207 3.57 4.48 3.63 R² 0.989 0.987 0.975 0.342 0.911 0.998 0.85 0.92 0.96
下载: 导出CSV
表 4 川南地区五峰组—龙一段页岩储层应力隔层最小水平主应力层间差异值
Table 4. Minimum horizontal principal stress contrast between stress barriers in the Wufeng Formation to Long 1 Member shale reservoir, southern Sichuan Basin
应力隔层位置 应力隔层上/下岩性变化 储隔应力差/MPa(最小值~最大值/平均值) ①号小层与②号小层 观音桥段介壳灰岩强硬层 5.56~9.12/7.86 ③号小层与④号小层 富炭硅质页岩与黏土质页岩 3.52~6.45/5.02 ⑦号小层与⑧号小层 中炭硅质−黏土质页岩与中炭黏土质页岩 4.35~7.42/6.11 ⑤号小层与⑥号小层 高炭硅质−黏土质页岩与中炭硅质−黏土质页岩 6.12~9.36/8.24
下载: 导出CSV
-
[1] ANDERSON R A, INGRAM D S, ZANIER A M, 1973. Determining fracture pressure gradients from well logs[J]. Journal of Petroleum Technology, 25(11): 1259-1268. doi: 10.2118/4135-pa [2] ASTM International. Standard Test Method for Triaxial Compressive Strength of Undrained Rock Core Specimens Without Pore Pressure Measurements: ASTM D2664/D2664M-20 [S]. West Conshohocken, PA: ASTM International, 2020. [3] BOWERS G L, 2001. Determining an appropriate pore-pressure estimation strategy[C]//Offshore technology conference. Houston, Texas: OnePetro. [4] DENG J G, CHEN Z R, GENG Y N, et al., 2013. Prediction model for in-situ formation stress in shale reservoirs[J]. Journal of China University of Petroleum, 37(6): 59-64. (in Chinese with English abstract) [5] EATON B A, 1975. The equation for geopressure prediction from well logs[C]//Fall meeting of the society of petroleum engineers of AIME. Dallas, Texas: OnePetro. [6] GE H K, LIN Y S, 1998. Distribution of in-situ stresses in oilfield[J]. Fault-Block Oil & Gas Field, 5(5): 1-5. (in Chinese with English abstract) [7] HAN H X, YIN S D, 2018. Determination of in-situ stress and geomechanical properties from borehole deformation[J]. Energies, 11(1): 131. doi: 10.3390/en11010131 [8] HE J H, DING W L, WANG Z, et al., 2015. Main controlling factors of fracture network formation of volume fracturing in shale reservoirs and its evaluation method[J]. Geological Science and Technology Information, 34(4): 108-118. (in Chinese with English abstract) [9] HE J H, XIONG L, WANG R Y, et al., 2025. Disturbance factors of current geostress field of Longmaxi Formation shale in southeastern Sichuan Basin and their geological significance for gas exploitation[J]. Acta Petrolei Sinica, 46(4): 743-762. (in Chinese with English abstract) [10] HOTTMANN C E, JOHNSON R K, 1965. Estimation of formation pressures from log-derived shale properties[J]. Journal of Petroleum Technology, 17(6): 717-722. [11] HU D F, WEI Z H, LI Y P, et al., 2022. Deep shale gas exploration in complex structure belt of the southeastern Sichuan Basin: progress and breakthrough[J]. Natural Gas Industry, 42(8): 35-44. (in Chinese with English abstract) [12] HUANG R Z, 1984. A model for predicting formation fracture pressure[J]. Journal of East China Institute of Petroleum, 8(4): 335-347. (in Chinese with English abstract) [13] JAMSHIDIAN M, ZADEH M M, HADIAN M, et al., 2017. Estimation of minimum horizontal stress, geomechanical modeling and hybrid neural network based on conventional well logging data: a case study[J]. Geosystem Engineering, 20(2): 88-103. doi: 10.1080/12269328.2016.1227728 [14] JU W, NIU X B, FENG S B, et al., 2020. The present-day in-situ stress state and fracture effectiveness evaluation in shale oil reservoir: a case study of the Yanchang formation Chang 7 oil-bearing layer in the Ordos Basin[J]. Journal of China University of Mining & Technology, 49(5): 931-940. (in Chinese with English abstract) [15] LI P, ZHANG J S, HE Q, et al, 2024. Safety assessment and heterogeneity of China’s energy supply under the carbon peaking goal[J]. Journal of Beijing Institute of Technology (Social Sciences Edition), 26(3): 51-63. (in Chinese with English abstract) [16] LIU R, HAO F, ENGELDER T, et al., 2019. Stress memory extracted from shale in the vicinity of a fault zone: implications for shale-gas retention[J]. Marine and Petroleum Geology, 102: 340-349. doi: 10.1016/j.marpetgeo.2018.12.047 [17] LONG S X, FENG D J, LI F X, et al., 2018. Prospect of the deep marine shale gas exploration and development in the Sichuan Basin[J]. Natural Gas Geoscience, 29(4): 443-451. (in Chinese with English abstract) doi: 10.1016/j.ptlrs.2018.10.001 [18] MA T S, XIANG G F, SHI Y F, et al., 2022. Horizontal in situ stresses prediction using a CNN-BiLSTM-attention hybrid neural network[J]. Geomechanics and Geophysics for Geo-Energy and Geo-Resources, 8(5): 152. doi: 10.1007/s40948-022-00467-2 [19] MATTHEWS W R, KELLY J, 1967. How to predict formation pressure and fracture gradient[J]. Oil and Gas Journal, 65(8): 92-106. [20] Ministry of Land and Resources of the People's Republic of China , 2015 Regulation for Testing the Physical and Mechanical Properties of Rock—Part 20: Test for Determining the Density of Rock: DZ/T 0276.20—2015 [S]. Beijing: Standards Press of China. (in Chinese) [21] National Technical Committee on Petroleum and Natural Gas of Standardization Administration of China, 2013. Practices for Core Analysis: GB/T 29172-2012 [S]. Beijing: Standards Press of China. (in Chinese) [22] National Land and Resources Standardization Technical Committee, 2015. Regulation for Testing the Physical and Mechanical Properties of Rock - Part 31: Test for Determining the Tensile Strength of Rock (Brazilian Method): DZ/T 0276.31—2015 [S]. Beijing: Geological Publishing House. (in Chinese) [23] SINGH A, ZOBACK M D, 2022. Predicting variations of the least principal stress with depth: application to unconventional oil and gas reservoirs using a log-based viscoelastic stress relaxation model[J]. Geophysics, 87(3): MR105-MR116. [24] SU H G, LUO L M, 2023. Research status of ground stress test technology[J]. Shaanxi Coal, 42(1): 59-62. (in Chinese with English abstract) [25] SUN D S, PANG F, LI A W, et al., 2020. In-situ stress profile prediction based on the rheological model: a case study of Well AY-1 in the Qianbei area of Guizhou Province[J]. Natural Gas Industry, 40(3): 58-64. (in Chinese with English abstract) [26] SUN D S, ZHOU X Z, DAN YONG, et al., 2021. Measurement and Distribution Patterns of Minimum Horizontal Principal Stress in Shale Reservoirs[J]. Journal of China University of Petroleum (Edition of Natural Science), 45(5): 80-87. (in Chinese with English abstract) [27] TIAN R F, LI S, LIU T, et al., 2024. vP/vS prediction based on XGBoost algorithm and its application in reservoir detection[J]. Oil Geophysical Prospecting, 59(4): 653-663. (in Chinese with English abstract) [28] WANG J, CAO J X, ZHAO S, et al., 2022. S-wave velocity inversion and prediction using a deep hybrid neural network[J]. Science China Earth Sciences, 65(4): 724-741. doi: 10.1007/s11430-021-9870-8 [29] WANG R Y, HU Z Q, ZHOU T, et al., 2021. Characteristics of fractures and their significance for reservoirs in Wufeng-Longmaxi shale, Sichuan Basin and its periphery[J]. Oil & Gas Geology, 42(6): 1295-1306. [30] WANG K M, 2023. Enrichment characteristics of deep shale gas in tectonically complex regions of the southeastern Sichuan Basin[J]. Natural Gas Geoscience, 34(2): 334-348. (in Chinese with English abstract) doi: 10.1016/j.jnggs.2023.04.001 [31] WU M Y, CHANG X, GUO Y T, et al., 2025. Advances, challenges, and opportunities for hydraulic fracturing of deep shale gas reservoirs[J]. Advances in Geo-Energy Research, 15(1): 1-4. doi: 10.46690/ager.2025.01.01 [32] XIA H Q, PENG M, SONG E C, 2019. Calculating method and application of rock anisotropic Biot coefficient[J]. Well Logging Technology, 43(5): 478-483. (in Chinese with English abstract) [33] ZHANG B, WANG X T, XU F Y, et al., 2025. Research on pore pressure prediction method based on XGBoost[J]. Progress in Geophysics, 40(2): 541-555. (in Chinese with English abstract) [34] ZHANG J C, WANG Z Y, NIE H K, et al., 2008. Shale gas and its significance for exploration[J]. Geoscience, 22(4): 640-646. (in Chinese with English abstract) [35] ZHANG J C, QI Y C, 2020. Impact of in-situ stresses on shale reservoir development and its countermeasures[J]. Oil & Gas Geology, 41(4): 776-783, 799. (in Chinese with English abstract) [36] ZHANG P X, GAO Q F, HE X P, et al., 2023. Characteristics of in-situ stress field and its influence on shale gas production from Longmaxi Formation in Nanchuan area[J]. Petroleum Geology and Recovery Efficiency, 30(4): 55-65. (in Chinese with English abstract) [37] ZHAO J Z, YONG R, HU D F, et al., 2024. Deep and ultra-deep shale gas fracturing in China: problems, challenges and directions[J]. Acta Petrolei Sinica, 45(1): 295-311. (in Chinese with English abstract) [38] ZHAO W Z, DONG D Z, LI J Z, et al., 2012. The resource potential and future status in natural gas development of shale gas in China[J]. Strategic Study of CAE, 14(7): 46-52. (in Chinese with English abstract) [39] 邓金根, 陈峥嵘, 耿亚楠, 等, 2013. 页岩储层地应力预测模型的建立和求解[J]. 中国石油大学学报(自然科学版), 37(6): 59-64. doi: 10.3969/j.issn.1673-5005.2013.06.009 [40] 葛洪魁, 林英松, 1998. 油田地应力的分布规律[J]. 断块油气田, 5(5): 1-5. [41] 何建华, 丁文龙, 王哲, 等, 2015. 页岩储层体积压裂缝网形成的主控因素及评价方法[J]. 地质科技情报, 34(4): 108-118. [42] 何建华, 熊亮, 王濡岳, 等, 2025. 川东南地区龙马溪组页岩现今地应力场扰动因素及其开发地质意义[J]. 石油学报, 46(4): 743-762. doi: 10.7623/syxb202504006 [43] 胡东风, 魏志红, 李宇平, 等, 2022. 四川盆地东南部地区复杂构造带深层页岩气勘探进展与突破[J]. 天然气工业, 42(8): 35-44. doi: 10.3787/j.issn.1000-0976.2022.08.004 [44] 黄荣樽, 1984. 地层破裂压力预测模式的探讨[J]. 华东石油学院学报, 8(4): 335-347. [45] 鞠玮, 牛小兵, 冯胜斌, 等, 2020. 页岩油储层现今地应力场与裂缝有效性评价: 以鄂尔多斯盆地延长组长7油层组为例[J]. 中国矿业大学学报, 49(5): 931-940. [46] 李品, 张金锁, 贺琦, 等, 2024. 碳达峰目标下中国能源供给的安全评估及异质性[J]. 北京理工大学学报(社会科学版), 26(3): 51-63. [47] 龙胜祥, 冯动军, 李凤霞, 等, 2018. 四川盆地南部深层海相页岩气勘探开发前景[J]. 天然气地球科学, 29(4): 443-451. doi: 10.11764/j.issn.1672-1926.2018.03.007 [48] 全国国土资源标准化技术委员会, 2015. 岩石物理力学性质试验规程第31部分: 岩石抗拉强度试验(劈裂法): DZ/T 0276.31—2015 [S]. 北京: 地质出版社. [49] 全国石油天然气标准化技术委员会, 2013. 岩心分析方法: GB/T 29172-2012 [S]. 北京: 中国标准出版社. [50] 苏宏刚, 罗黎明, 2023. 地应力测试技术研究现状[J]. 陕西煤炭, 42(1): 59-62. [51] 孙东生, 庞飞, 李阿伟, 等, 2020. 基于流变模型的地应力剖面预测: 以贵州黔北地区安页1井为例[J]. 天然气工业, 40(3): 58-64. doi: 10.3787/j.issn.1000-0976.2020.03.007 [52] 孙东生, 禚喜准, 淡永, 等, 2021. 页岩储层水平最小主应力实测与分布规律[J]. 中国石油大学学报(自然科学版), 2021, 45(5): 80-87. [53] 田仁飞, 李山, 刘涛, 等, 2024. 基于XGBoost算法的vP/vS预测及其在储层检测中的应用[J]. 石油地球物理勘探, 59(4): 653-663. doi: 10.13810/j.cnki.issn.1000-7210.2024.04.001 [54] 王俊, 曹俊兴, 赵爽, 等, 2022. 基于深度混合神经网络的横波速度反演预测方法[J]. 中国科学: 地球科学, 52(6): 1151-1169. [55] 王濡岳, 胡宗全, 周彤, 等, 2021. 四川盆地及其周缘五峰组-龙马溪组页岩裂缝发育特征及其控储意义[J]. 石油与天然气地质, 42(6): 1295-1306. doi: 10.11743/ogg20210605 [56] 汪凯明, 2023. 川东南盆缘复杂构造区深层页岩气富集特征[J]. 天然气地球科学, 34(2): 334-348. doi: 10.11764/j.issn.1672-1926.2022.09.006 [57] 夏宏泉, 彭梦, 宋二超, 2019. 岩石各向异性Biot系数的获取方法及应用[J]. 测井技术, 43(5): 478-483. doi: 10.16489/j.issn.1004-1338.2019.05.007 [58] 张冰, 王晓婷, 徐福颖, 等, 2025. 基于XGBoost的孔隙压力预测方法研究[J]. 地球物理学进展, 40(2): 541-555. doi: 10.6038/pg2025JJ0121 [59] 张金才, 亓原昌, 2020. 地应力对页岩储层开发的影响与对策[J]. 石油与天然气地质, 41(4): 776-783, 799. doi: 10.11743/ogg20200411 [60] 张金川, 汪宗余, 聂海宽, 等, 2008. 页岩气及其勘探研究意义[J]. 现代地质, 22(4): 640-646. doi: 10.11817/j.issn.1672-7207.2021.10.015 [61] 张培先, 高全芳, 何希鹏, 等, 2023. 南川地区龙马溪组页岩气地应力场特征及对产量影响分析[J]. 油气地质与采收率, 30(4): 55-65. doi: 10.13673/j.pgre.202208024 [62] 赵金洲, 雍锐, 胡东风, 等, 2024. 中国深层—超深层页岩气压裂: 问题、挑战与发展方向[J]. 石油学报, 45(1): 295-311. doi: 10.7623/syxb202401017 [63] 赵文智, 董大忠, 李建忠, 等, 2012. 中国页岩气资源潜力及其在天然气未来发展中的地位[J]. 中国工程科学, 14(7): 46-52. [64] 中华人民共和国国土资源部, 2015. 岩石物理力学性质试验规程第20部分: 岩石体密度试验: DZ/T 0276.20—2015 [S]. 北京: 中国标准出版社. -

 下载:
下载:


计量
- 文章访问数: 1482
- HTML全文浏览量: 128
- PDF下载量: 198
- 被引次数: 0
