

Refined characterization and analysis of shallow crustal stresses based on hydraulic fracturing data
-
摘要: 查明浅部地应力场赋存状态,对地下工程的建设及安全运维作用重大,同时有助于揭示地应力的赋存机制。作为常用的地应力测量方法,水压致裂法在数据处理分析中通常将应力大小和方向分开确定:应力大小由压裂曲线解译得出,应力方向则由水力裂缝方位确定。基础此,文章以广东中南部2个500 m以浅的钻孔(ZK1、ZK2)为研究对象,系统提取并刻画了整孔水力裂缝形态,结合应力相对大小关系,获得了更为准确的应力值;进而构建了研究区应力剖面,并探究了天然裂缝密度对应力状态的影响。结果表明:ZK1钻孔整体呈逆冲型应力环境,ZK2钻孔应力环境随深度依次表现为逆冲型、走滑型和正断型;2个钻孔最大水平主应力方向分别为N18°W和N15°W。该结果不同于区域深部应力特征,揭示了浅部地应力赋存状态及其控制因素的差异。此外,研究发现天然裂缝密度较高也可能引起浅部应力场的变化。天然裂缝滑移趋势分析表明,ZK2钻孔中的天然裂缝稳定性总体上较好,而ZK1钻孔中的部分天然裂缝滑移趋势已接近0.6的经验摩擦极限,需重点监测其应力状态,以保障相关工程的安全。Abstract:
Objective In-situ stress field characterization is crucial for underground engineering safety, rock stability evaluation, and resource development. Current research in Guangdong Province is mainly concentrated on deep crustal levels, where stress interpretations predominantly rely on focal mechanism inversion and numerical modelling, while shallow stress conditions (<500 m) remain insufficiently constrained due to a lack of direct measurements and fine-scale analysis. To address this gap, this study constructs a shallow stress profile for two boreholes (ZK1 and ZK2, both < 500 m deep) in central–southern Guangdong using hydraulic fracturing and ultrasonic imaging data, aiming to refine shallow stress magnitudes, orientations, and occurrence mechanisms. Methods Borehole imaging was applied to record hydraulic fracture morphology before and after pressurization, ensuring accurate extraction of the principal stress orientation, while pressure curves and overburden stress were combined to determine stress magnitude. Stress regimes were further characterized using the Aφ parameter, and only intervals demonstrating reliable fracture propagation and stable pressurization response were selected to ensure high-quality stress results. Based on this, a shallow stress profile was established, and the Coulomb failure criterion was used to compute slip tendency (Ts) to evaluate natural fracture stability. Results Within the 253.8–349.8 m interval in ZK1, Shmin ranges from 7.8–12.1 MPa and SHmax from 13.7–21.7 MPa, corresponding to Aφ ≈ 2–3, indicative of thrust-faulting stress. In ZK2 at depths of 129.2–471.2 m, Shmin is 5.8–9.9 MPa and SHmax is 9.7–18.2 MPa, and Aφ shows a depth-dependent transition: thrust-faulting characteristics (Aφ ≈ 2–3) above 215.3 m, strike-slip stress (Aφ ≈ 1–2) at intermediate depths, and gradual evolution toward normal-faulting stress (Aφ ≈ 0–1) at greater depths. Hydraulic fractures in both boreholes are predominantly sub-vertical, with stable maximum horizontal stress orientations of N18°W in ZK1 and N15°W in ZK2, with standard deviations of <10°. Nonetheless, shallow intervals show pronounced azimuth deflection, above ~293 m in ZK1, the deviation reaches 23°, and above ~203 m in ZK2, it reaches 29° toward the NNE, possibly suggesting fracture-induced heterogeneity weakens the rock mass, modifies local stress anisotropy, and causes reorientation of SHmax. Slip tendency calculations show Ts <0.4 throughout ZK2, indicating good fracture stability, In contrast, in ZK1, clusters within 290 ± 30 m reach Ts ≈0.6 near the frictional instability limit, accompanied by elevated SHmax relative to predicted trends, implying higher reactivation potential and mechanical risk. Conclusions ZK1 is dominated by thrust-faulting stress with SHmax trending ~N18°W. ZK2 exhibits a progressive transformation from thrust to strike-slip to normal-faulting stress state as depth increases, with SHmax consistently oriented between N15°W and N18°W. The shallow stress field (<500 m) is different from that of the deeper crust (>5 km), where strike-slip and normal-fault regimes dominate due to high vertical lithostatic loads, while reduced vertical stress in shallow rock favors horizontal compression and thrust-related stress. Fractures in ZK2 are stable, whereas ZK1 contains intervals with high slip potential, which require priority monitoring. [ Significance] This work provides shallow in situ stress datasets for Guangdong derived from field measurements, significantly improves hydraulic fracturing interpretation reliability, offers essential mechanical parameters for near-surface engineering construction and hazard assessment, and demonstrates that shallow crust stress evolution is controlled by mechanisms distinct from those governing deeper tectonic stress fields, highlighting the scientific necessity of shallow stress measurement. -
Key words:
- in situ stress /
- hydraulic fracturing /
- stress field /
- stress occurrence state /
- slip tendency
-
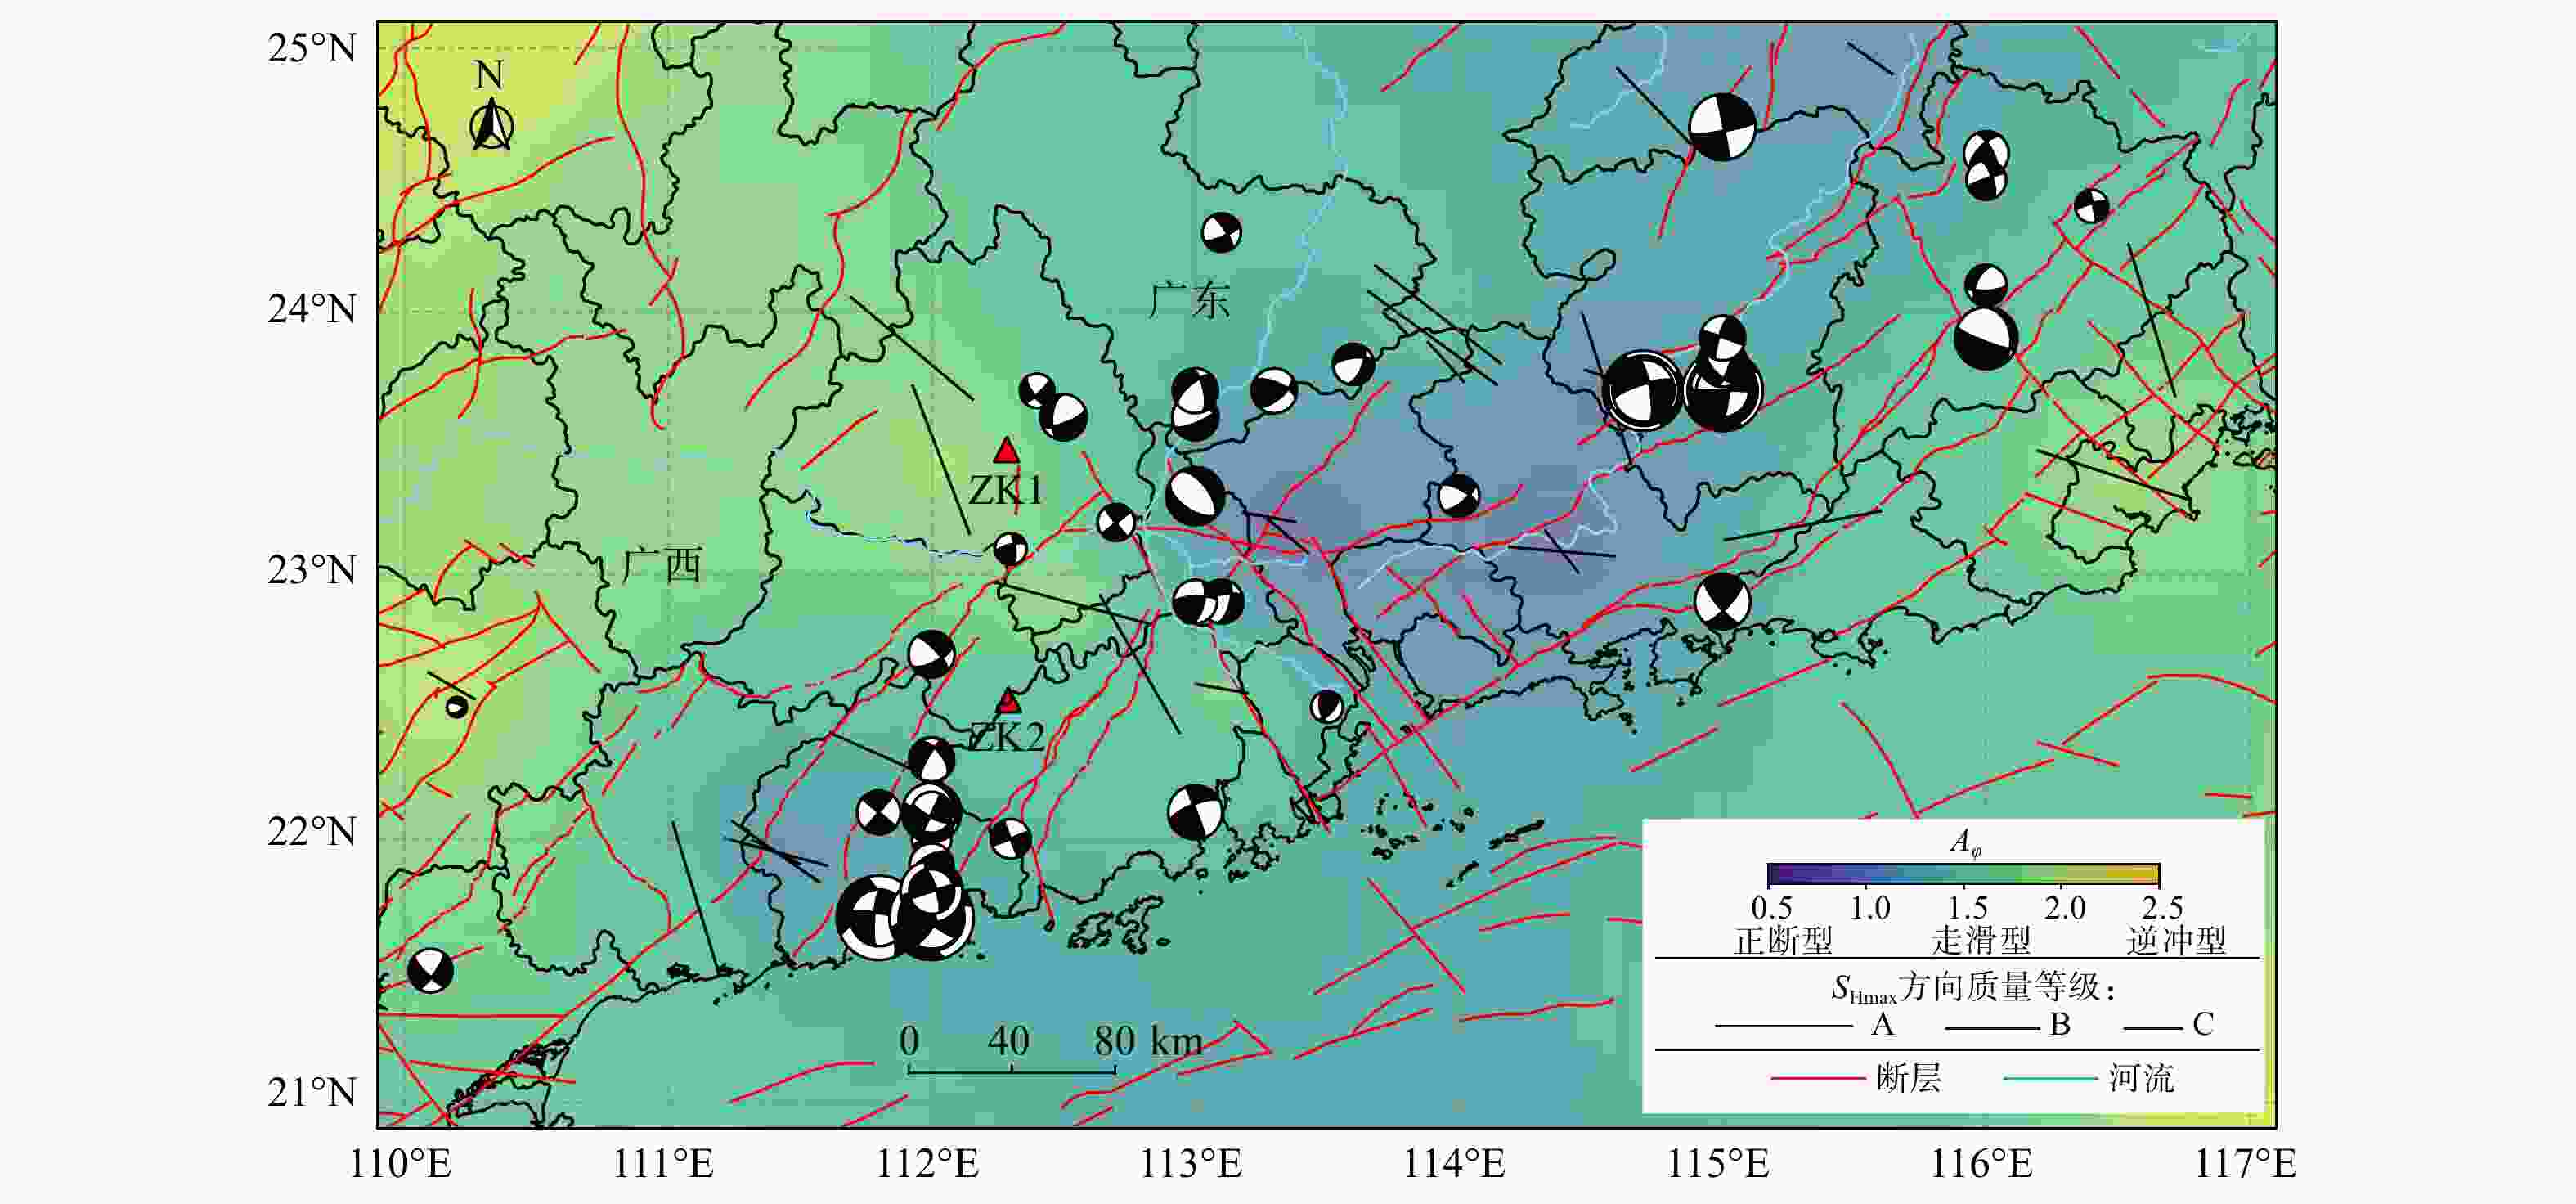
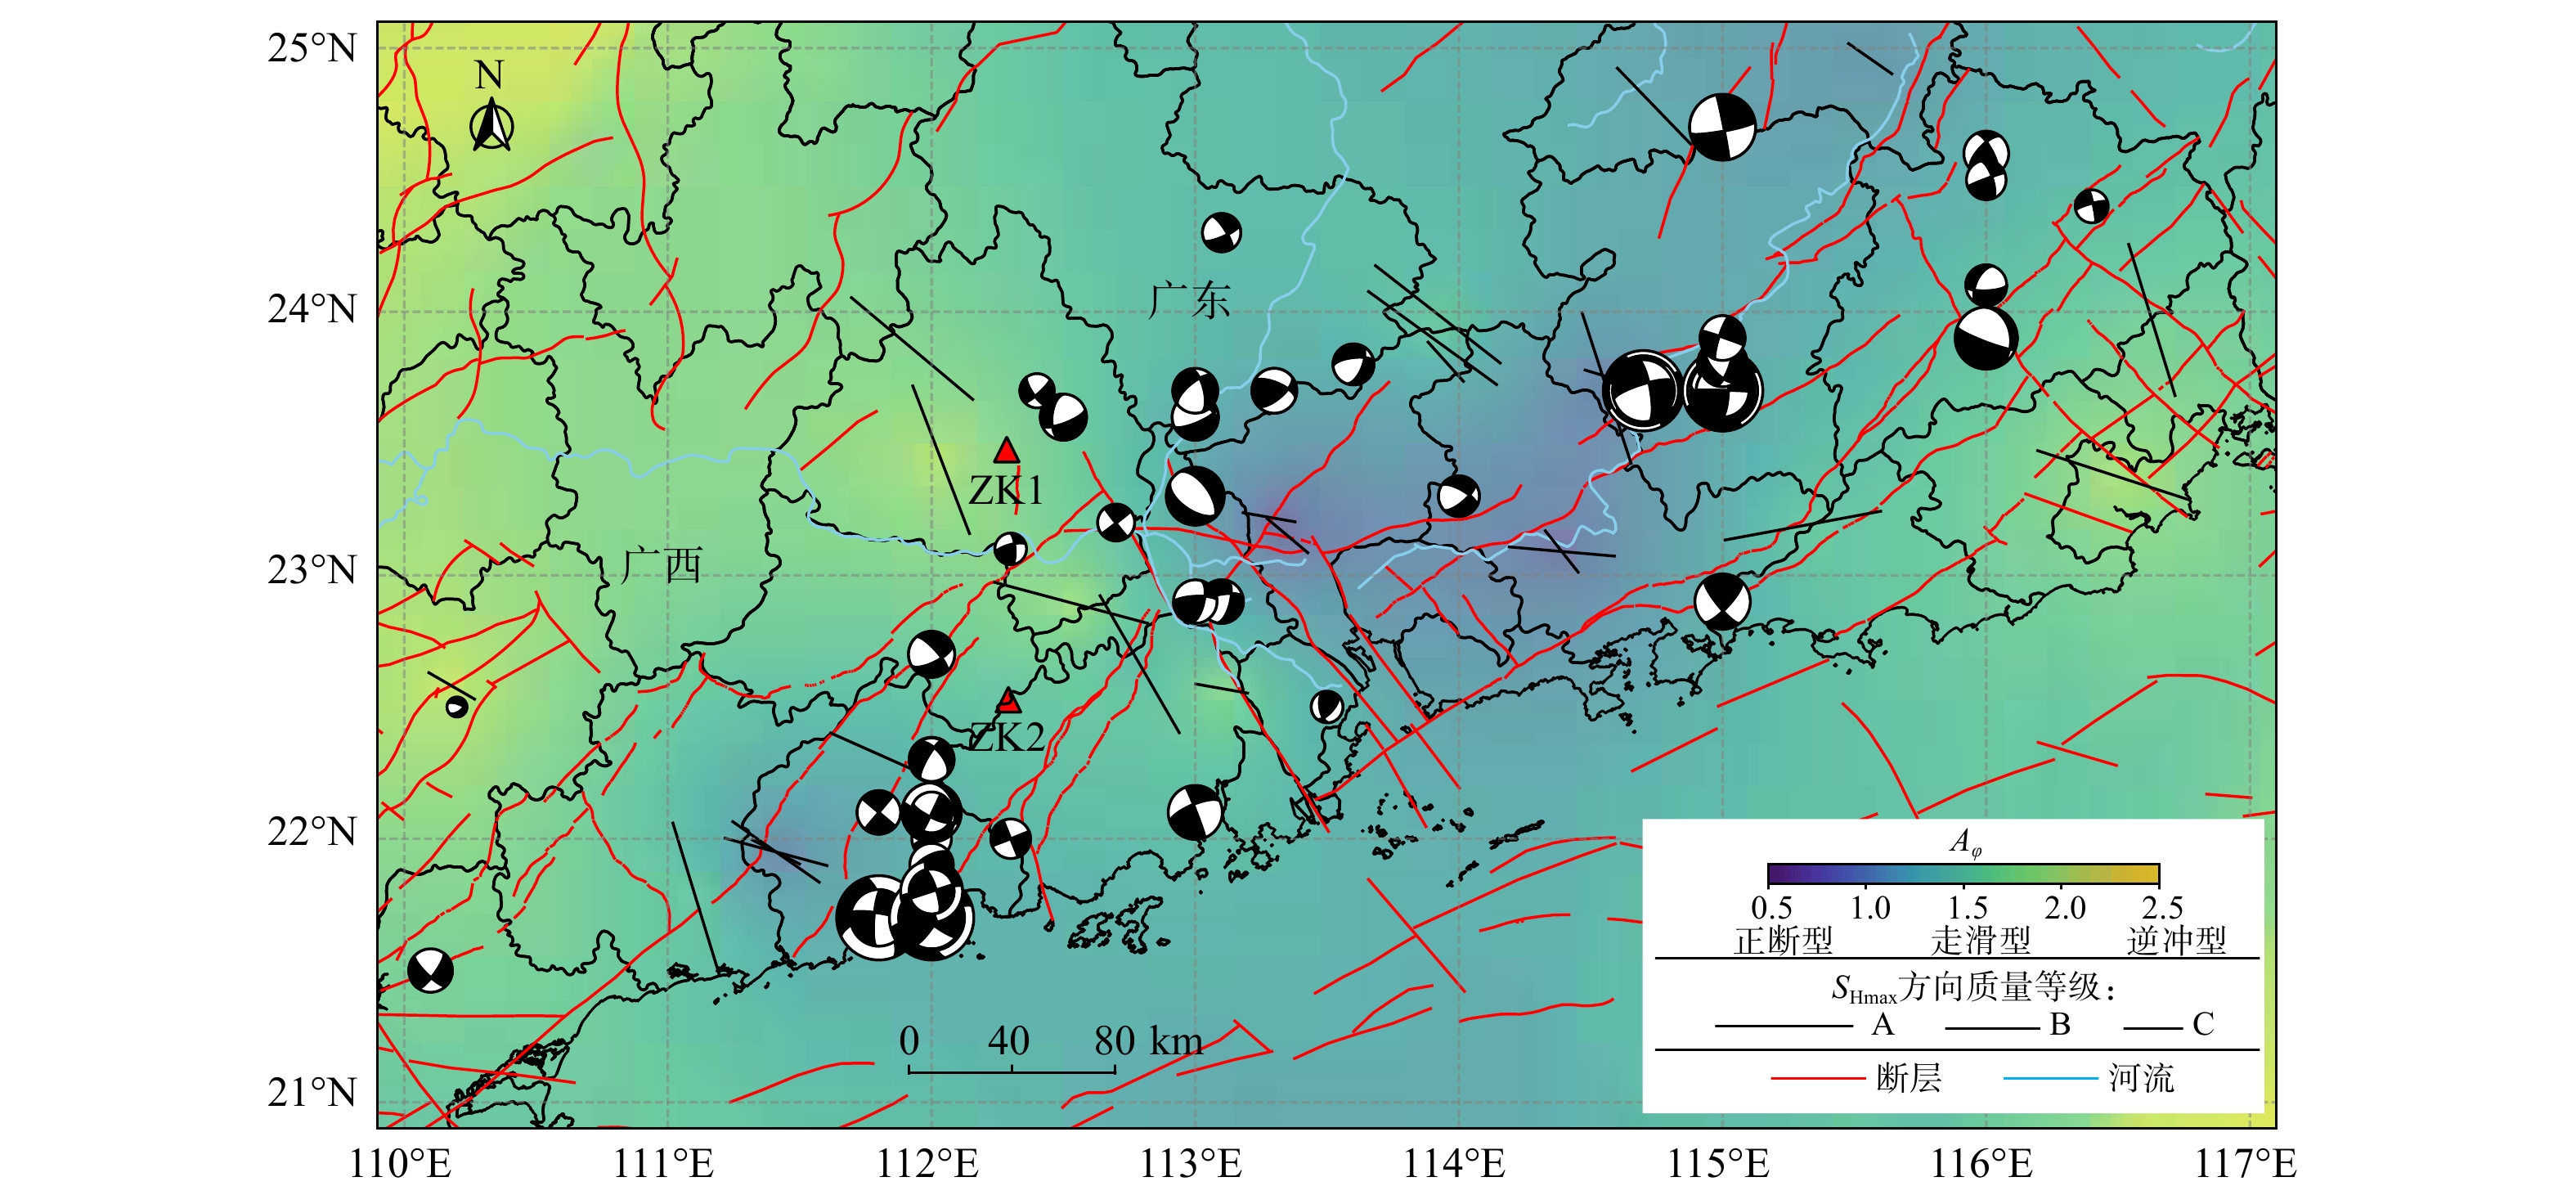
图 1 广东及其邻区应力场
ZK1与ZK2为2个钻孔所在位置;黑色线条指向为SHmax的方向;黑白沙滩球为况文欢等(2025)反演的83组震源机制解
Figure 1. The stress field in Guangdong Province and its adjacent areas
The locations of ZK1 and ZK2 boreholes are marked with triangles. The orientation of the black lines shows the SHmax azimuth. The beach balls represent 83 focal mechanism solutions inverted by Kuang et al., (2025).
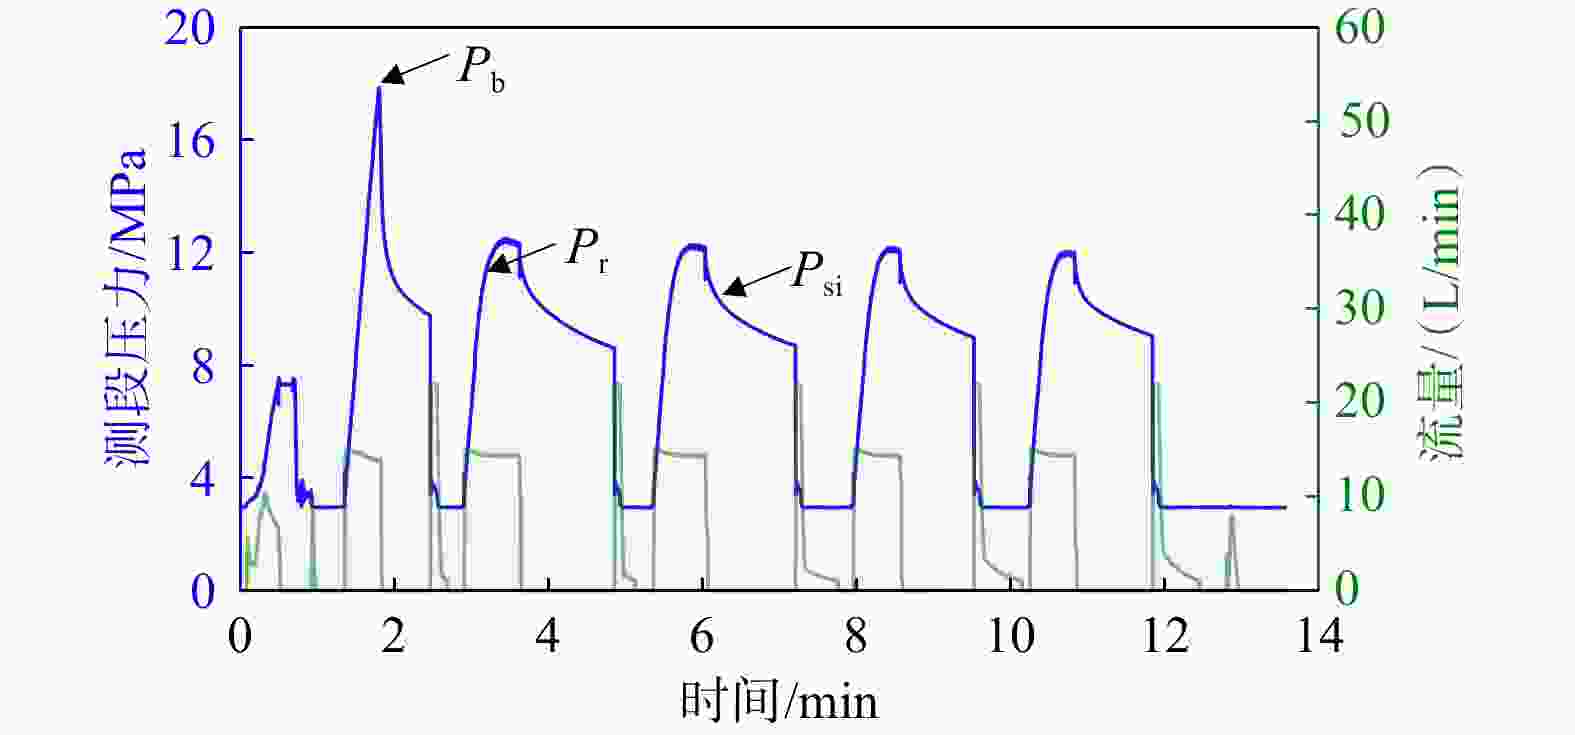
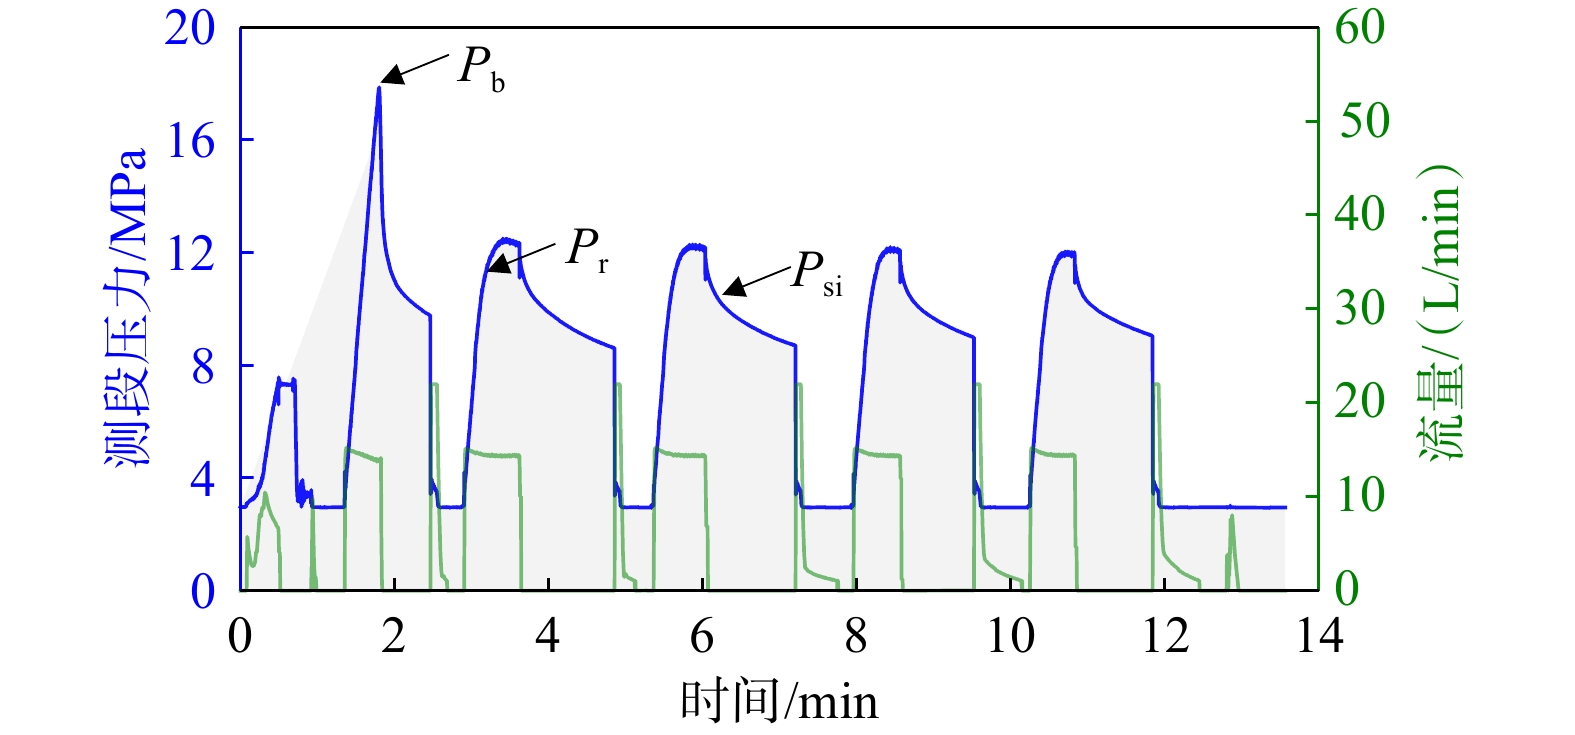
图 2 ZK1钻孔290.8 m测段水压致裂典型压裂曲线
Pb、Psi和Pr分别表示破裂压力、瞬时关闭压力和裂缝重张压力
Figure 2. Pressure curve of hydraulic fracturing in 290.8 m of ZK1
Pb、Psi and Pr represent breakdown pressure, instantaneous shut-in pressure and fracture reopening pressure, respectively
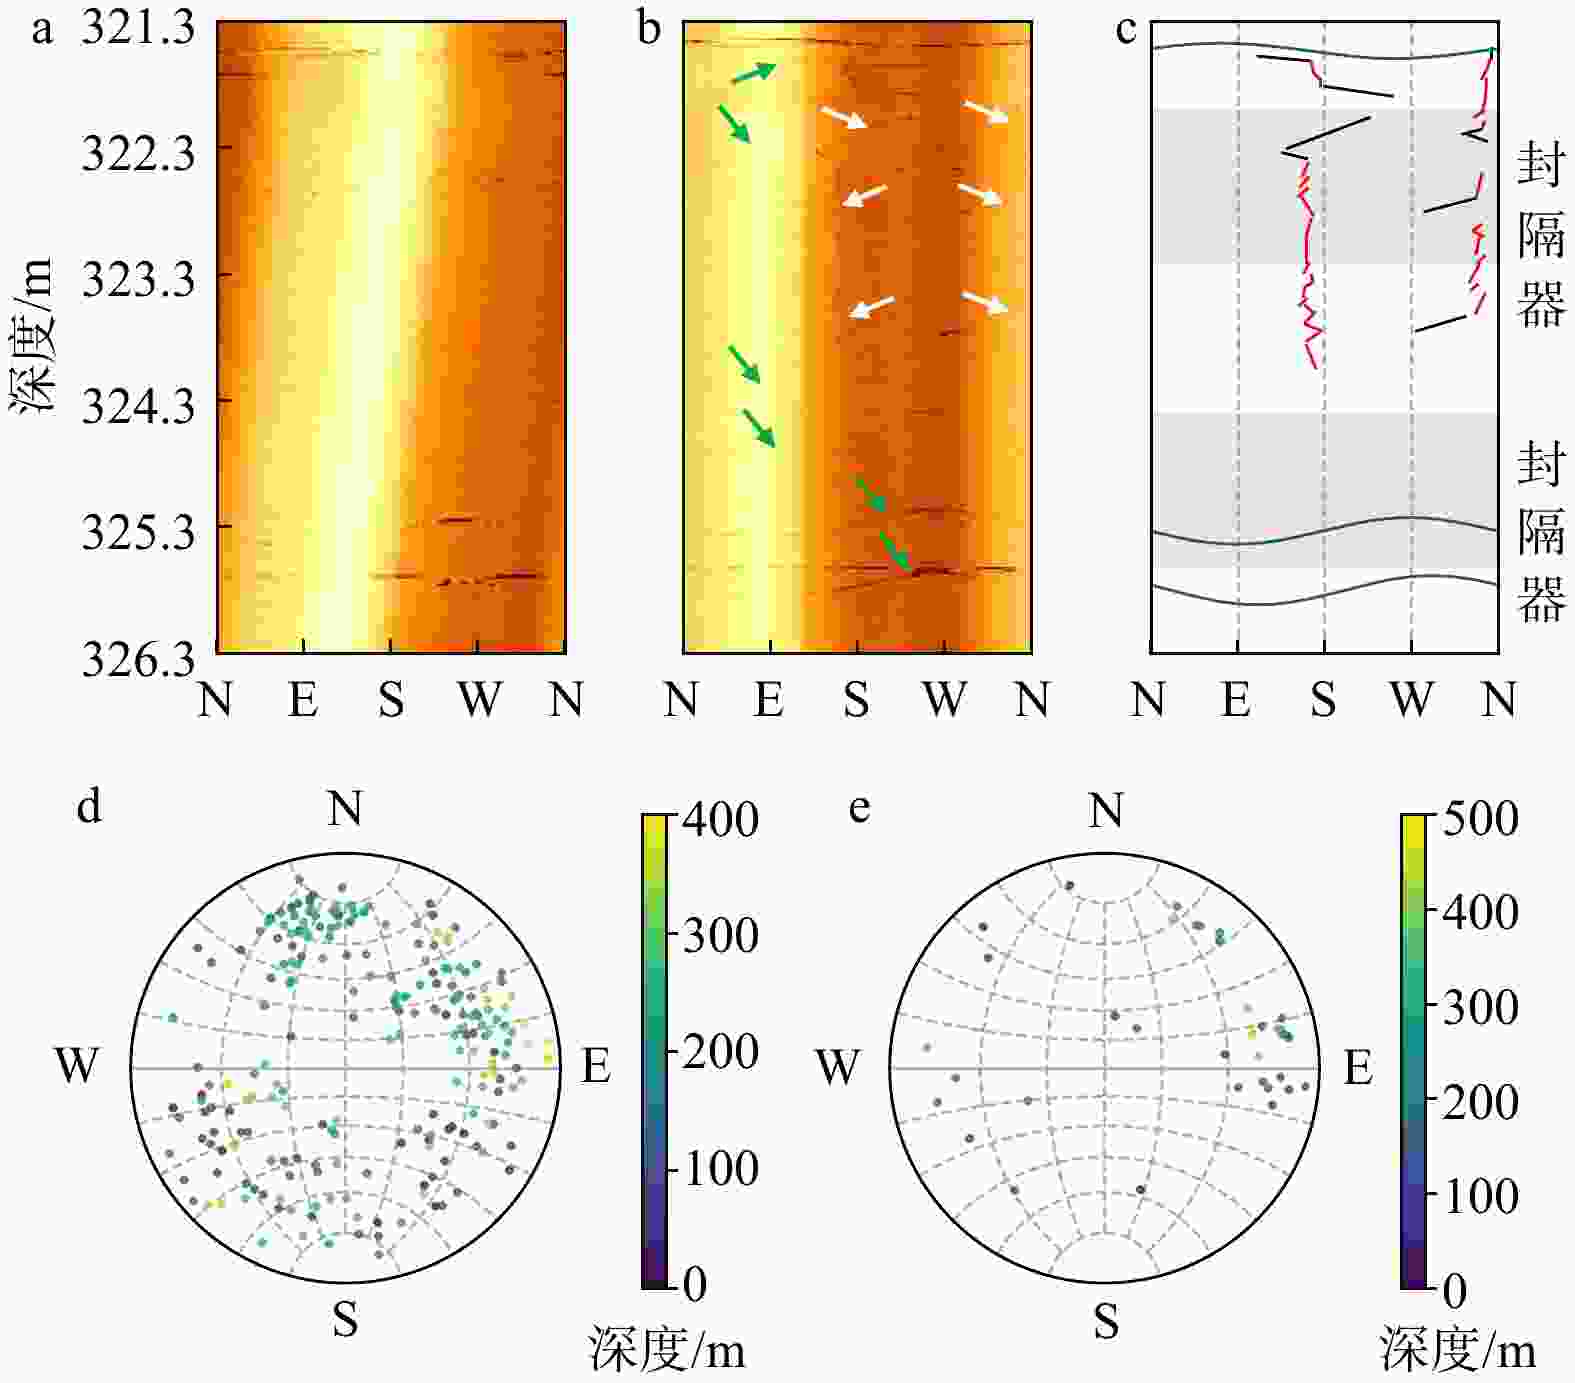
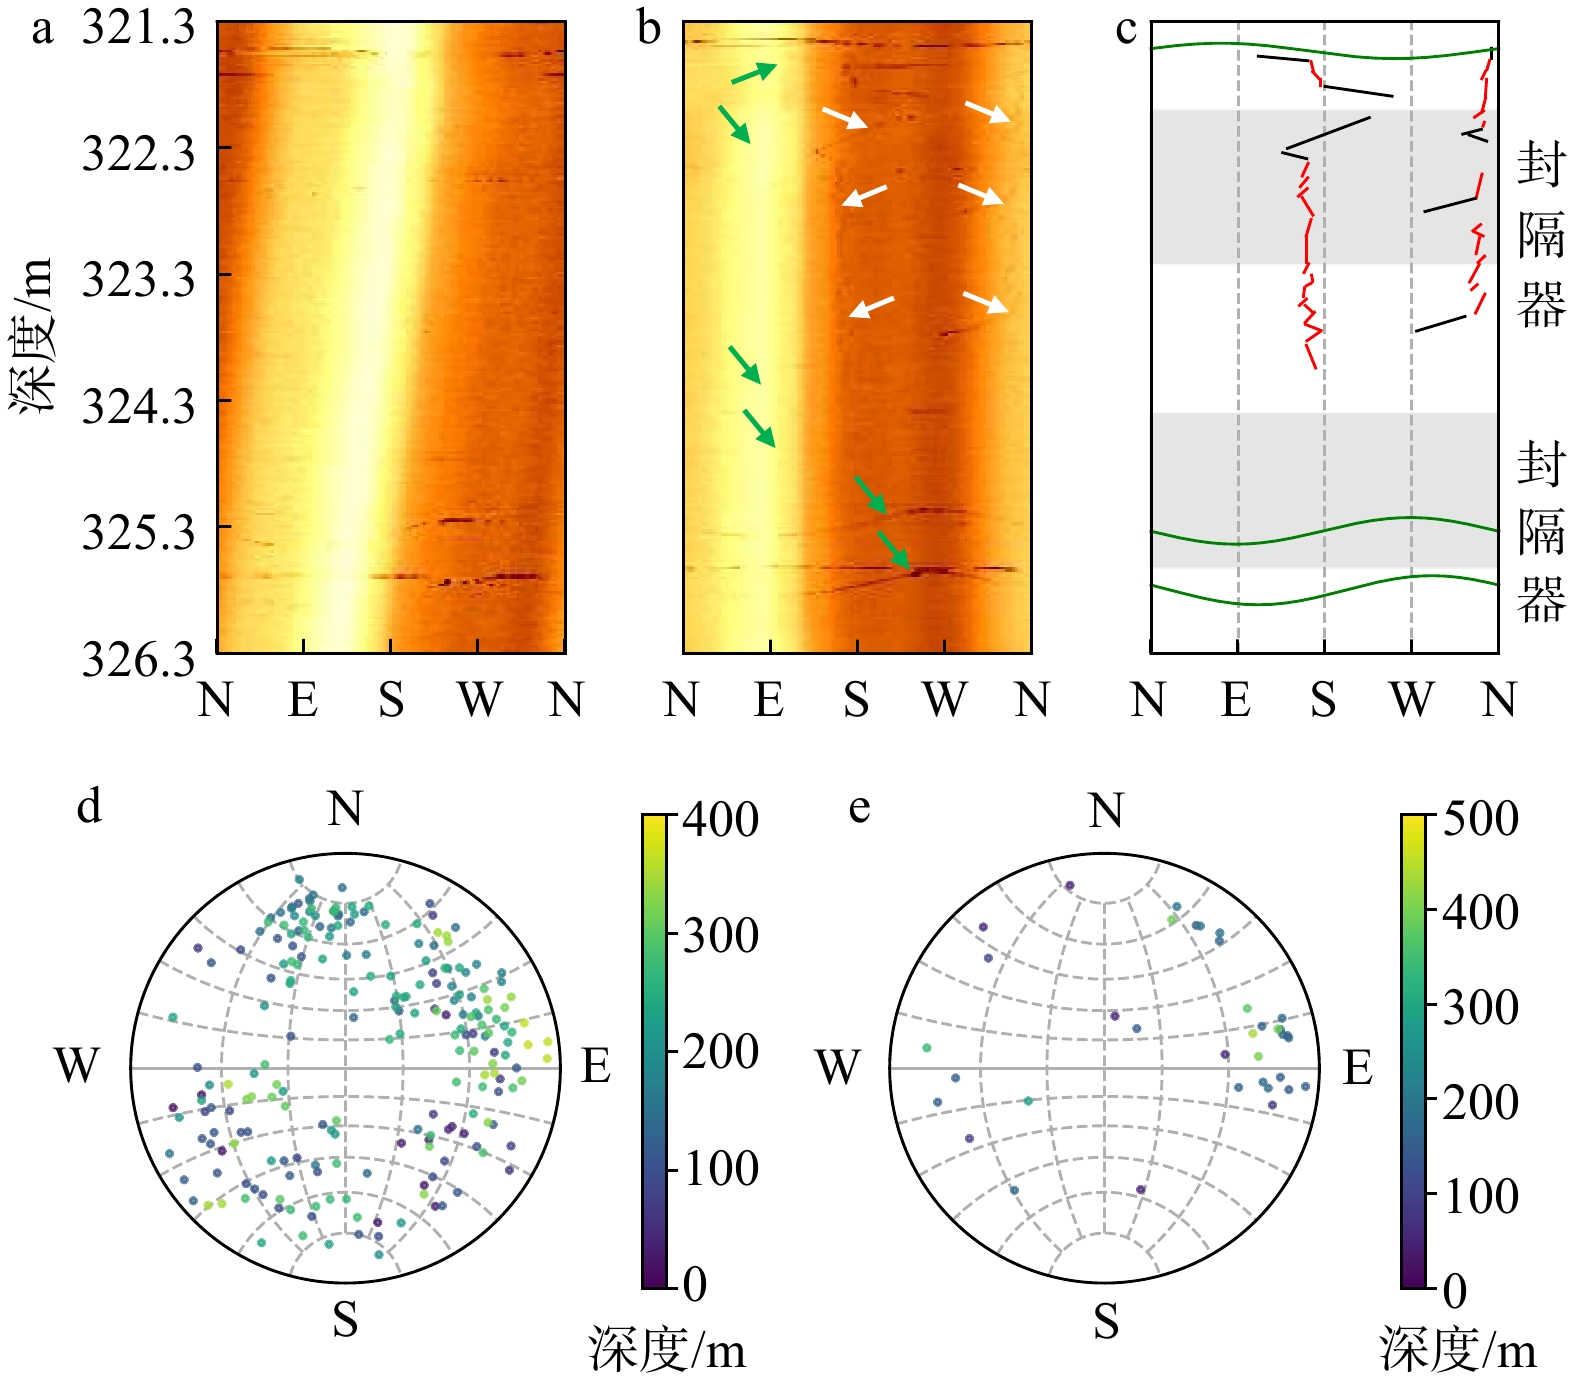
图 3 ZK1钻孔323.8 m测段典型水力裂缝形态及2个钻孔天然裂缝下球面投影
图b中白色箭头指示水力裂缝,绿色箭头指示天然裂缝;图c中红色折线表示倾斜角小于15°的拉伸裂缝,黑色折线为倾斜角大于15°的拉伸裂缝,绿色正弦曲线为天然裂缝;图d和e中散点为天然裂缝走向和倾角的下球面投影,颜色表示天然裂缝所处深度a—压裂前振幅图像;b—压裂后振幅图像;c—水力裂缝拾取示意图;d—ZK1钻孔天然裂缝下球面投影;e—ZK2钻孔天然裂缝下球面投影
Figure 3. Hydraulic fracture near the depth of 323.8 m in ZK1, and spherical projection under natural fractures of two boreholes
(a) Amplitude image before hydraulic fracturing; (b) Amplitude image after hydraulic fracturing; (c) Schematic diagram of hydraulic fracture picking; (d) Lower hemisphere projection of natural fractures in borehole ZK1; (e) Lower hemisphere projection of natural fractures in borehole ZK2In panel b, white arrows indicate hydraulic fractures, and the green arrows indicate natural fractures. In panel c, red polylines indicate tensile fractures with dip angles less than 15°, while black polylines represent those with dip angles greater than 15°, and the green sinusoidal curves represent natural fractures. Scatters in panels d and e show the lower-hemisphere projections of the strike and dip of natural fractures, with the color representing the depth of natural fractures.
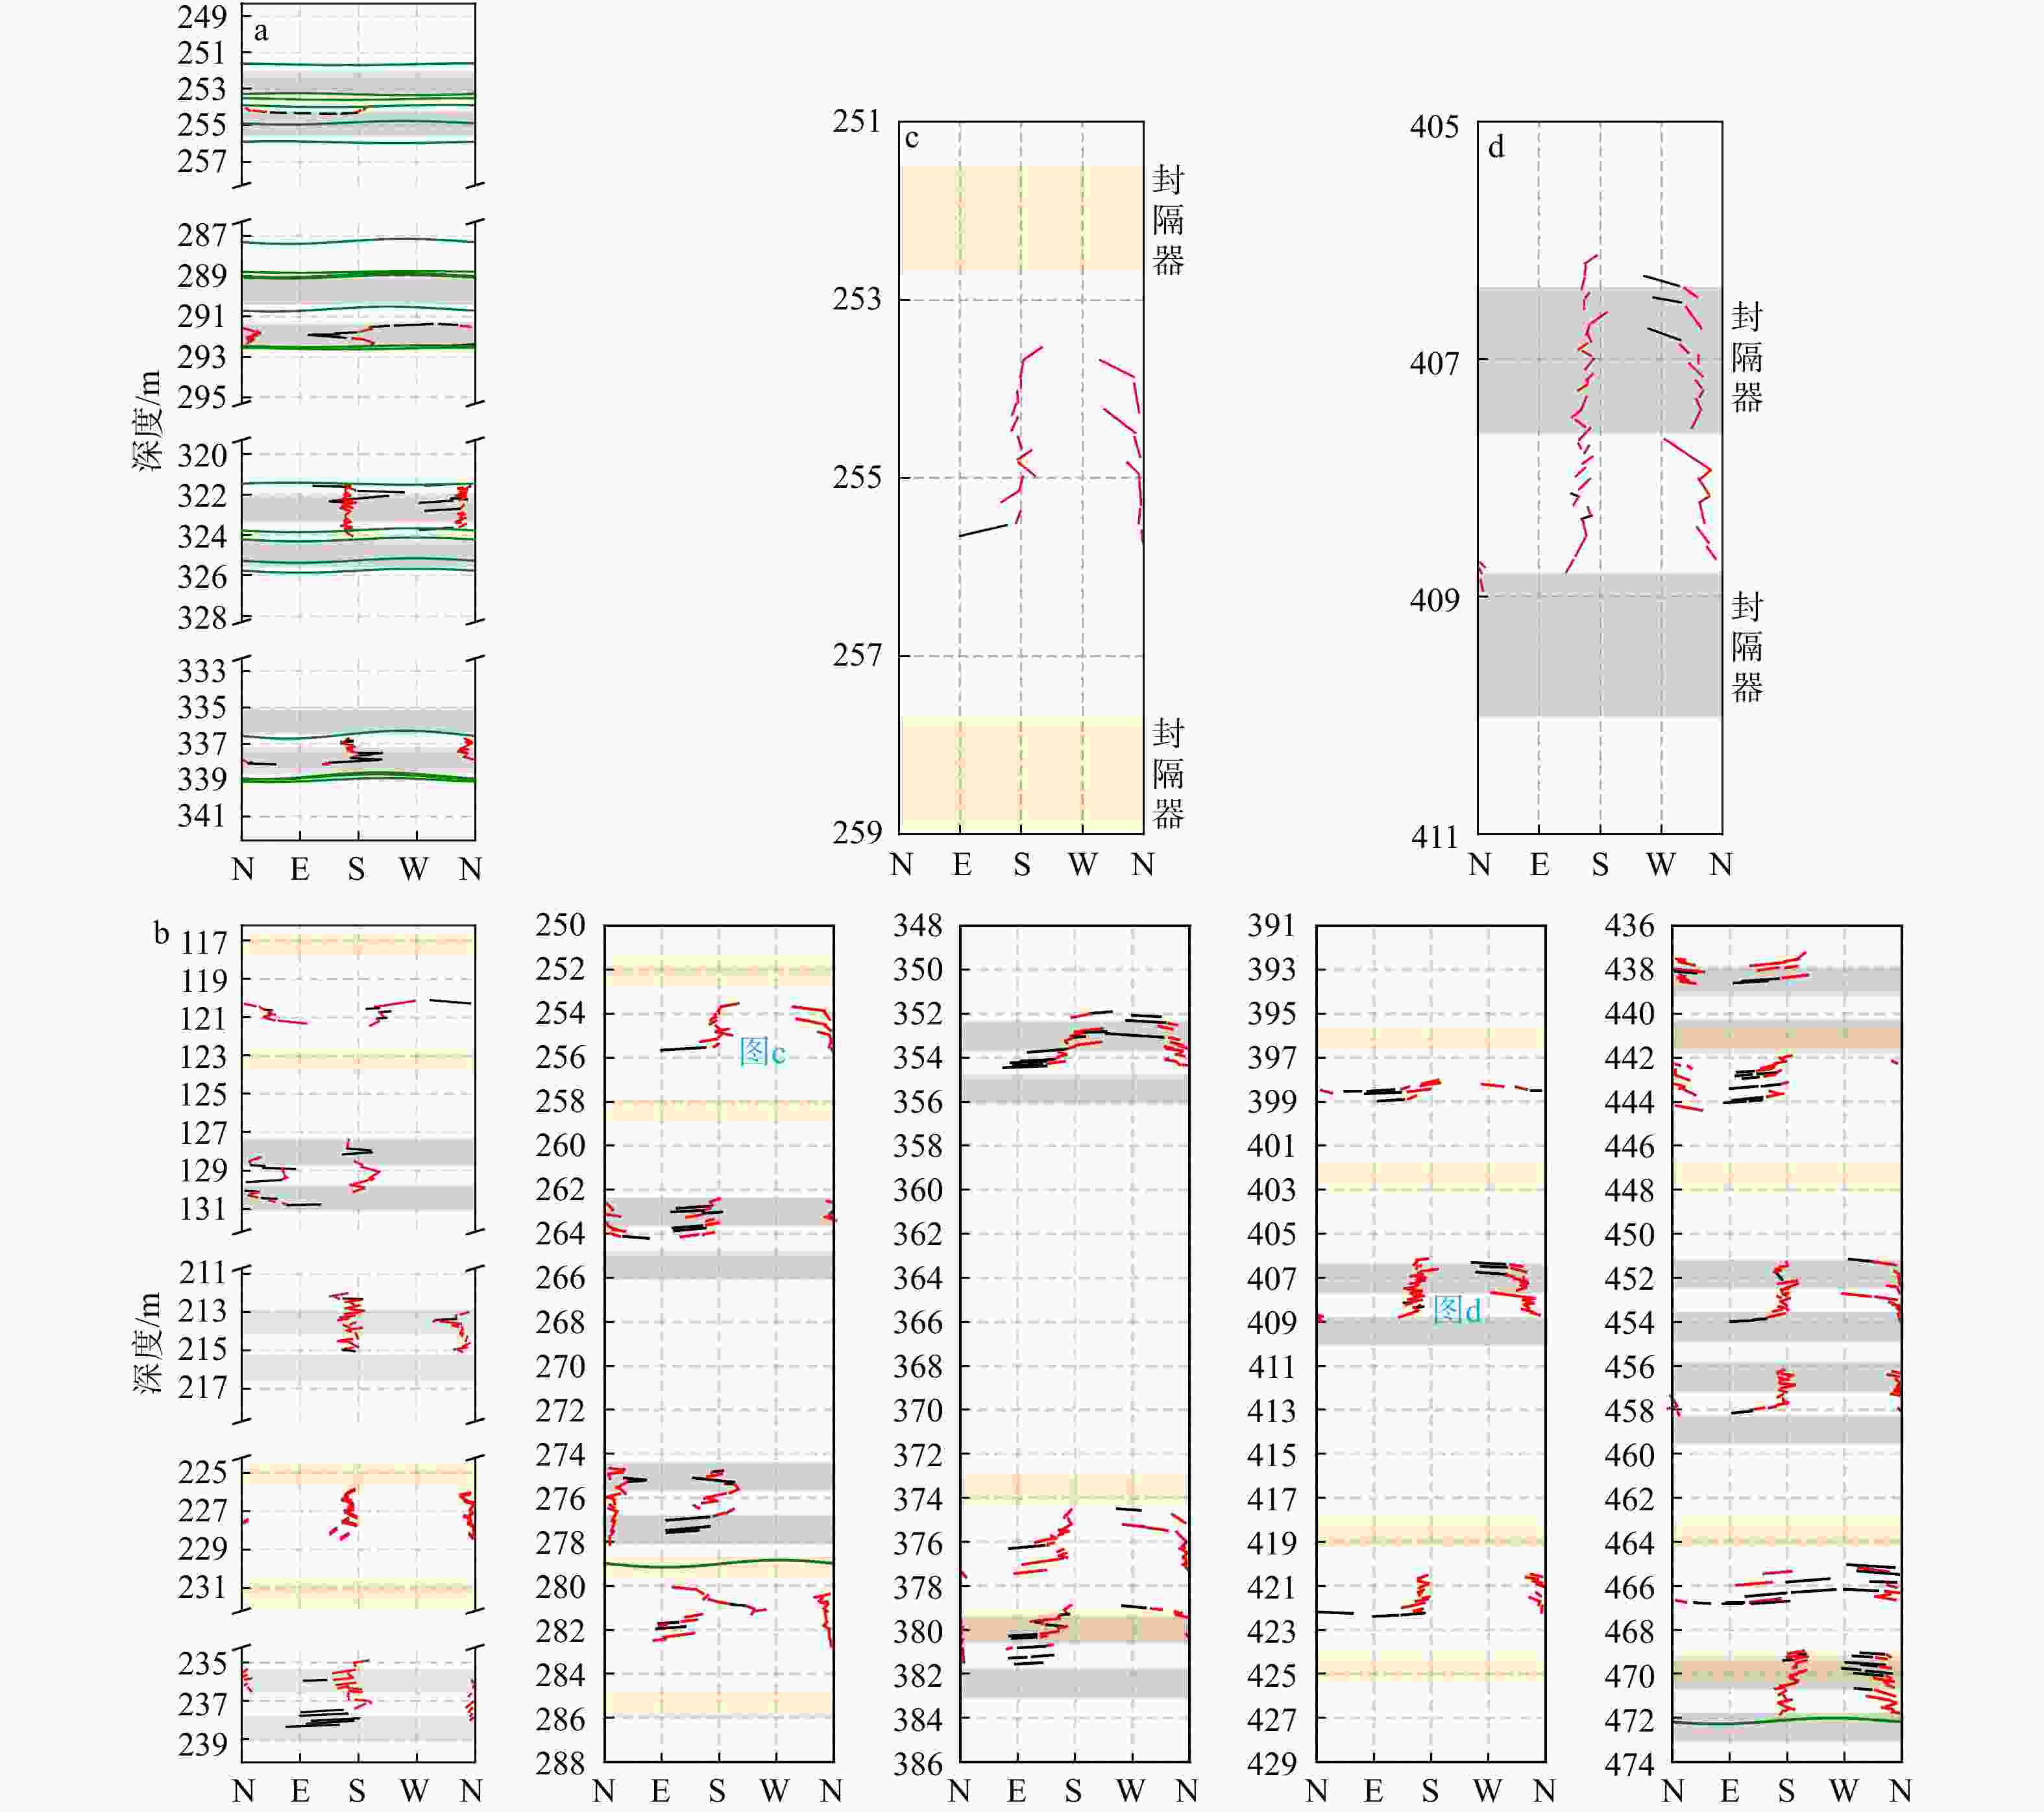
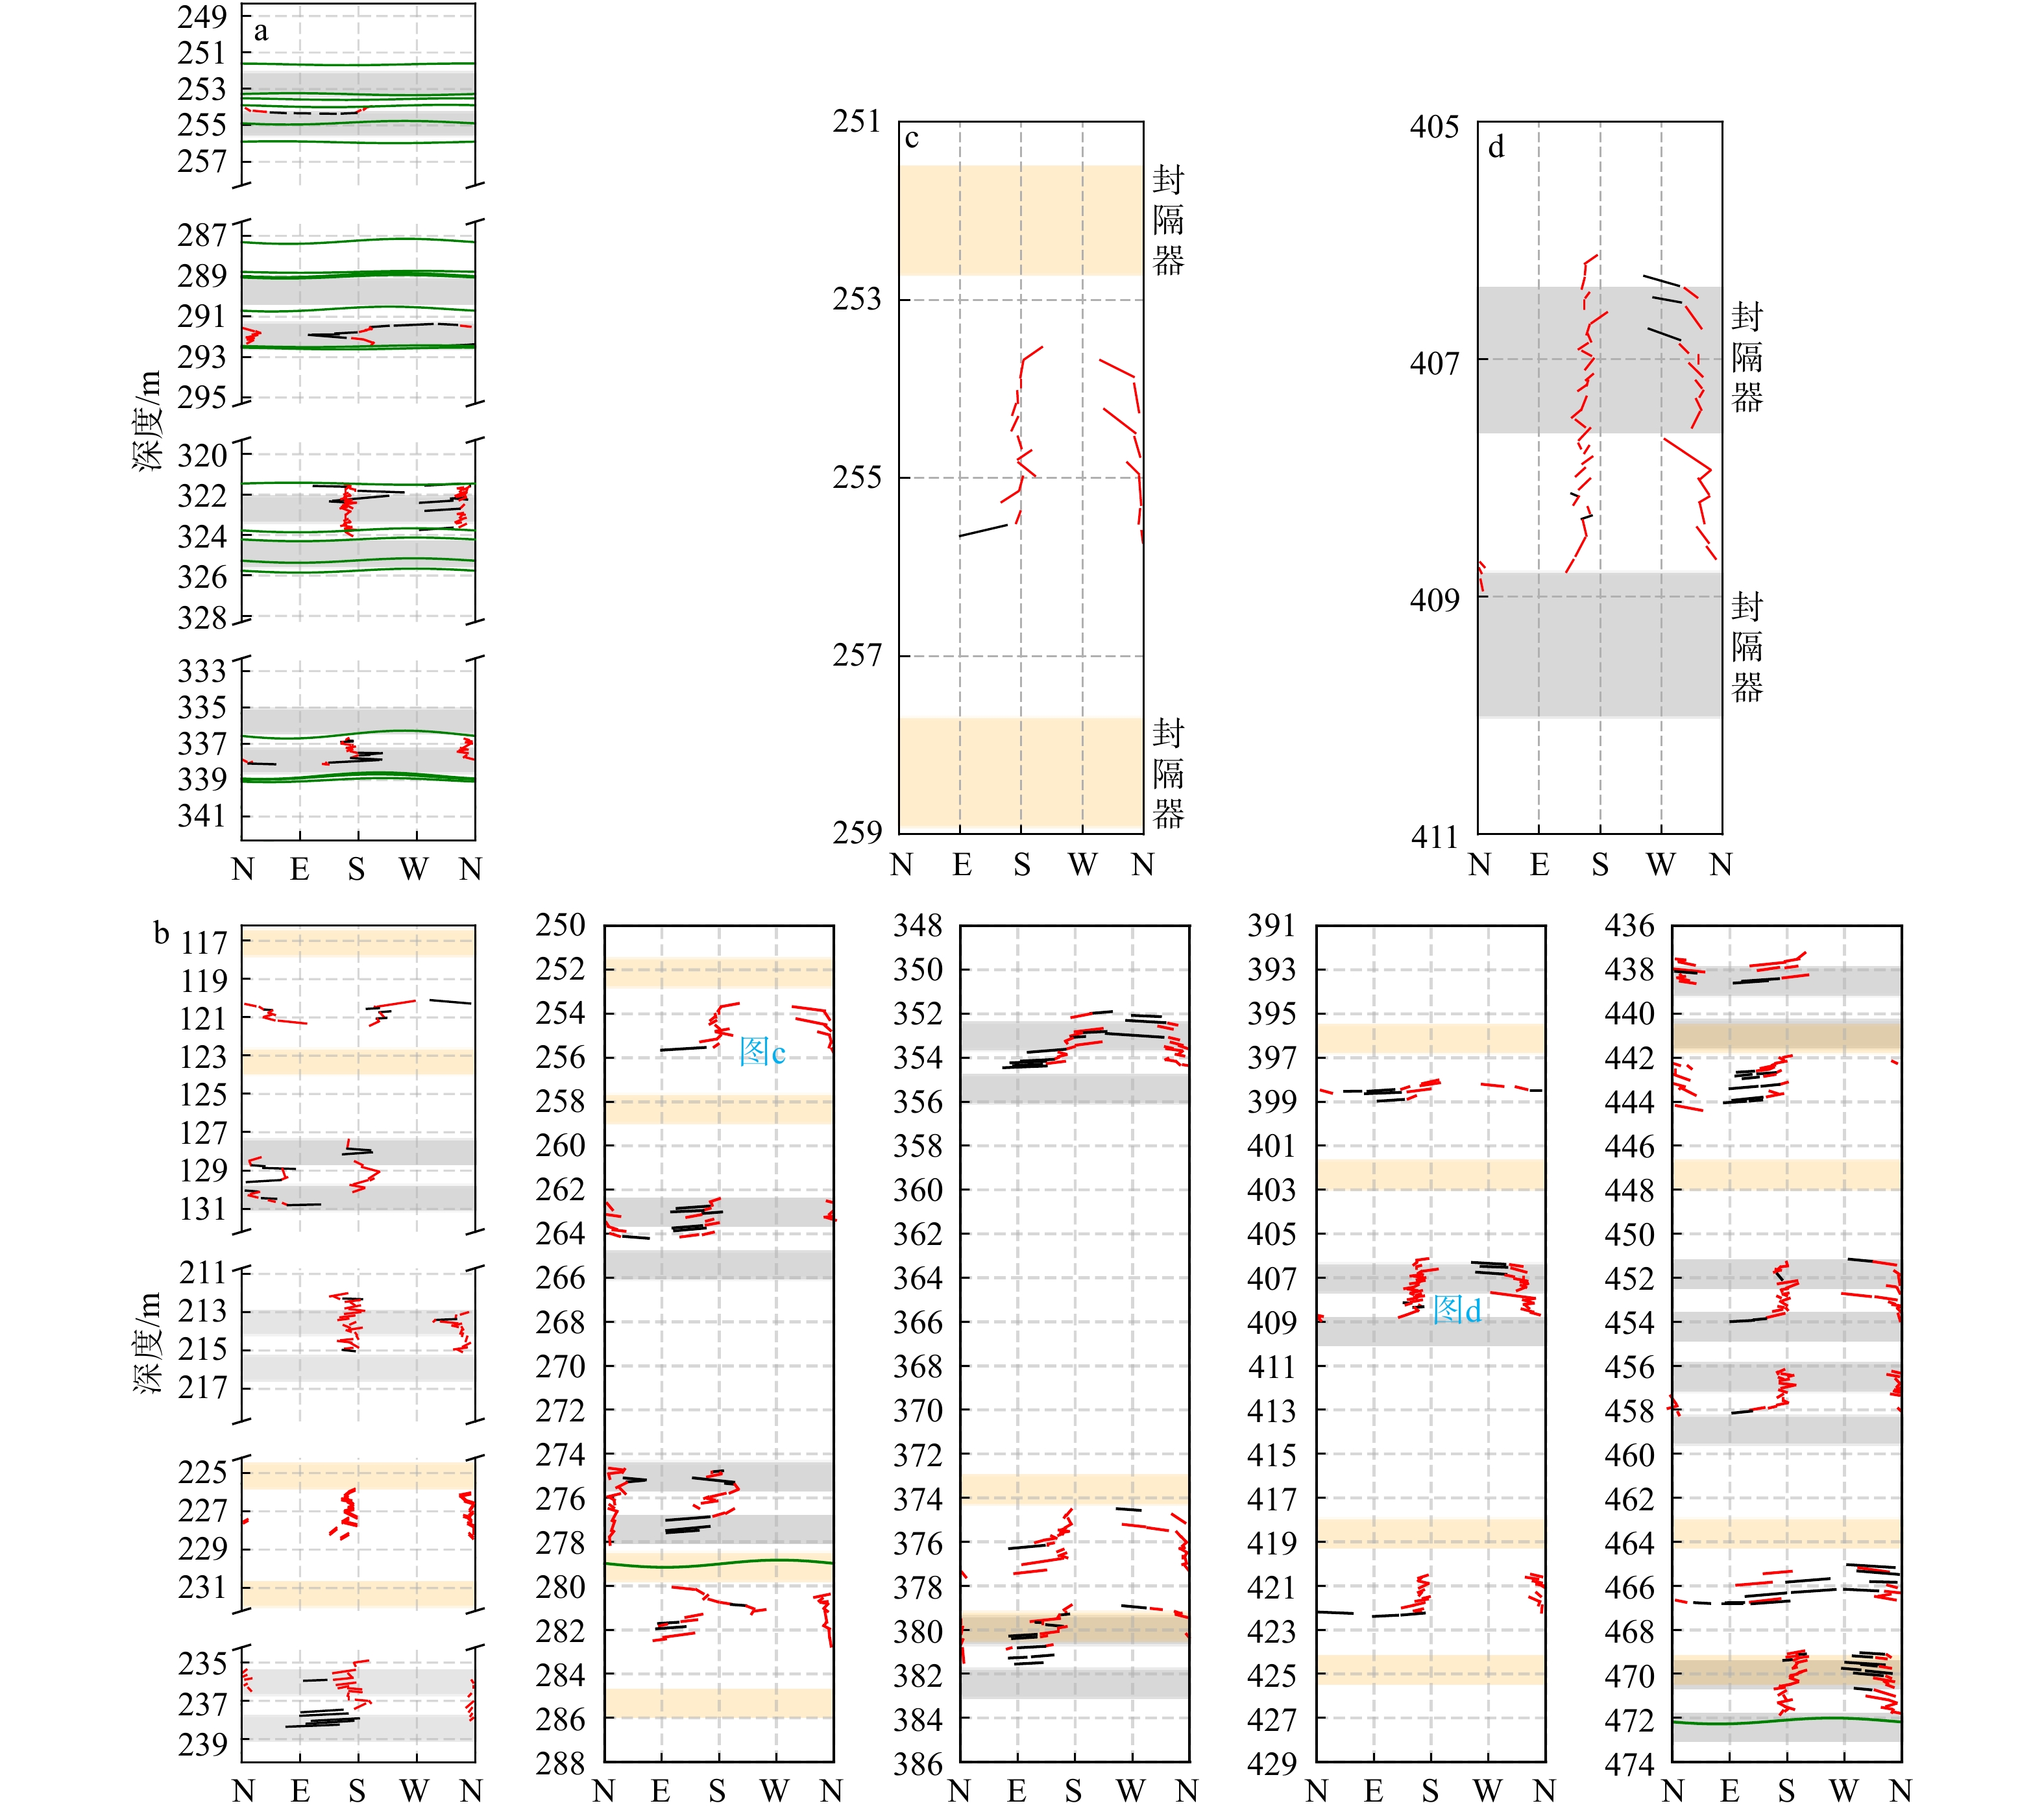
图 4 ZK1和ZK2钻孔全部测段水力裂缝拾取结果
灰色阴影表示水压致裂封隔器位置,黄色阴影为高压压水封隔器位置;红色折线表示倾斜角小于15°的拉伸裂缝,黑色折线为倾斜角大于15°的拉伸裂缝,绿色正弦曲线为天然裂缝a—ZK1钻孔水力裂缝拾取结果;b—ZK2钻孔水力裂缝拾取结果;c—ZK2钻孔高压压水测段水力裂缝拾取结果;d—ZK2钻孔水压致裂测段水力裂缝拾取结果
Figure 4. Hydraulic fracture picks of borehole ZK1 and ZK2
(a) Hydraulic fracture identification results of borehole ZK1; (b) Hydraulic fracture identification results of borehole ZK2; (c) Hydraulic fracture identification results of the high-pressure water test section in borehole ZK2; (d) Hydraulic fracture identification results of the hydraulic fracturing section in borehole ZK2. The gray shaded area indicates the position of the hydraulic fracturing packer, The yellow shaded areas indicate the packer locations for high-pressure water injection. Red polylines indicate tensile fractures with dip angles less than 15°, while black polylines represent those with dip angles greater than 15°, the green sinusoidal curves represent natural fractures
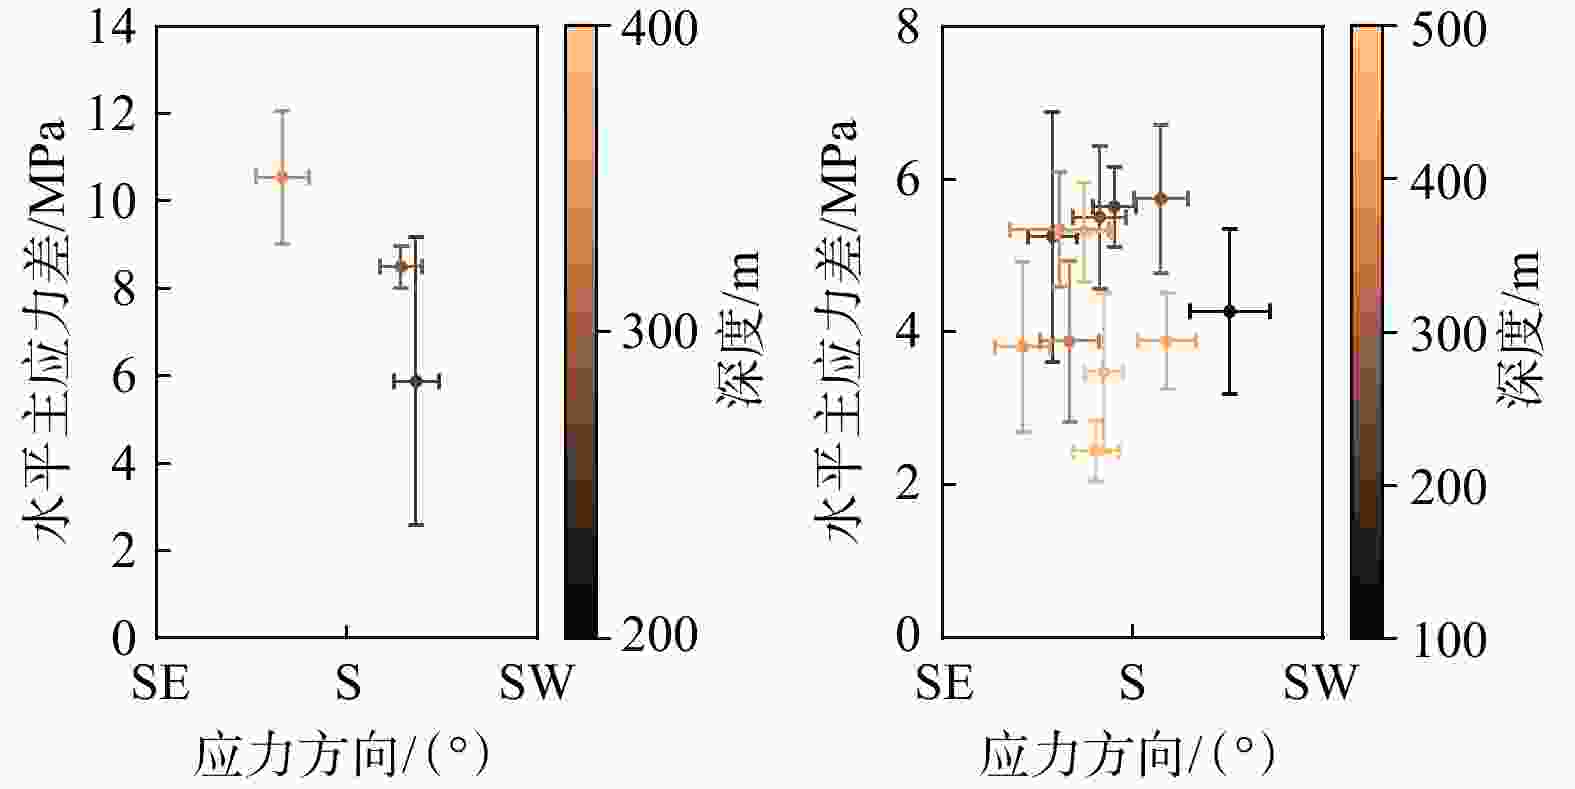
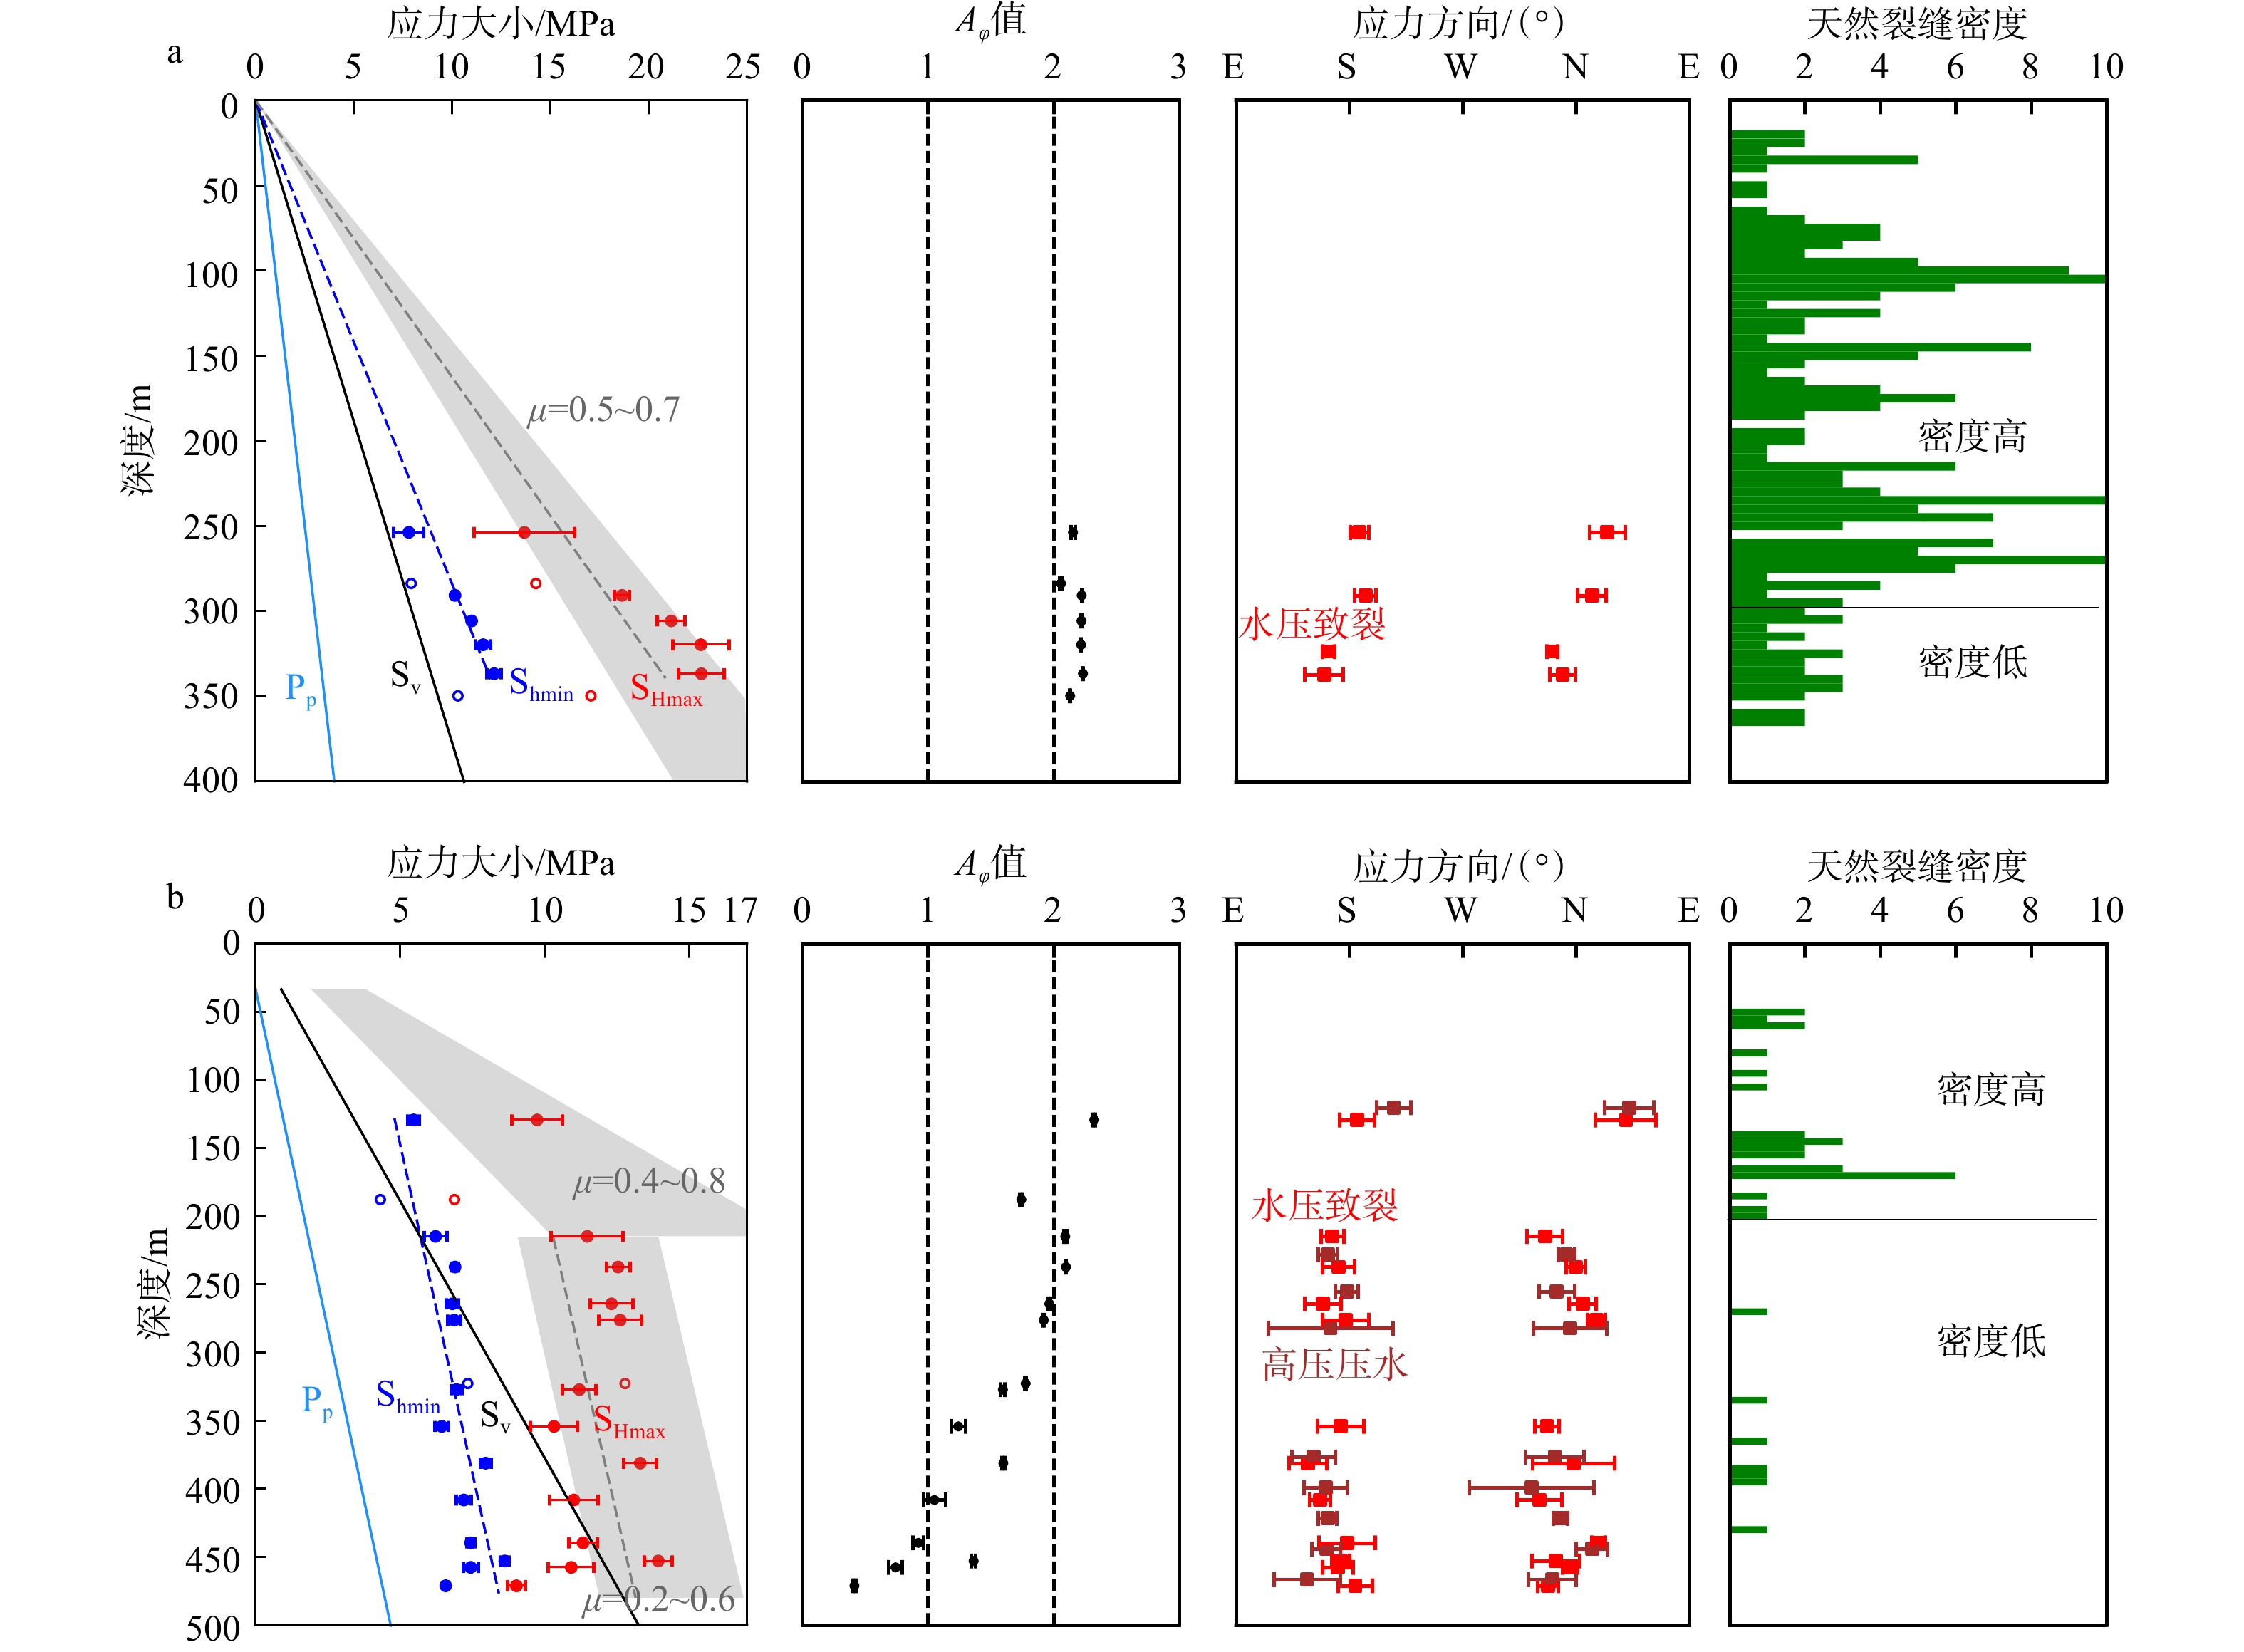
图 5 ZK1和ZK2钻孔应力剖面
应力大小剖面中,空心圆圈表示未观测到水力裂缝的测段,阴影部分为通过公式(4)计算得出的摩擦极限范围,灰色虚线分别为μ = 0.6 (ZK1)、μ = 0.4(ZK2)计算得出的理论最大SHmax;裂缝密度剖面图中实横线用于划分天然裂缝密度相对高低a—ZK1钻孔应力大小剖面、Aφ值剖面、应力方向剖面以及天然裂缝密度剖面;b—ZK2钻孔应力大小剖面、Aφ值剖面、应力方向剖面以及天然裂缝密度剖面
Figure 5. Stress profile of borehole ZK1 and ZK2
(a) Profiles of stress magnitude, Aφ value, stress orientation and natural fracture density for borehole ZK1; (b) Profiles of stress magnitude, Aφ value, stress orientation and natural fracture density for borehole ZK2. In the stress magnitude profiles, open circles represent intervals where no hydraulic fractures were observed. The shaded area denotes the friction limit range calculated by Equation (4). The gray dashed lines represent the theoretical maximum horizontal principal stress SHmax calculated with friction coefficients μ = 0.6 and μ = 0.4, respectively. In the natural fracture density profiles, solid horizontal lines are used to distinguish between relatively high and low natural fracture densities.
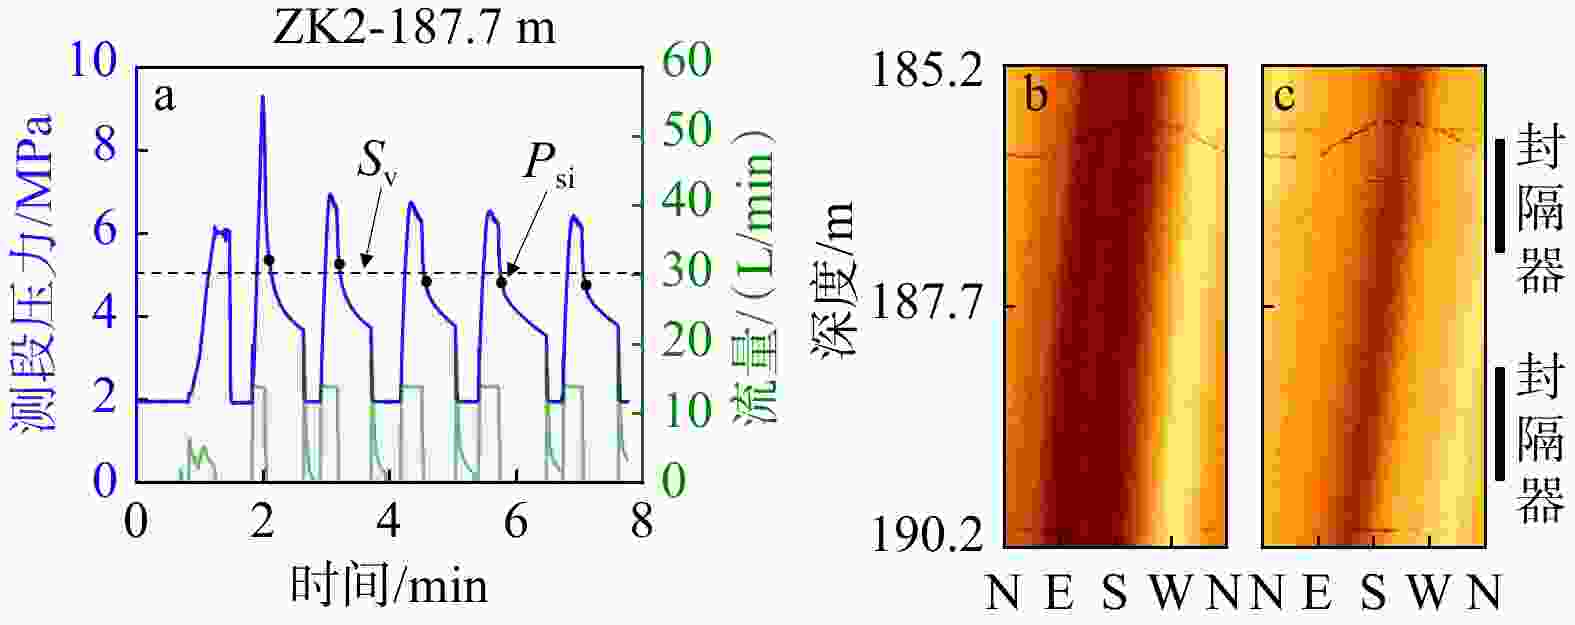
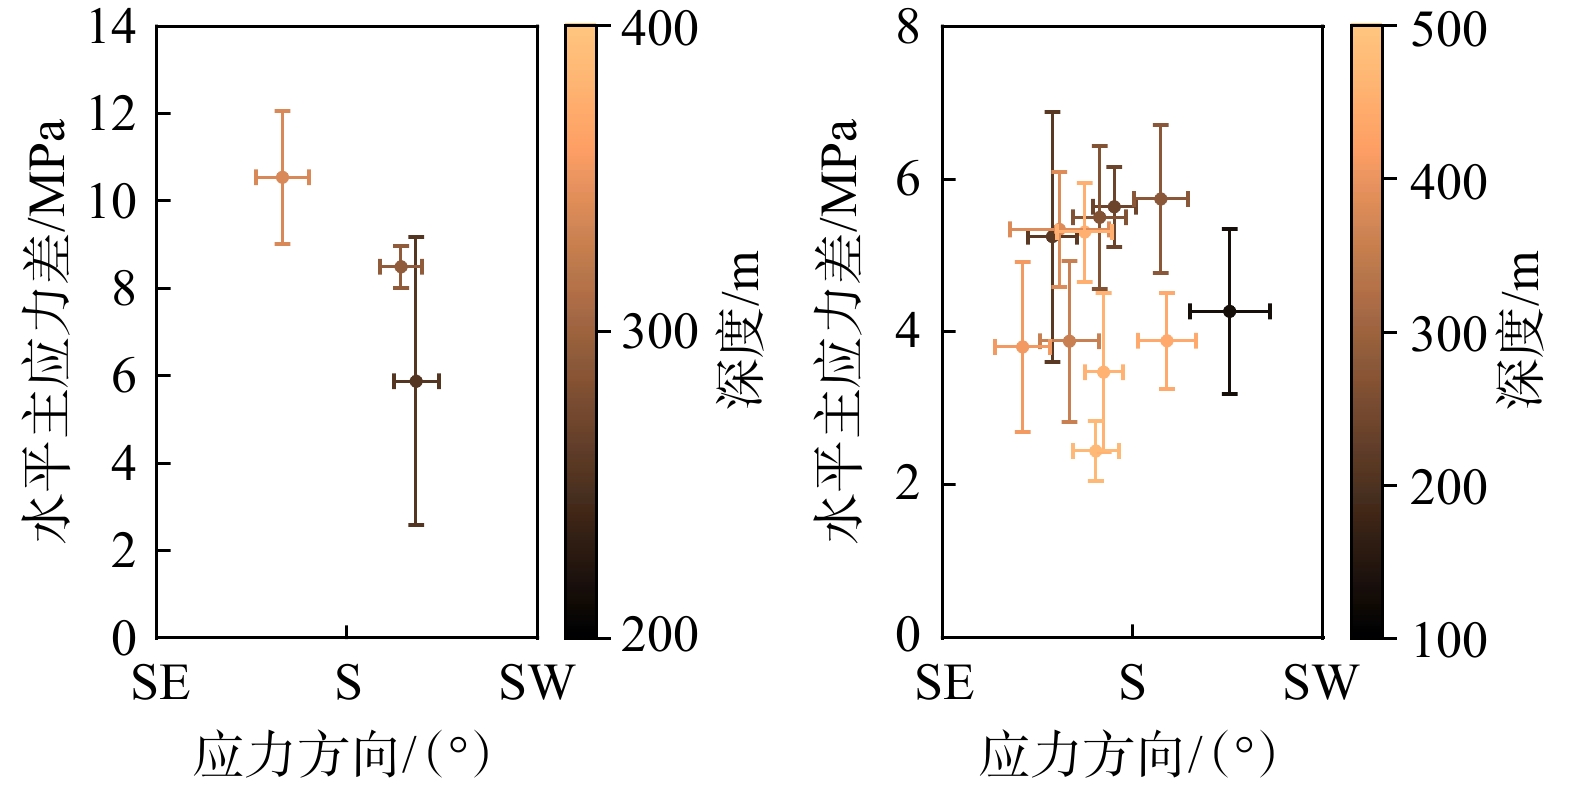
图 6 ZK1、ZK2钻孔水平主应力差和水力裂缝方向的关系
横向误差棒表示水力裂缝方位的均值及标准差,纵向误差棒表示水平主应力差及其均方差a—ZK1钻孔;b—ZK2钻孔
Figure 6. Relationship between horizontal principal stress difference and hydraulic fracture orientation in boreholes ZK1 and ZK2
(a) Relationship between horizontal principal stress difference and hydraulic fracture orientation in borehole ZK1 and ZK2; (b) Relationship between horizontal principal stress difference and hydraulic fracture orientation in borehole ZK2The horizontal error bars represent the mean and standard of the hydraulic fracture azimuths, while the vertical error bars indicate the horizontal principal stress difference and its standard deviation.
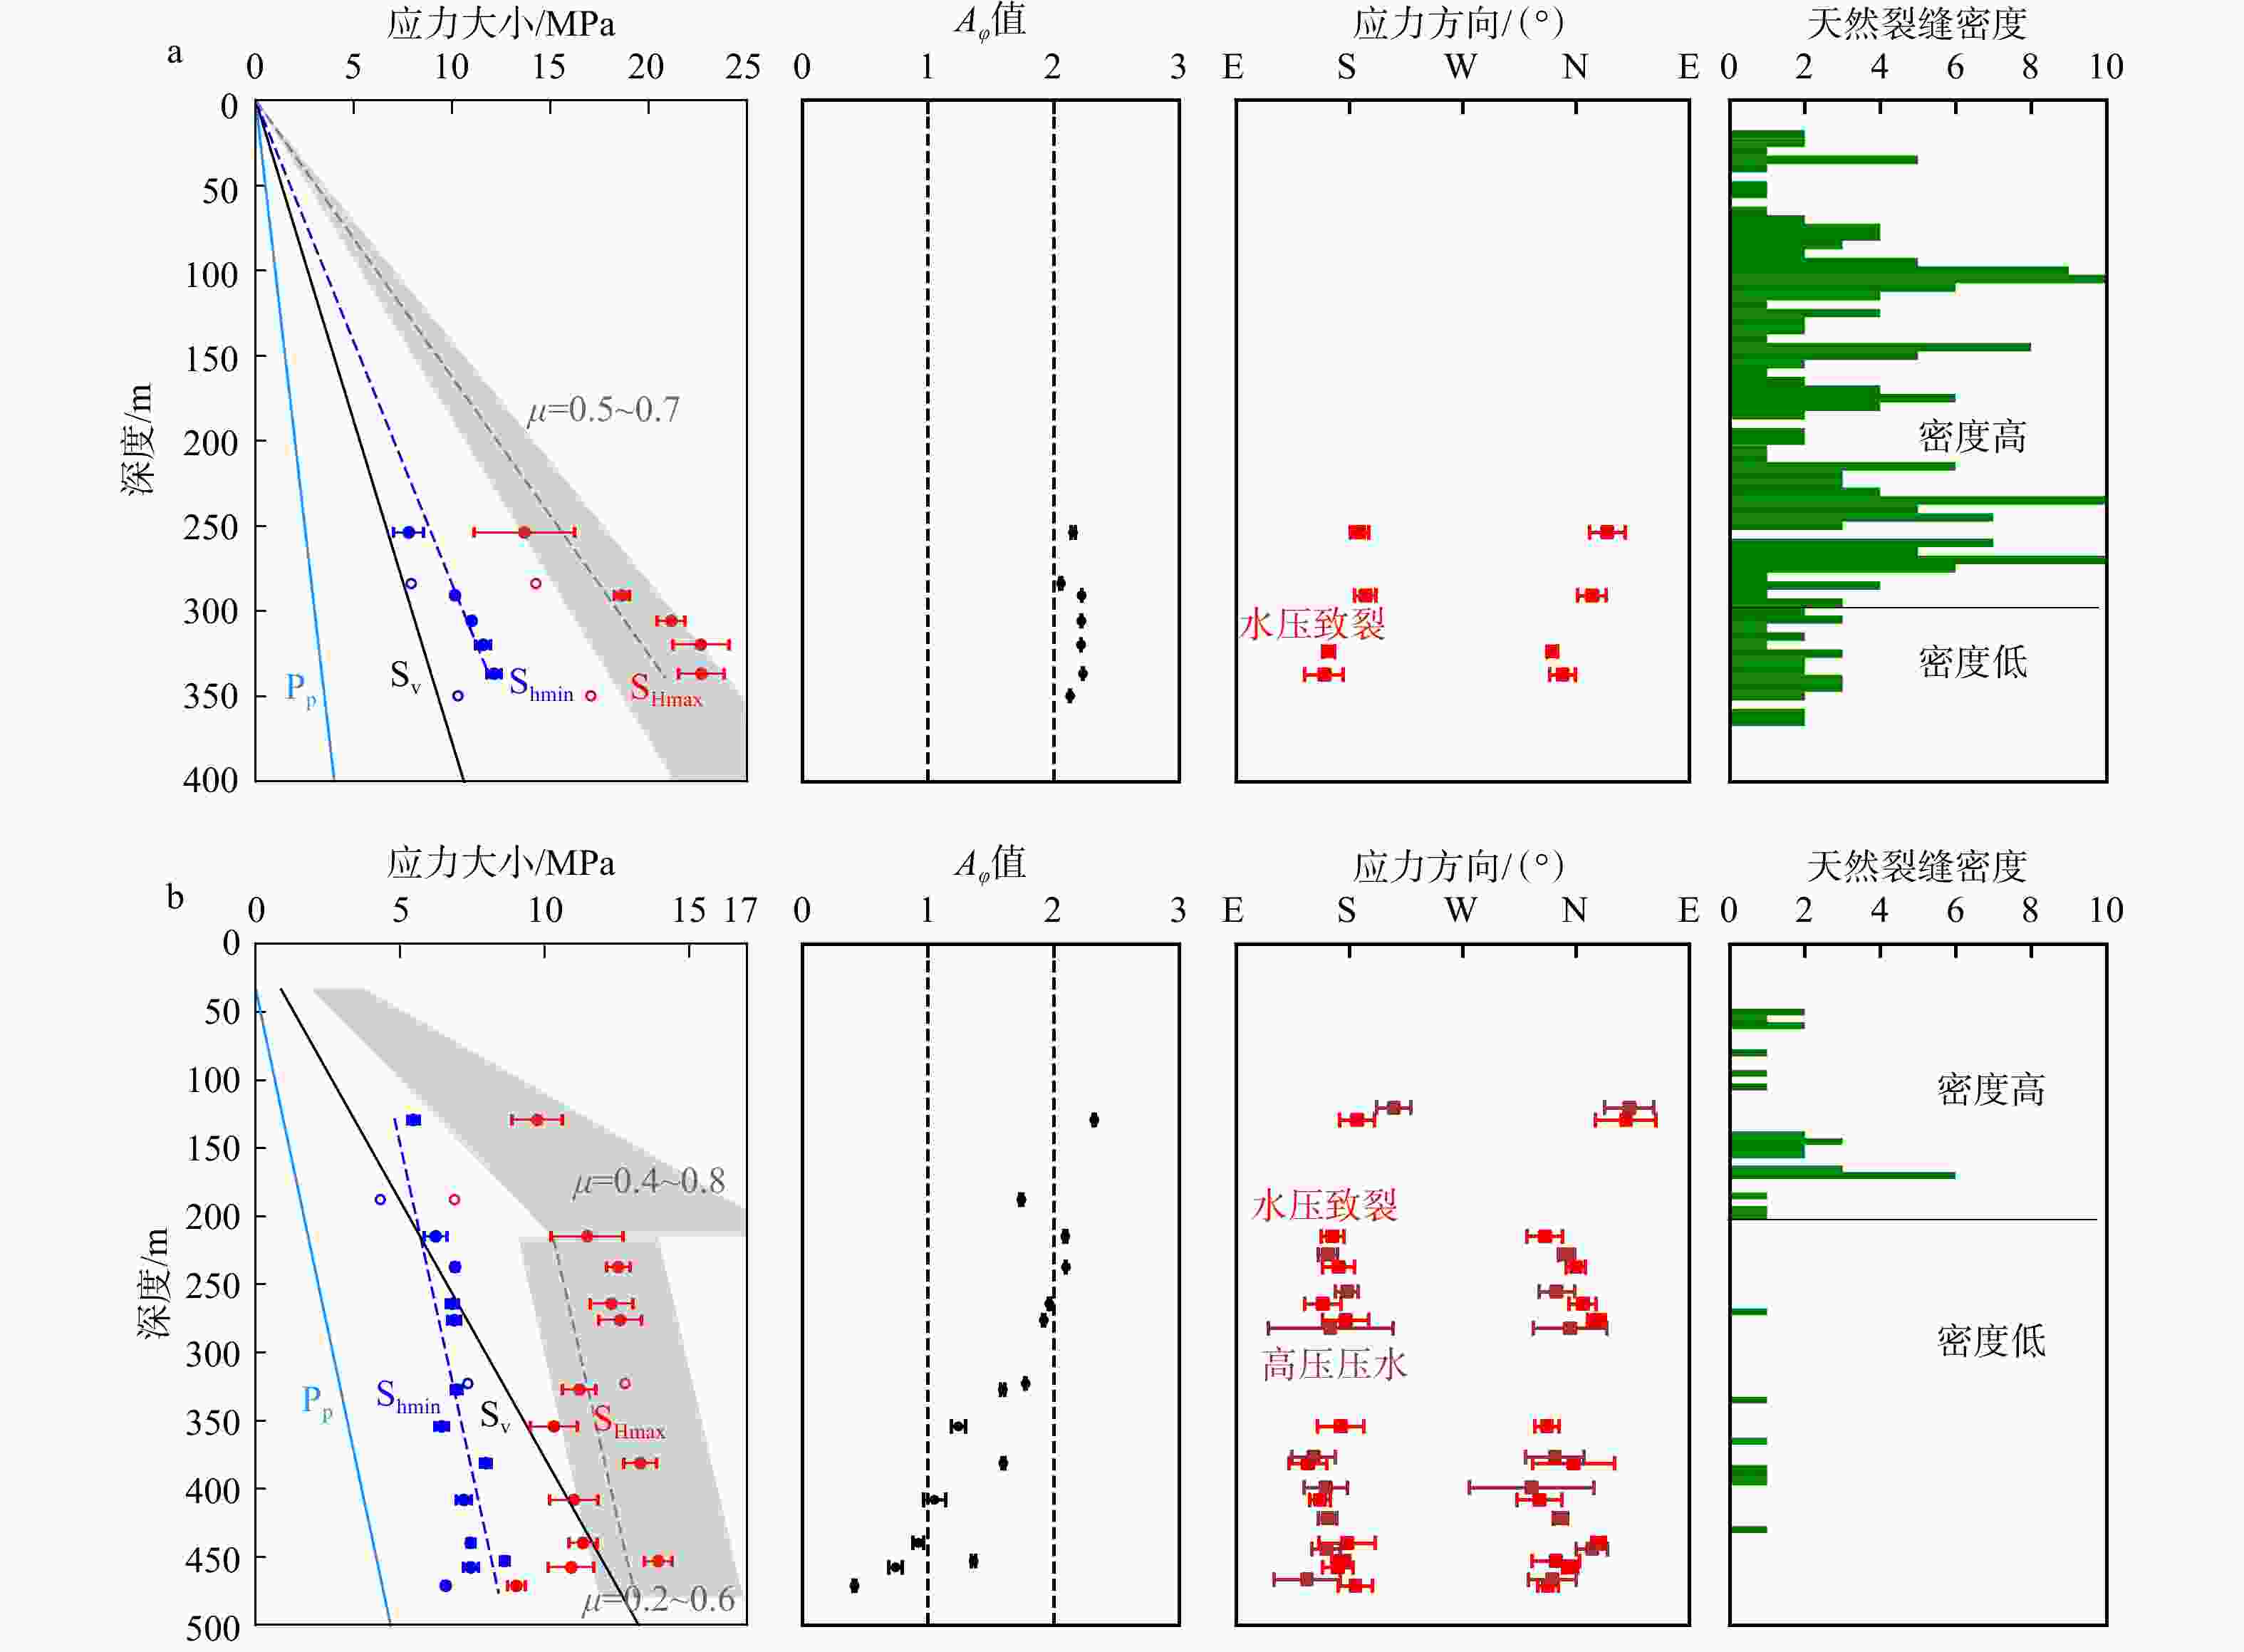
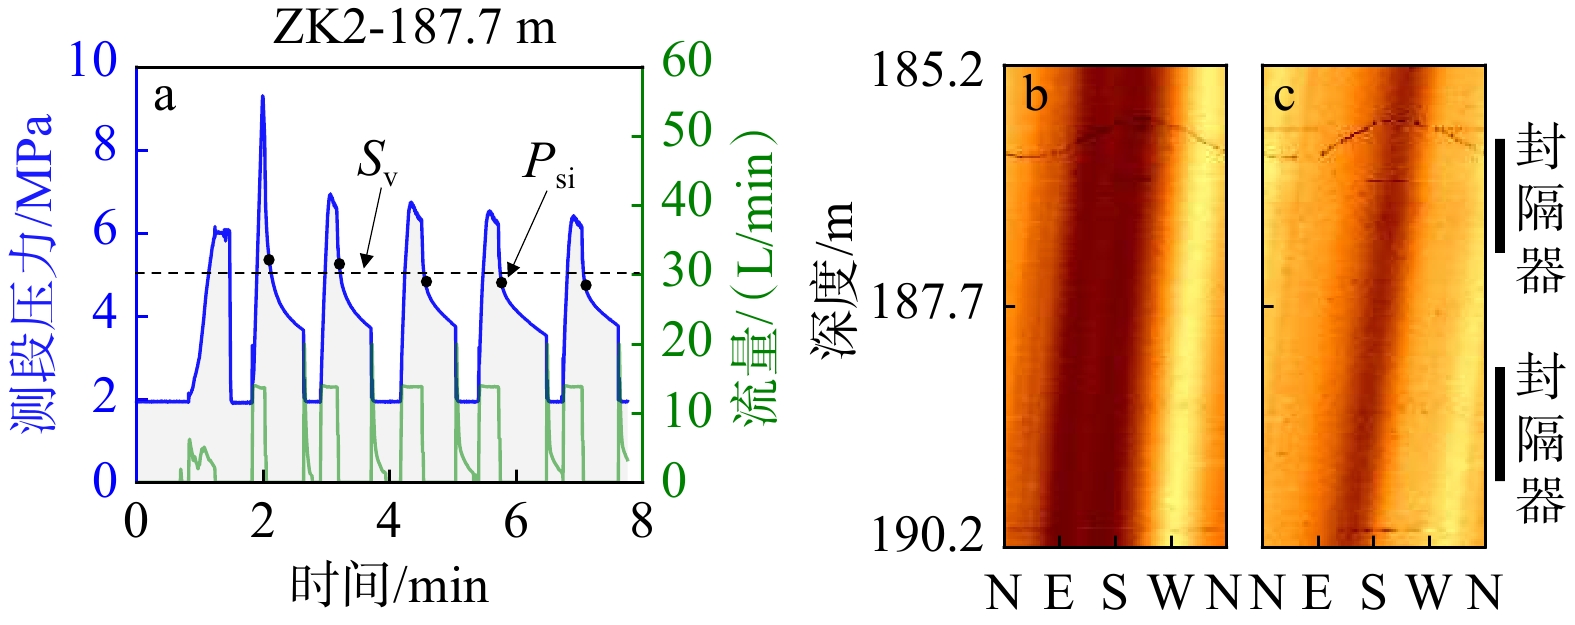
图 7 ZK2钻孔187.7 m测段压裂曲线及其压裂前后振幅图像
a—ZK2钻孔187.7m测段压裂曲线;b—压裂前振幅图像;c—压裂后振幅图像
Figure 7. Pressure curves near the depth of 187.7 m, and amplitude images before and after fracturing of borehole ZK2
(a) Fracturing curve of the 187.7 m section in borehole ZK2; (b) Amplitude image before hydraulic fracturing; (c) Amplitude image after hydraulic fracturing
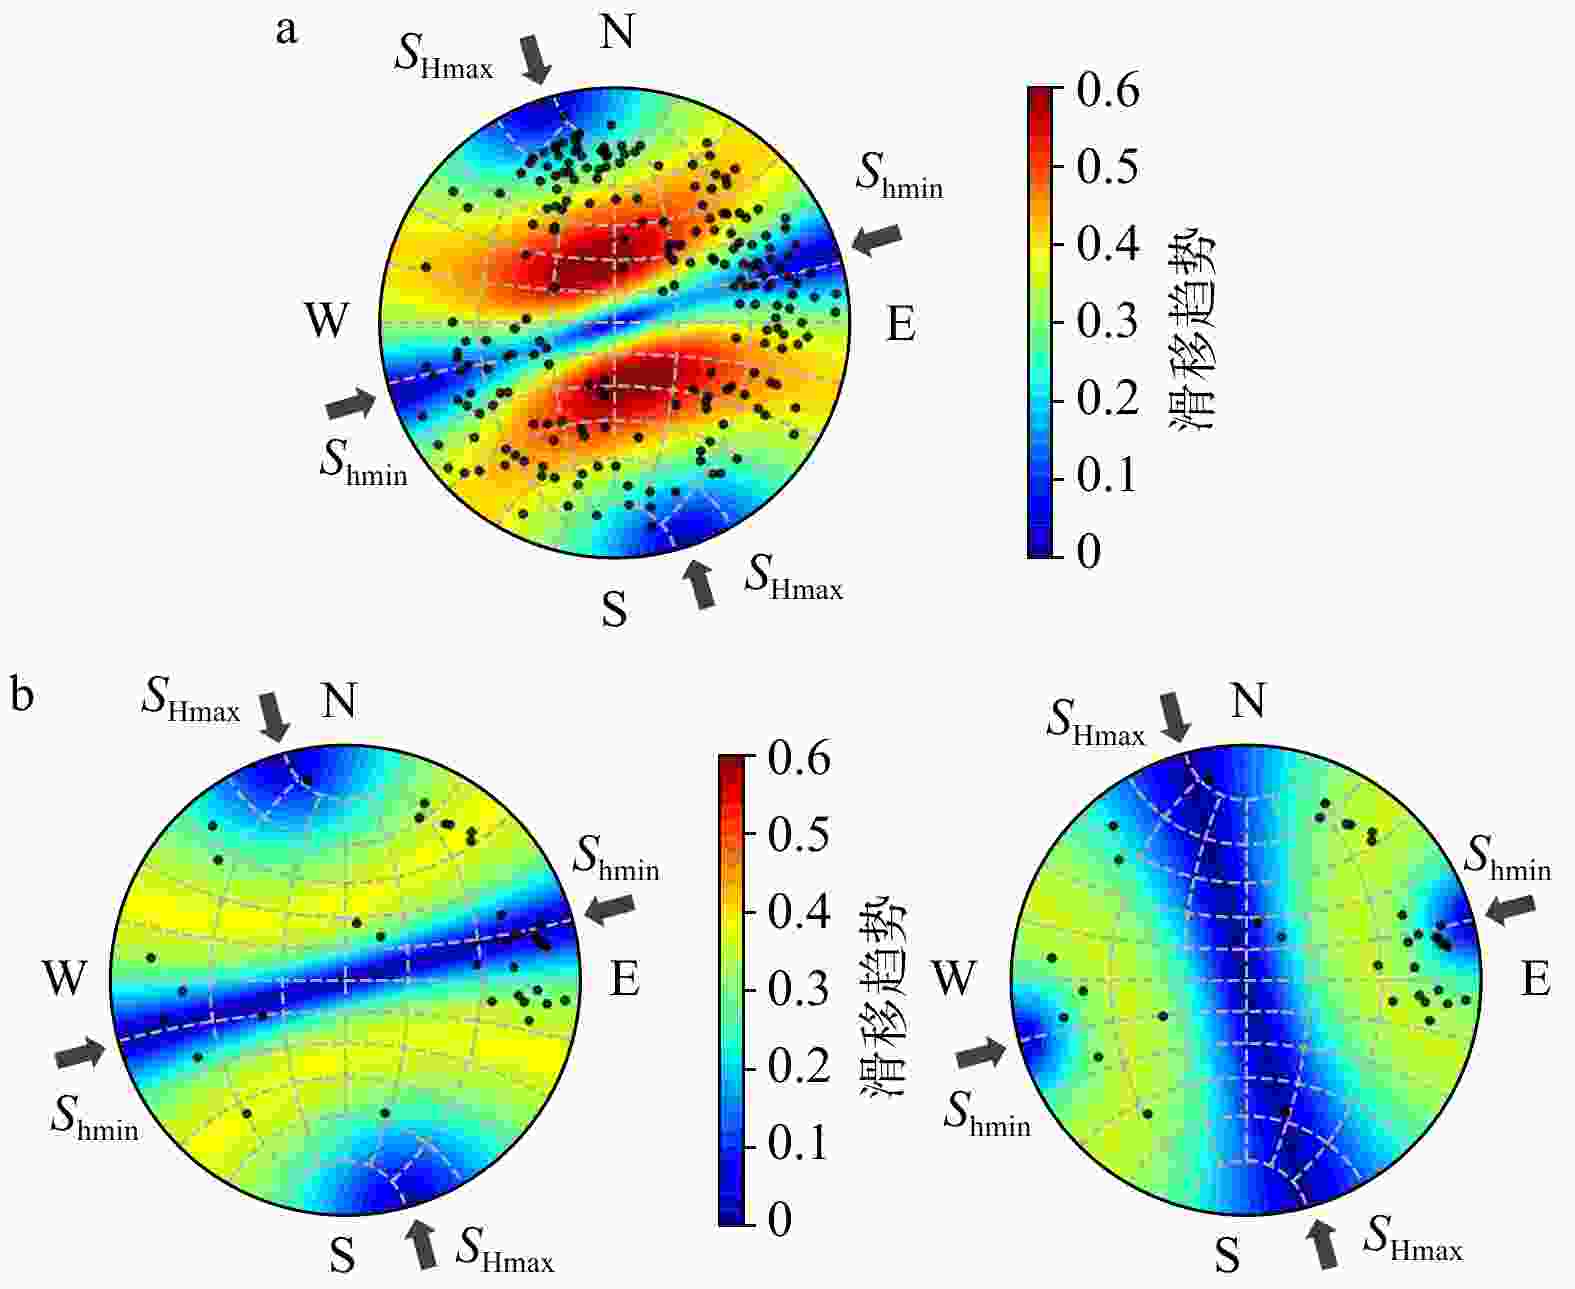
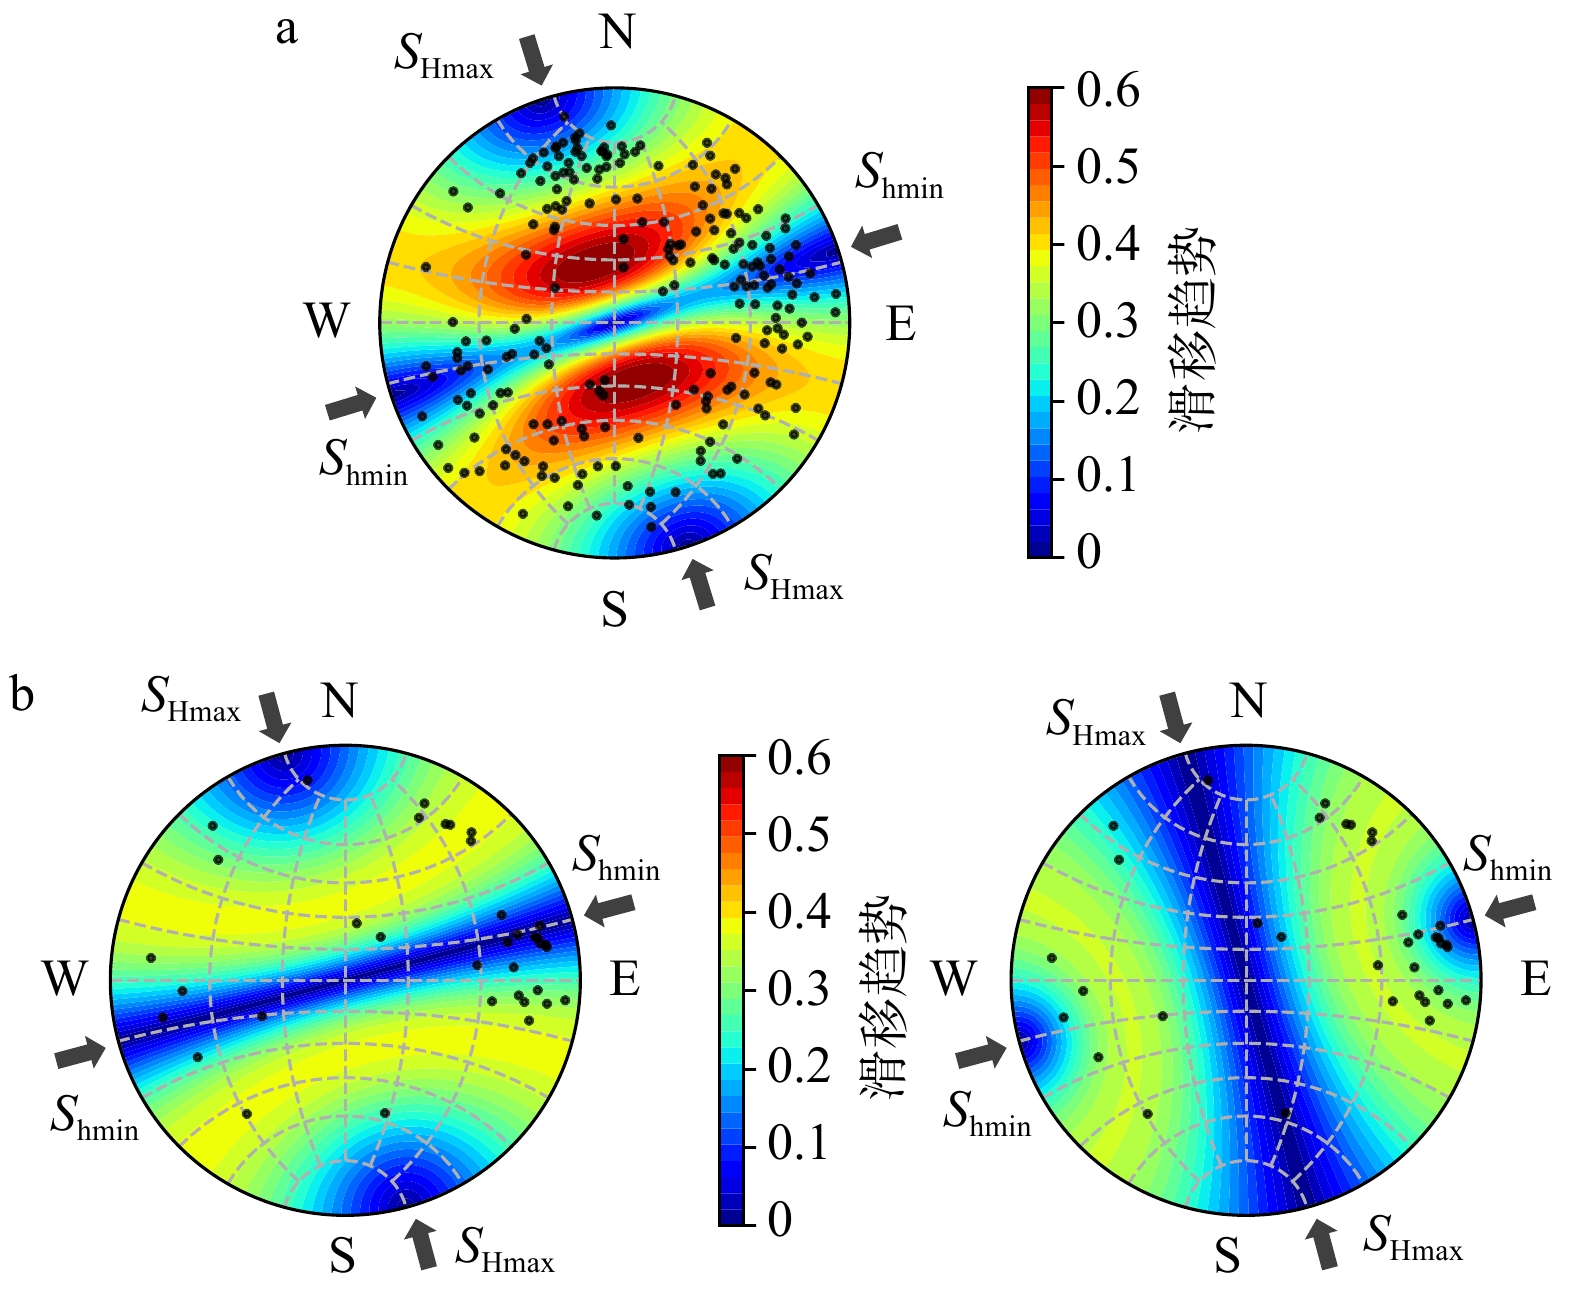
图 8 ZK1和ZK2钻孔天然裂缝滑移趋势
SHmax—最大水平主应力;Shmin—最小水平主应力;黑色散点表示天然裂缝走向和倾角的下球面投影a—ZK1钻孔天然裂缝摩擦滑移趋势;b—ZK2钻孔天然裂缝摩擦滑移趋势(左侧为215.3 m以浅天然裂缝;右侧为215.3 ~ 482.1 m范围内的天然裂缝)
Figure 8. Slip tendency of natural fractures of borehole ZK1 and ZK2
(a) Frictional slip tendency of natural fractures in borehole ZK1; (a) Frictional slip tendency of natural fractures in borehole ZK2. SHmax—maximum horizontal principal stress; Shmin—minimum horizontal principal stress; The black scatter points represent the lower hemisphere projection of the strike and dip of natural fractures; Panel b shows the slip tendency of natural fractures above 215.3 m and within 215.3 ~ 482.1 m in sequence.
表 1 ZK1和ZK2钻孔水压致裂应力测试结果
Table 1. Estimated stress magnitudes and orientations in boreholes ZK1 and ZK2
序号 测段深度/m Pb/MPa Psi/MPa Pr/MPa T/MPa Pp/MPa Shmin/MPa SHmax/MPa Sv/MPa SHmax方向/(°) 均值±均方差 ZK1 1 253.8 16.1 7.8 7.2 8.9 2.5 7.8 13.7 6.7 196.4 ± 5.3 2 283.8 11.7 7.9 6.7 5.1 2.8 7.9 14.3 7.5 未观察到水力裂缝 3 290.8 17.7 10.2 8.9 8.8 2.9 10.2 18.6 7.7 192.9 ± 4.9 4 305.8 18.2 11.0 8.8 9.5 3.1 11.0 21.2 8.1 未观察到水力裂缝 5 319.8 14.9 11.6 8.9 6.0 3.2 11.6 22.7 8.5 未观察到水力裂缝 6 323.8 \ 162.4 ± 2.3 7 336.8 19.3 12.1 10.4 9.0 3.4 12.1 22.7 8.9 164.8 ± 6.3 8 349.8 15.5 10.3 10.3 5.1 3.5 10.3 17.1 9.3 未观察到水力裂缝 ZK2 1 120.2 高压压水测段 218.9 ± 8.3 2 129.2 16.7 5.8 6.0 10.7 1.0 5.8 10.4 3.4 203.0 ± 9.4 3 187.7 9.1 4.7 4.9 4.3 1.6 4.7 7.5 5.0 未观察到水力裂缝 4 201.2 未观察到水力裂缝的高压压水测段 5 214.7 15.7 6.6 5.7 10.0 1.8 6.6 12.1 5.7 161.0 ± 5.8 6 228.2 高压压水测段 167.7 ± 3.5 7 237.2 16.4 7.2 6.5 9.9 2.0 7.2 13.2 6.3 175.7 ± 5.0 8 255.2 高压压水测段 171.5 ± 5.8 9 264.2 16.1 7.1 6.1 10.0 2.3 7.1 12.9 7.0 172.2 ± 6.2 10 276.2 12.6 7.2 5.9 6.7 2.4 7.2 13.3 7.3 186.7 ± 6.3 11 282.2 高压压水测段 170.2 ± 19.6 12 309.2 未观察到水力裂缝的高压压水测段 13 322.7 15.8 7.7 6.7 9.2 2.9 7.7 13.4 8.6 未观察到水力裂缝 14 327.2 21.8 7.3 7.1 14.8 2.9 7.3 11.9 8.7 未观察到水力裂缝 15 331.7 未观察到水力裂缝的高压压水测段 16 354.2 8.6 6.8 6.1 2.5 3.2 6.8 11.0 9.4 165 ± 7.0 17 376.7 高压压水测段 157.5 ± 10.1 18 381.2 8.8 8.1 6.5 2.3 3.5 8.1 14.3 10.1 162.6 ± 11.8 19 399.2 高压压水测段 153.0 ± 16.8 20 408.2 17.3 7.5 7.2 10.2 3.8 7.5 11.7 10.8 154.0 ± 6.5 21 421.7 高压压水测段 165.4 ± 3.2 22 439.7 14.5 7.8 7.3 7.2 4.1 7.8 12.0 11.7 188.1 ± 7.0 23 444.2 高压压水测段 177.3 ± 5.9 24 453.0 16.5 9.9 7.2 9.3 4.2 9.9 18.2 12.0 168.7 ± 6.5 25 457.7 17.1 7.8 7.5 9.6 4.3 7.8 11.6 12.1 173.1 ± 4.5 26 466.7 高压压水测段 153.8 ± 11.4 27 471.2 15.5 6.9 6.7 8.8 4.4 6.9 9.7 12.5 171.3 ± 5.5 注:Pb—破裂压力;Psi—瞬时关闭压力;Pr—裂缝重张压力;Pp—孔隙压力;T—岩石抗拉强度;SHmax—最大水平主应力;Shmin—最小水平主应力;Sv—垂向主应力;ZK1中测段2和8以及ZK2中测段3和13为未观察到水力裂缝且Shmin与Sv差值在1.3 MPa以内的测段;高压压水测段不进行应力大小分析,仅进行应力方向分析  下载: 导出CSV
表 2 天然裂缝滑移趋势所用应力场模型
Table 2. The stress field models used for calculating the shear slip tendency of natural fractures
钻孔 Pp/MPa Shmin/MPa SHmax/MPa Sv/MPa 应力场对应深度/m 应力状态 SHmax方向 ZK1 2.0 6.7 12.4 5.3 200.0 逆冲型 N18°W ZK2 1.8 5.7 10.0 5.7 215.3 逆走滑型 N15°W 4.5 8.5 12.8 12.8 482.1 正走滑型 注:Pp—孔隙压力;SHmax—最大水平主应力;Shmin—最小水平主应力;Sv—垂向主应力。
下载: 导出CSV
-
[1] BARTON C A, ZOBACK M D, MOOS D, 1995. Fluid flow along potentially active faults in crystalline rock[J]. Geology, 23(8): 683-686. doi: 10.1130/0091-7613(1995)023<0683:ffapaf>2.3.co;2 [2] BAUMGÄRTNER J, ZOBACK M D, 1989. Interpretation of hydraulic fracturing pressure-time records using interactive analysis methods[C]//International Journal of Rock Mechanics and Mining Sciences & Geomechanics Abstracts. Pergamon, 26(6): 461-469. [3] BREDEHOEFT J D, WOLFF R G, KEYS W S, et al., 1976. Hydraulic fracturing to determine the regional in situ stress field, Piceance Basin, Colorado[J]. Geological Society of America Bulletin, 87(2): 250-258. doi: 10.1130/0016-7606(1976)87<250:hftdtr>2.0.co;2 [4] BRÖKER K, MA X, ZHANG S, et al., 2024. Constraining the stress field and its variability at the BedrettoLab: Elaborated hydraulic fracture trace analysis[J]. International Journal of Rock Mechanics and Mining Sciences, 178: 105739. doi: 10.1016/j.ijrmms.2024.105739 [5] CAO H, ZHAO Y, SHUAI D, et al., 2024. In-situ stress estimation method based on seismic curvature attributes of HTI medium and its application in the Weiyuan area[J]. Chinese Journal of Geophysics, 67(5): 1970-1986. [6] CHANG C, JO Y, 2015. Heterogeneous in situ stress magnitudes due to the presence of weak natural discontinuities in granitic rocks[J]. Tectonophysics, 664: 83-97. doi: 10.1016/j.tecto.2015.08.044 [7] CHEN Q C, SUN D S, CUI J J, et al. , 2019. In-situ Stress Measurement by Hydraulic Fracturing in Xuefeng Mountain and Its Significance. Journal of Geomechanics, 25(05): 853-865. (in Chinese) [8] DONG S, ZHANG Y, ZHANG F, et al., 2015. Late Jurassic–Early Cretaceous continental convergence and intracontinental orogenesis in East Asia: A synthesis of the Yanshan Revolution[J]. Journal of Asian Earth Sciences, 114: 750-770. doi: 10.1016/j.jseaes.2015.08.011 [9] EVANS K F, CORNET F H, HASHIDA T, et al., 1999. Stress and rock mechanics issues of relevance to HDR/HWR engineered geothermal systems: review of developments during the past 15 years[J]. Geothermics, 28(4-5): 455-474. doi: 10.1016/S0375-6505(99)00023-1 [10] FENG C, GAO G, ZHANG S, et al., 2022. Fault slip potential induced by fluid injection in the Matouying enhanced geothermal system (EGS) field, Tangshan seismic region, North China[J]. Natural Hazards and Earth System Sciences, 22(7): 2257-2287. doi: 10.5194/nhess-22-2257-2022 [11] HAIMSON B C, 1978. The hydrofracturing stress measuring method and recent field results[C]. International Journal of Rock Mechanics and Mining Sciences & Geomechanics Abstracts. Pergamon, 15(4): 167-178. [12] HAIMSON B C, CORNET F H, 2003. ISRM suggested methods for rock stress estimation—part 3: hydraulic fracturing (HF) and/or hydraulic testing of pre-existing fractures (HTPF)[J]. International journal of rock mechanics and mining sciences, 40(7-8): 1011-1020. doi: 10.1016/j.ijrmms.2003.08.002 [13] HAIMSON B, FAIRHURST C, 1967. Initiation and extension of hydraulic fractures in rocks[J]. Society of petroleum engineers journal, 7(03): 310-318. doi: 10.2118/1710-pa [14] HEIDBACH O, RAJABI M, DI GIACOMO D, et al. , 2025. World stress map 2025[J]. [15] KANG Y, YANG X, CHEN X, et al., 2008. Inversion of Stress Field in Guangdong and Its Adjacent Areas[J]. Acta Seismologica Sinica, (01): 59-66+105. (in Chinese) [16] KUANG W H, ZHANG J, YE X W, et al., 2025. Study on Regional Stress Field in Guangdong and Adjacent Areas Based on Relative Focal Mechanism Solution Inversion Method[J]. Chinese Journal of Geophysics, 68(4): 1258-1270. (in Chinese) [17] LAI J, SU Y, DANG W L, et al., 2025. Logging evaluation technology of reservoir fractures[J]. Acta Petrolei Sinica, 46(11): 2187-2210. (in Chinese) [18] LEE M Y, HAIMSON B C, 1989. Statistical evaluation of hydraulic fracturing stress measurement parameters[C]//International Journal of Rock Mechanics and Mining Sciences & Geomechanics Abstracts. Pergamon, 26(6): 447-456. [19] LIAO X, LYU G J, CHEN S K, et al., 2024. Study on distribution characteristics and influencing factors of the in-situ stress field in the Gongjue area, eastern Tibet[J]. Progress in Geophysics, 39(3): 938-950. [20] LI C, WANG Z, LÜ Q, et al., 2021. Mesozoic tectonic evolution of the eastern South China Block: A review on the synthesis of the regional deformation and magmatism[J]. Ore Geology Reviews, 131: 104028. doi: 10.1016/j.oregeorev.2021.104028 [21] LI J, DONG S, CAWOOD P A, et al., 2018. An Andean-type retro-arc foreland system beneath northwest South China revealed by SINOPROBE profiling[J]. Earth and Planetary Science Letters, 490: 170-179. doi: 10.1016/j.epsl.2018.03.008 [22] LIU Y, WANG L, LUO Y, et al., 2024. Logging identification of reservoir types of Maokou Formation carbonate rocks in central Sichuan Basin[J]. Geophysical and Geochemical Exploration, 48(03): 629-639. (in Chinese) [23] LUNDSTERN J E, ZOBACK M D, 2020. Multiscale variations of the crustal stress field throughout North America[J]. Nature communications, 11(1): 1951. doi: 10.1038/s41467-020-15841-5 [24] MA T S, ZHANG D Y, LU D Y, et al., 2024. Progress and development direction of intelligent prediction technology of geomechanical parameters[J]. Petroleum Science Bulletin, 9(3): 365-382 [25] MA X D, 2025. How do borehole observations characterize crustal stress?[J]. Journal of Geomechanics, 31(6): 1146-1158 [26] MENG W, GUO C B, ZHANG C Y, et al. , 2017. In-situ Stress Measurement and Its Significance in the Lhasa Block of the Qinghai-Tibet Plateau. Chinese Journal of Geophysics, 60(6): 2159-2171. (in Chinese) [27] MOECK I, KWIATEK G, ZIMMERMANN G, 2009. Slip tendency analysis, fault reactivation potential and induced seismicity in a deep geothermal reservoir[J]. Journal of Structural Geology, 31(10): 1174-1182. doi: 10.1016/j.jsg.2009.06.012 [28] MORRIS A, FERRILL D A, HENDERSON D B, 1996. Slip-tendency analysis and fault reactivation[J]. Geology, 24(3): 275-278. doi: 10.1130/0091-7613(1996)024<0275:staafr>2.3.co;2 [29] QIN X H, CHEN Q C, MENG W, et al. , 2023. Characteristics of the Present-day In-situ Stress Field in the Tongmai-Bomi Section on the Northern Margin of the Eastern Himalayan Syntaxis. Acta Geologica Sinica, 97(07): 2126-2140. (in Chinese) [30] RUMMEL F, 1987. Fracture mechanics approach to hydraulic fracturing stress measurements[J]. Fracture mechanics of rock, 217: 221-245. doi: 10.1016/b978-0-12-066266-1.50011-9 [31] SCHMITT D R, HAIMSON B, 2017. Hydraulic fracturing stress measurements in deep holes[M]//Rock Mechanics and Engineering Volume 1. CRC Press, 183-225. [32] SIMPSON R W, 1997. Quantifying Anderson's fault types[J]. Journal of Geophysical Research: Solid Earth, 102(B8): 17909-17919. doi: 10.1029/97JB01274 [33] SU S R, 2002. Influence of Fault Structures on In-situ Stress Fields and Their Engineering Significance. Chinese Journal of Rock Mechanics and Engineering, 21(2): 296. (in Chinese) [34] TOWNEND J, ZOBACK M D, 2000. How faulting keeps the crust strong[J]. Geology, 28(5): 399-402. doi: 10.1130/0091-7613(2000)28<399:HFKTCS>2.0.CO;2 [35] WANG C H, LI W, 2025. Major advances and prospects in in-situ stress measurement and estimation methods over the past 10 years (2014–2025)[J]. Journal of Geomechanics, 31(6): 1188-1209 [36] WEN Z G, WANG Z S, YANG M L, 2001. Simulation and Calculation of Modern Tectonic Stress Field in Guangdong Region. South China Journal of Seismology, (03): 29-36. (in Chinese) [37] YANG S X, YAO R, CUI X F, et al. , 2012. Analysis of In-Situ Stress Characteristics in Mainland China and Its Active Blocks and North-South Seismic Belt. Chinese Journal of Geophysics, 55(12): 4207-4217. (in Chinese) [38] YANG Y, SUN D, MA X, et al., 2025. A total system stiffness approach for determining shut-in pressure in hydraulic fracturing stress measurements[J]. International Journal of Rock Mechanics and Mining Sciences, 192: 106160. doi: 10.1016/j.ijrmms.2025.106160 [39] ZEMANEK J, CALDWELL R L, GLENN JR E E, et al., 1969. The borehole televiewer - a new logging concept for fracture location and other types of borehole inspection[J]. Journal of Petroleum Technology, 21(06): 762-774. doi: 10.2118/2402-pa [40] ZHANG M, GE S, YANG Q, et al., 2021. Impoundment‐associated hydro‐mechanical changes and regional seismicity near the Xiluodu reservoir, Southwestern China[J]. Journal of Geophysical Research: Solid Earth, 126(9): e2020JB021590. doi: 10.1029/2020JB021590 [41] ZHANG S, MA X, ZOBACK M, 2023. Determination of the crustal friction and state of stress in deep boreholes using hydrologic indicators[J]. Rock Mechanics Bulletin, 2(1): 100024. doi: 10.1016/j.rockmb.2022.100024 [42] ZOBACK M D, 2007. Reservoir geomechanics, Cambridge University Press, Cambridge, UK[J]. [43] ZOBACK M D, TOWNEND J, 2001. Implications of hydrostatic pore pressures and high crustal strength for the deformation of intraplate lithosphere[J]. Tectonophysics, 336(1-4): 19-30. doi: 10.1016/S0040-1951(01)00091-9 [44] 曹欢, 赵杨, 帅达, 等, 2024. 基于HTI介质地震曲率属性的地应力估算方法及其在威远地区的应用[J]. 地球物理学报, 67(05): 1970-1986. [45] 陈群策, 孙东生, 崔建军, 等, 2019. 雪峰山深孔水压致裂地应力测量及其意义[J]. 地质力学学报, 25(5): 853-865. [46] 赖锦, 苏洋, 党文乐, 等, 2025. 储层裂缝测井评价技术[J]. 石油学报, 46(11): 2187-2210. [47] 廖昕, 吕改杰, 陈仕阔, 等, 2024. 藏东贡觉地区地应力场分布特征及影响因素研究[J]. 地球物理学进展, 39(03): 938-950. doi: 10.6038/pg2024HH0255 [48] 刘宇, 王亮, 罗洋, 等, 2024. 川中地区茅口组碳酸盐岩储层类型测井识别[J]. 物探与化探, 48(03): 629-639. [49] 蒋维强, 林纪曾, 赵毅, 等, 1992. 华南地区的小震震源机制与构造应力场[J]. 中国地震, (01): 38-44. [50] 康英, 杨选, 陈杏, 等, 2008. 广东及邻区的应力场反演[J]. 地震学报, (01): 59-66+105. doi: 10.3321/j.issn:0253-3782.2008.01.006 [51] 况文欢, 张捷, 叶秀薇, 等, 2025. 基于相对震源机制解反演方法的广东及邻区区域应力场研究[J]. 地球物理学报, 68(4): 1258-1270. doi: 10.6038/cjg2023R0347 [52] 马天寿, 张东洋, 陆灯云, 等, 2024. 地质力学参数智能预测技术进展与发展方向[J]. 石油科学通报, 9(3): 365-382 [53] 马晓冬, 2025. “一孔之见”——钻孔中的应力观测如何表征地壳应力状态?[J]. 地质力学学报, 31(6): 1146-1158 [54] 孟文, 郭长宝, 张重远, 等, 2017. 青藏高原拉萨块体地应力测量及其意义[J]. 地球物理学报, 60(6): 2159-2171. doi: 10.6038/cjg20170611 [55] 秦向辉, 陈群策, 孟文, 等, 2023. 喜马拉雅东构造结北缘通麦—波密段现今地应力场特征研究. 地质学报, 97(07), 2126-2140. [56] 苏生瑞, 2002. 断裂构造对地应力场的影响及其工程意义[J]. 岩石力学与工程学报, 21(2): 296. [57] 王成虎, 李尉, 2025. 近10年(2014—2025年)地应力测试与估算方法的主要进展及展望[J]. 地质力学学报, 31(6): 1188-1209 [58] 闻则刚, 王正尚, 杨马陵, 2001. 广东地区现代构造应力场的模拟计算[J]. 华南地震, (03): 29-36. doi: 10.3969/j.issn.1001-8662.2001.03.005 [59] 杨树新, 姚瑞, 崔效锋, 等, 2012. 中国大陆与各活动地块、南北地震带实测应力特征分析[J]. 地球物理学报, 55(12): 4207-4217. -

 下载:
下载:

计量
- 文章访问数: 205
- HTML全文浏览量: 92
- PDF下载量: 137
- 被引次数: 0
