

Tectonic characteristics and numerical simulation analysis of an arcuate structural belt:A case study of the middle and southern segments of the Red River fault
-
摘要: 以红河断裂中南段为主体的滇东南弧形构造带作为川滇地块的西南边界和向南南东滑移的前端,现今的运动性质是以挤压为主的逆走滑运动还是以拉张为主的正走滑运动仍存在争议,这与青藏高原东南缘周围复杂的应力−应变模式有着强烈的关联。为进一步研究滇东南弧形构造带的运动学特征及成因,结合野外地质调查及已有研究成果,建立三维地质模型进行有限差分数值模拟,研究结果表明:红河断裂中南段沿线大量地质剖面显示正走滑运动性质,揭示出现今该区域主要受拉张−剪切应力作用的控制;青藏高原东南缘现今的构造变形及地貌演化主要受控于岩石圈物质的东南向移动以及苏门答腊−爪哇俯冲带下发生的弧后拉张、板块回撤2个不同力源的共同作用,同时,下地壳流的存在会显著影响青藏高原东南缘的构造变形尺度,在滇东南弧形构造带中,弧后拉张及板块回撤起着更为显著的控制作用;滇东南弧形构造带早期初始弯曲形态的形成主要归因于岩石圈物质东南向移动的影响及小江断裂左旋走滑的牵引,并在先存构造几何形态的限制和弧后拉张及板块回撤的控制下产生持续形变。研究结果有助于理解滇东南弧形构造带现今的活动特征及成因,并为青藏高原东南缘构造演化研究提供定量化分析的参考和理论依据。Abstract:
Objective The southeast Yunnan Arcuate Structural Belt, with the central and southern segments of the Red River fault as its main body, serves as the southwestern boundary of the Sichuan-Yunnan block and the forefront of its south-southeastward movement. However, there is still controversy as to whether its current motion is primarily characterized by transpression or transtension. This debate is strongly correlated with the complex stress-strain patterns surrounding the southeastern margin of the Qinghai-Tibet Plateau. Clarification of the kinematic characteristics and genesis of the southeast Yunnan Arcuate Structural Belt will help to understand the regional tectonic evolution. Methods This study utilized the interpretation of remote sensing images and geological field surveys to identify evidence for late Quaternary tectonic activity in the central and southern segments of the Red River fault. A three-dimensional (3D) geological model tailored to the actual characteristics of the region was established. It considers the influence of lower crustal flow and includes finite-difference numerical simulations with different velocity boundary conditions set at 26.5°N. Results The study reveals: (1) Numerous geomorphic features and fault profiles in the central and southern segments of the Red River fault indicate that most of the faults along the line are predominantly high-angle, northwest-striking with a complex fault rock development. The presence of structural wedges and infill of overlying material has been observed in several typical outcrops. Additionally, there are significant undulations in the lower part of the overlying strata on both sides of the fault. (2) The numerical simulations show that the influence of the far-field stress on the horizontal and vertical deformation of the southeastern margin of the Qinghai-Tibet Plateau is quite different on both sides of 26.5°N, and the deformation is further enhanced by the presence of lower crustal flow. (3) Numerical simulations of velocity fields, maximum shear strain rates, and maximum principal stresses demonstrate that surface motion trajectories, velocity distributions, stress conditions, and deformation accumulation differ among different models for the arcuate structural belt area; the presence of lower crustal flow promotes deformation accumulation and makes the magnitude of the velocity field closer to that of the current GPS horizontal velocity field. Conclusion (1) The numerous geological profiles along the central and southern segments of the Red River fault reveal predominantly normal-strike-slip movement, indicating that the region is currently dominated by the effects of transtension; (2) Current tectonic deformation and landscape evolution in the southeastern margin of the Qinghai-Tibet Plateau are mainly controlled by two different force sources: one is the southeastward movement of material, and the other is the arc-parallel extension and slab rollback beneath the Sunda-Java subduction zone. The presence of lower crustal flow influencess the scale of tectonic deformation in the southeastern margin of the Qinghai-Tibet Plateau. In the southeast Yunnan Arcuate Structural Belt, arc-parallel extension and slab retreat play a more significant controlling role; (3) The initial curved shape of the southeast Yunnan Arcuate Structural Belt is mainly attributed to the influence of material migration towards the southeast and the Xiaojiang sinistral strike-slip fault. Under the constraints of pre-existing structural fabrics and the control of arc-parallel extension and slab retreat, it has led to continuous deformation. Significance The research contributes to the understanding of the current activity of the southeast Yunnan Arcuate Structural Belt and the causes of this activity. It provides a quantitative analysis reference and theoretical basis for the study of the tectonic evolution of the southeastern margin of the Qinghai-Tibet Plateau. -
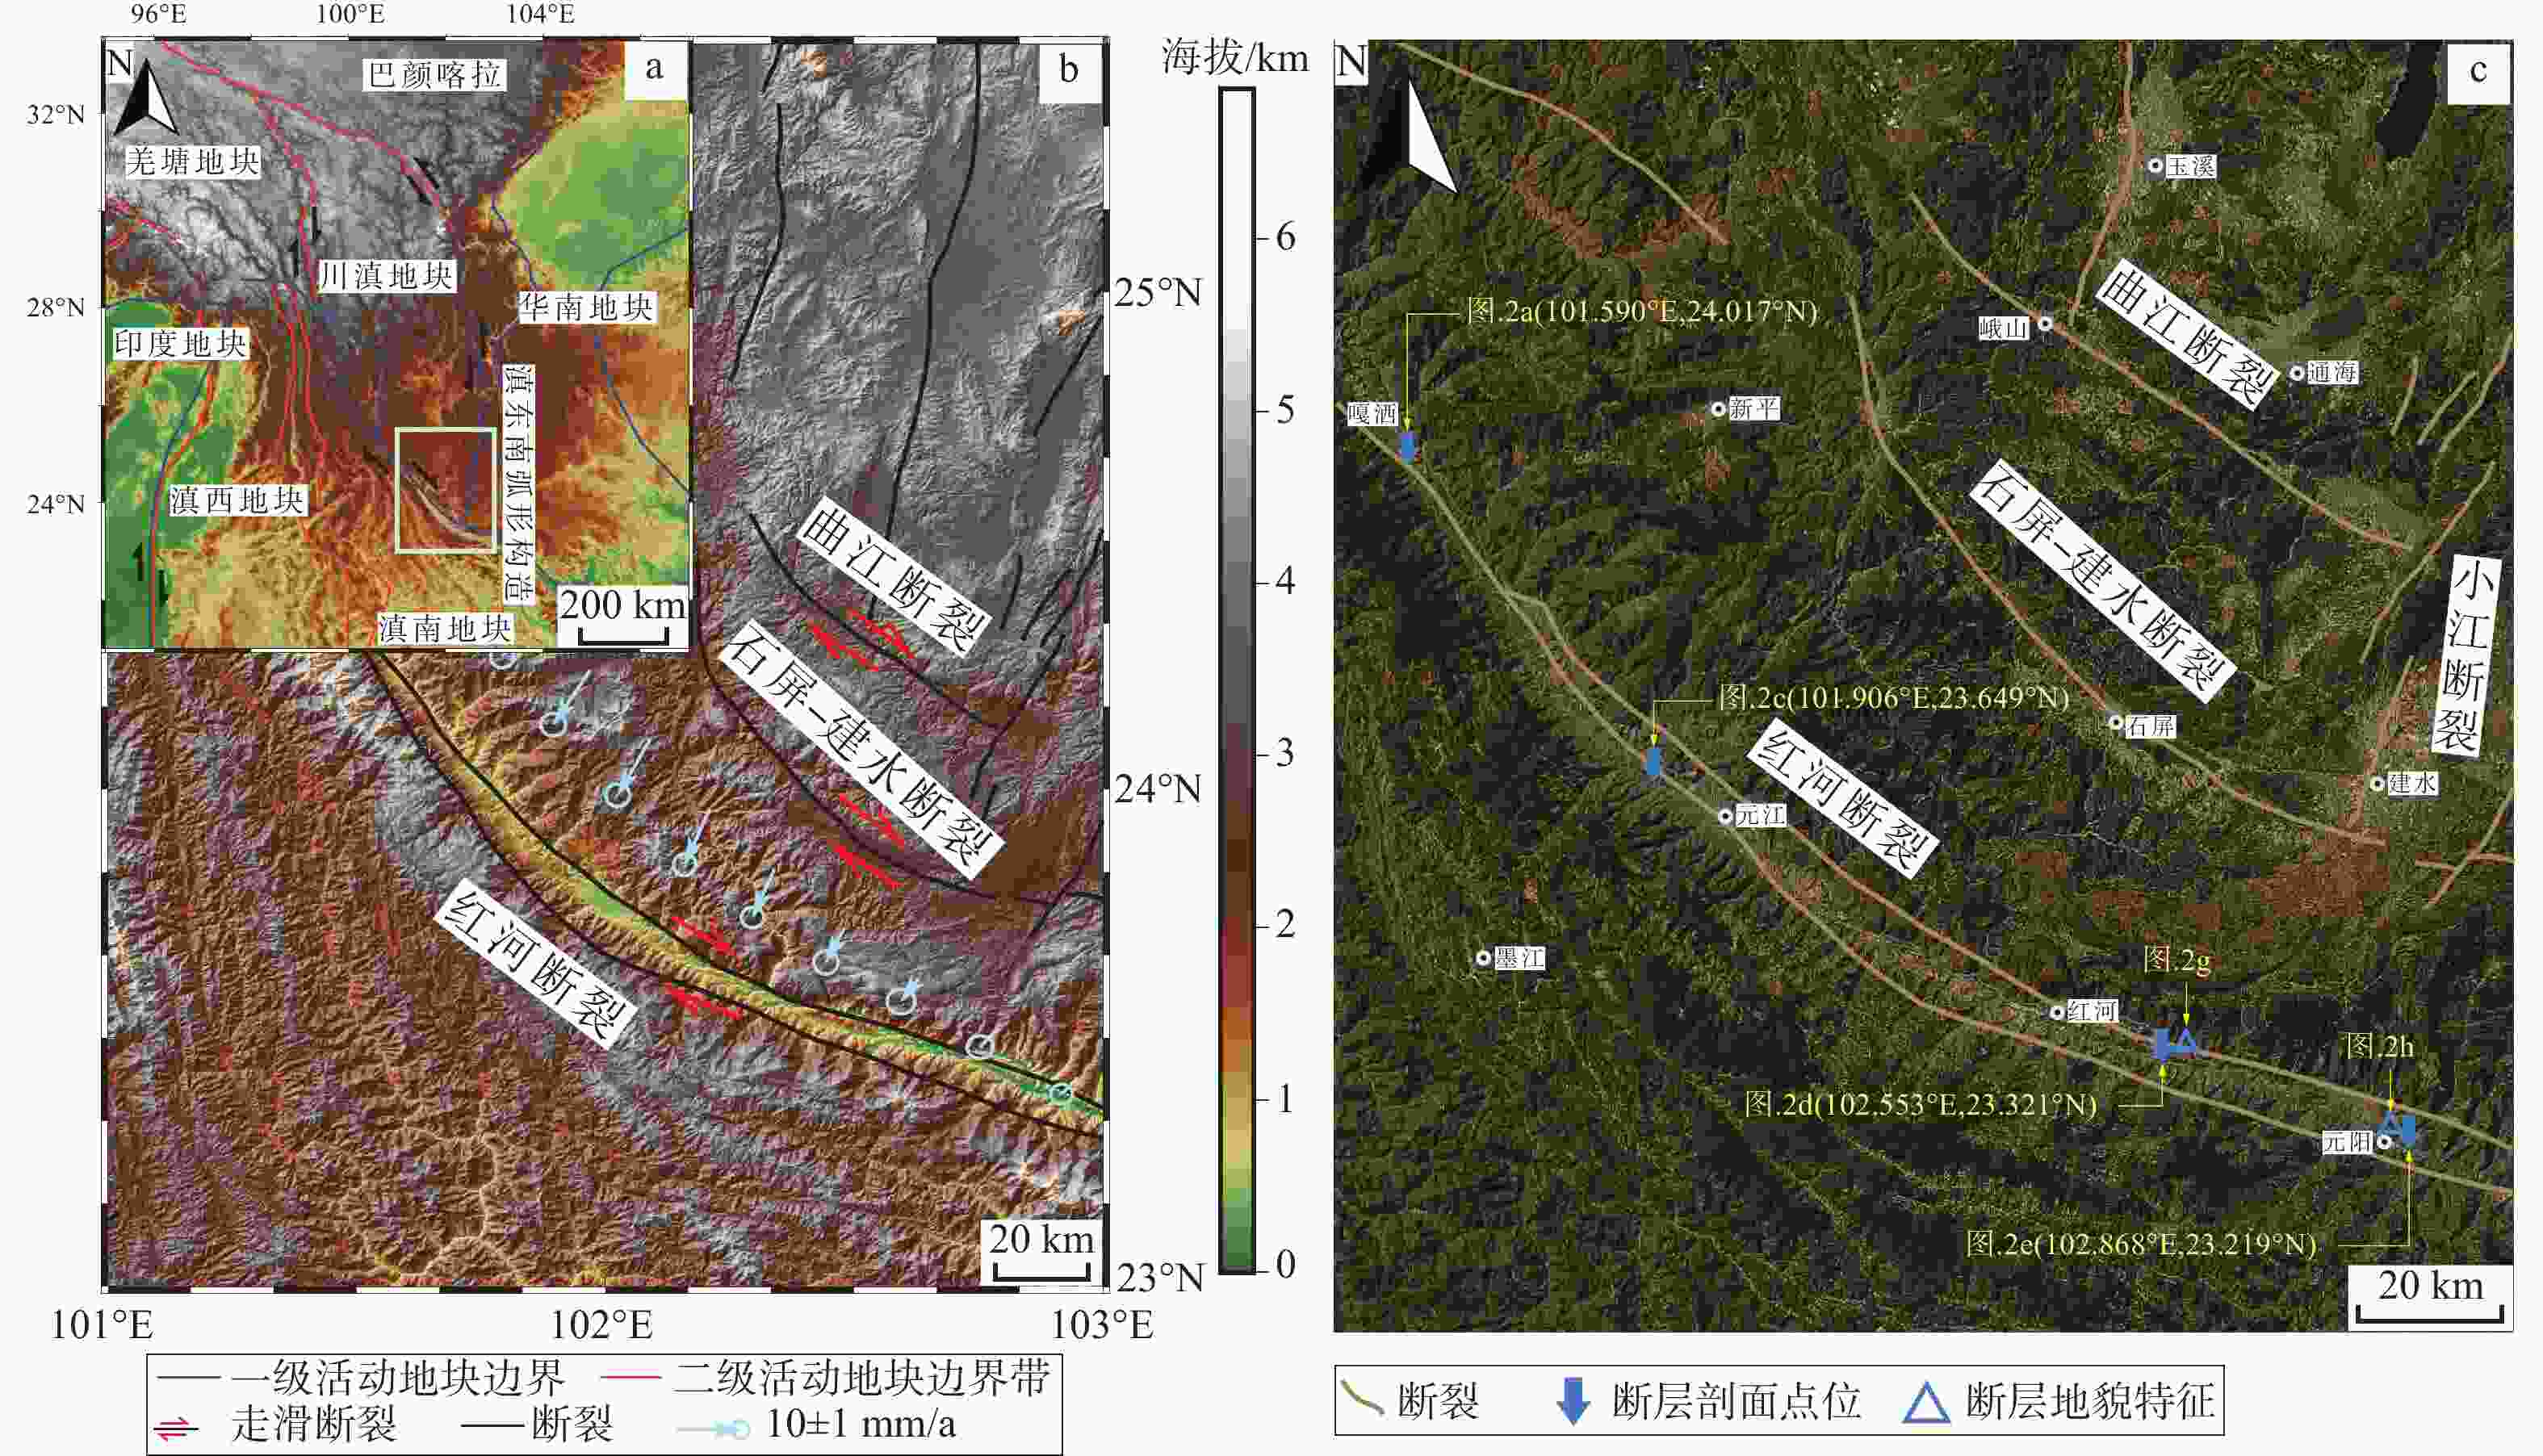
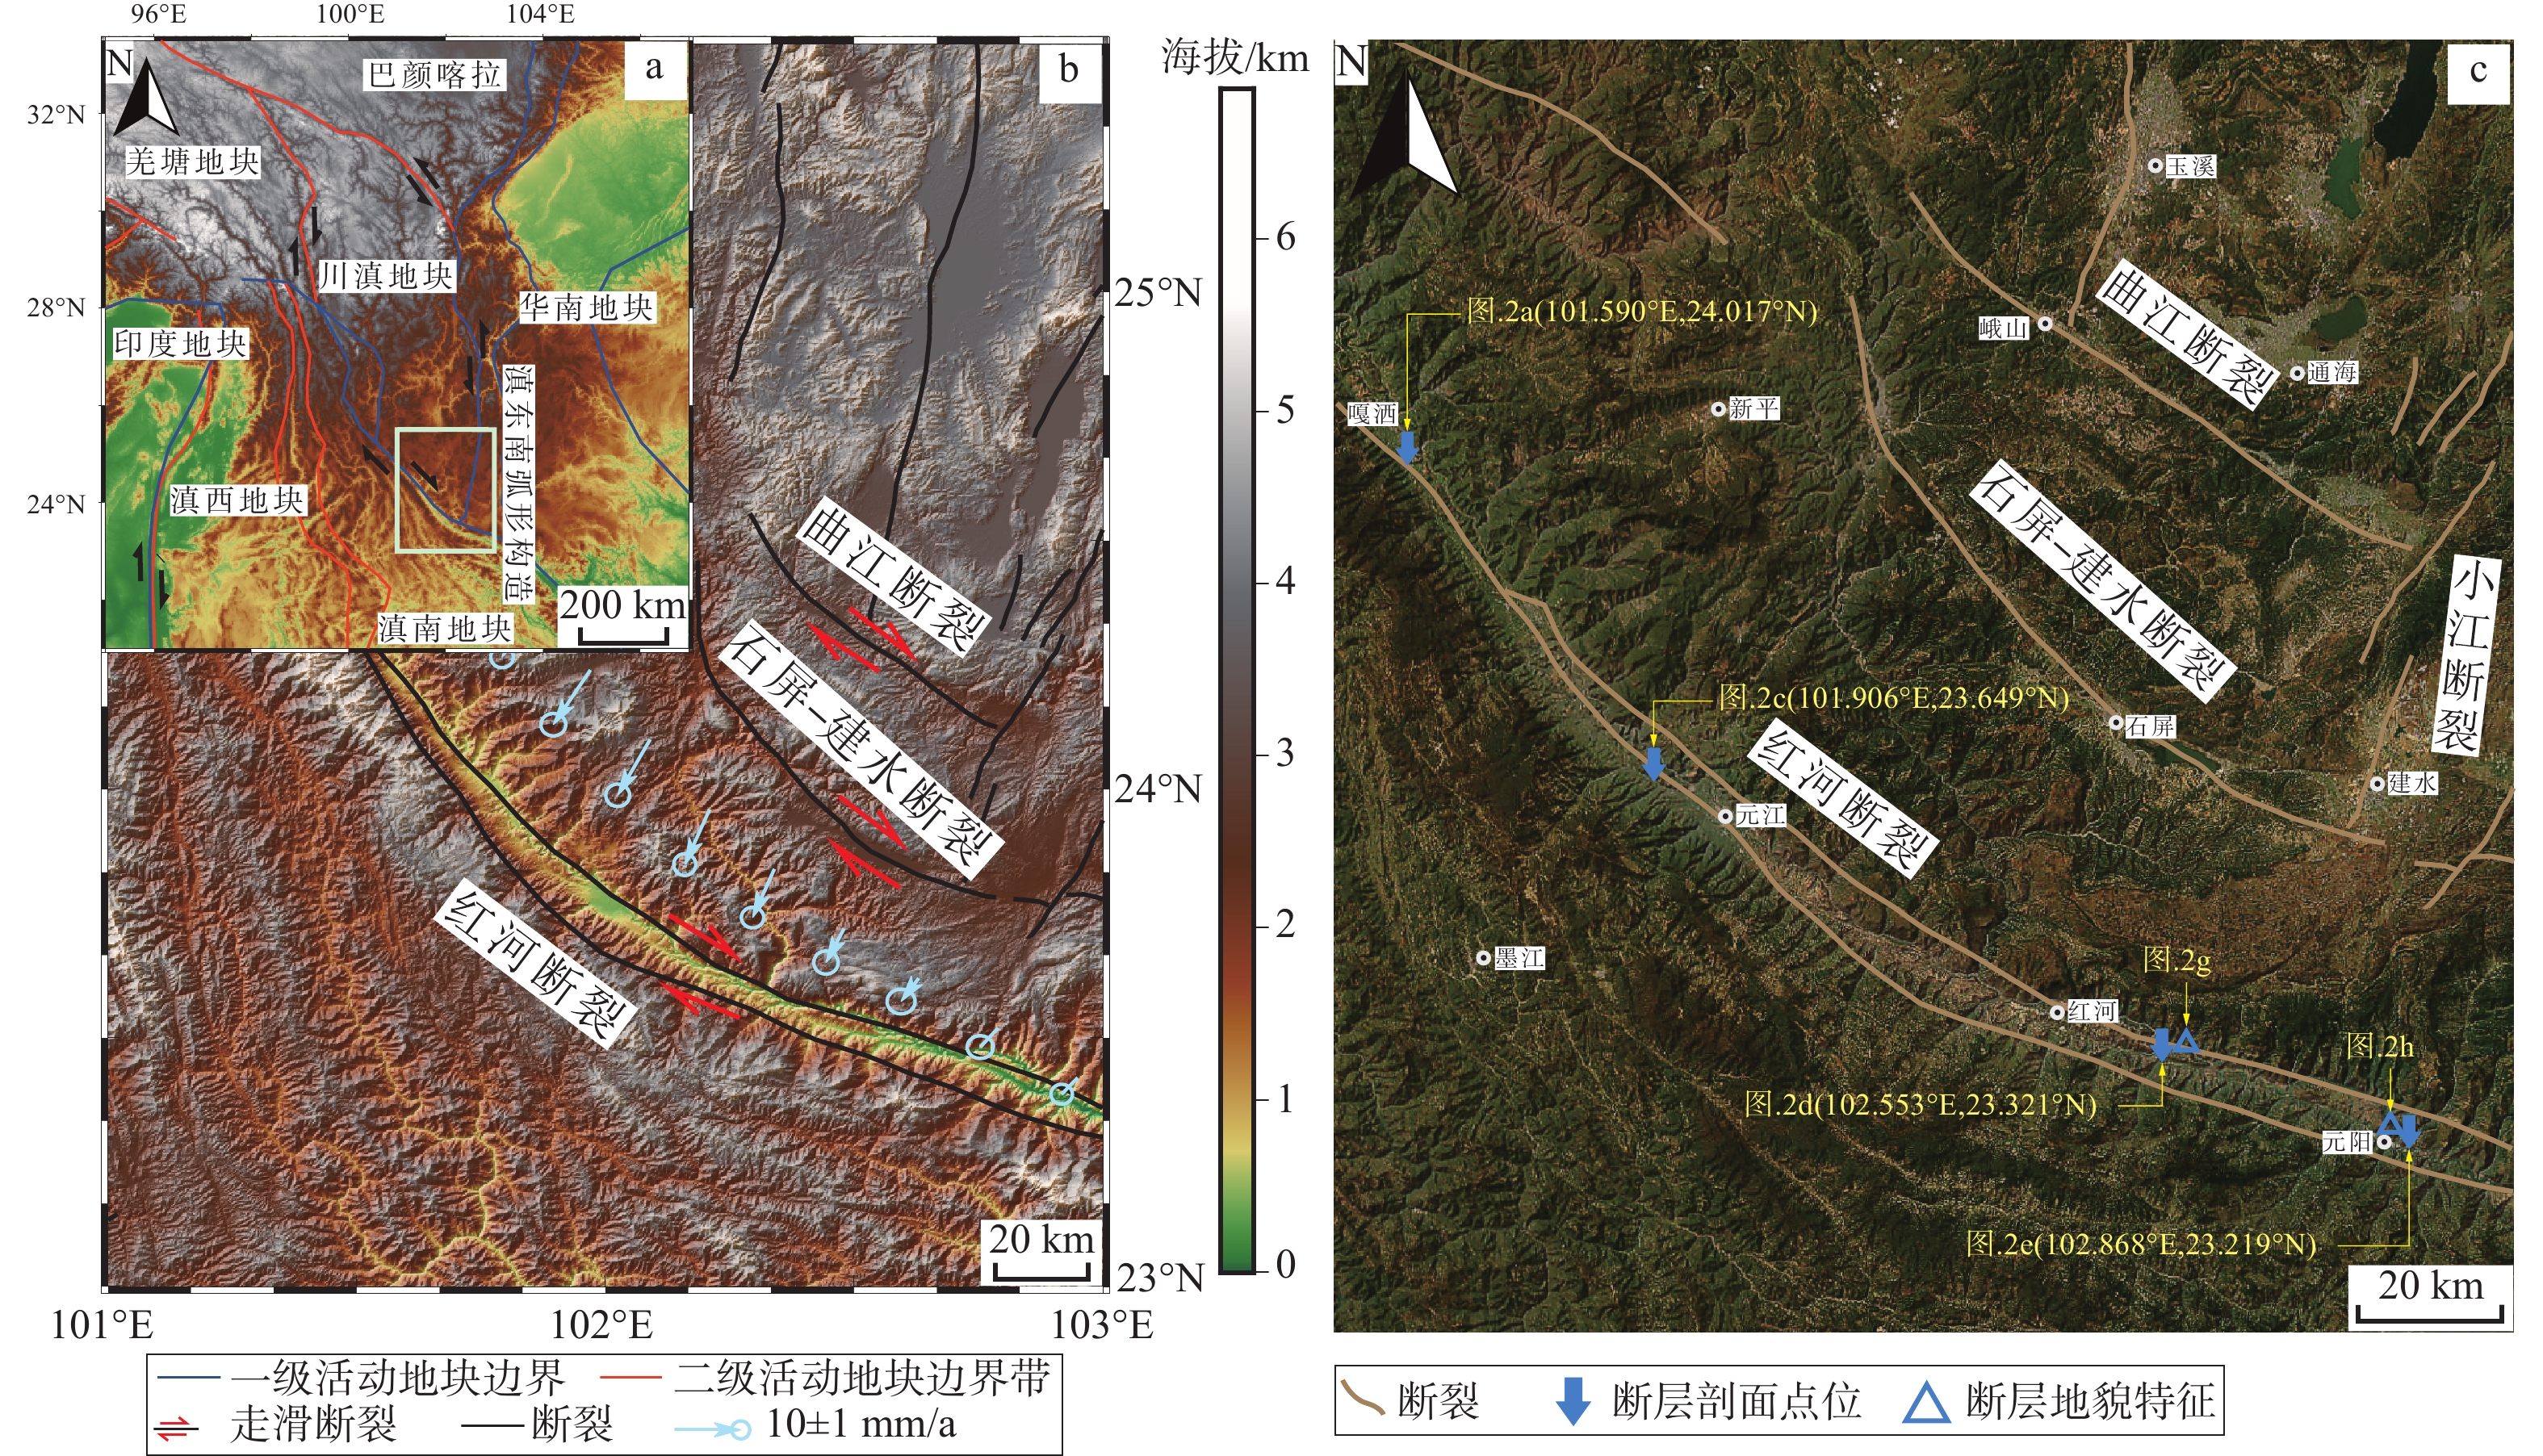
图 1 滇东南弧形构造带主要断裂分布及地貌影像图
a—滇东南弧形构造带位置(图中地块划分根据张培震等,2003修改);b—滇东南弧形构造带断裂分布及沿线水平GPS速度场(图中GPS水平速度场数据为相对华南板块的GPS水平速度场,通过地表断裂迹线及推断未偏转的断裂迹线插值获取;Gan et al.,2022);c—滇东南弧形构造带地貌影像图(来自天地图https://vgimap.tianditu.gov.cn/)
Figure 1. Distribution of major faults and topographic imagery, southeast Yunnan Arcuate Structural Belt
(a) Location of the southeast Yunnan Arcuate Structural Belt (block division based on Zhang et al., 2003); (b) Distribution of faults in the southeast Yunnan Arcuate Structural Belt and the horizontal GPS velocity field along the fault (the horizontal GPS velocity field is relative to the South China Plate; it is obtained by interpolating through surface fault traces and inferred undeflected fault traces; Gan et al., 2022); (c) Geomorphological imagery of the southeast Yunnan Arcuate Structural Belt ( from https://vgimap.tianditu.gov.cn/ )
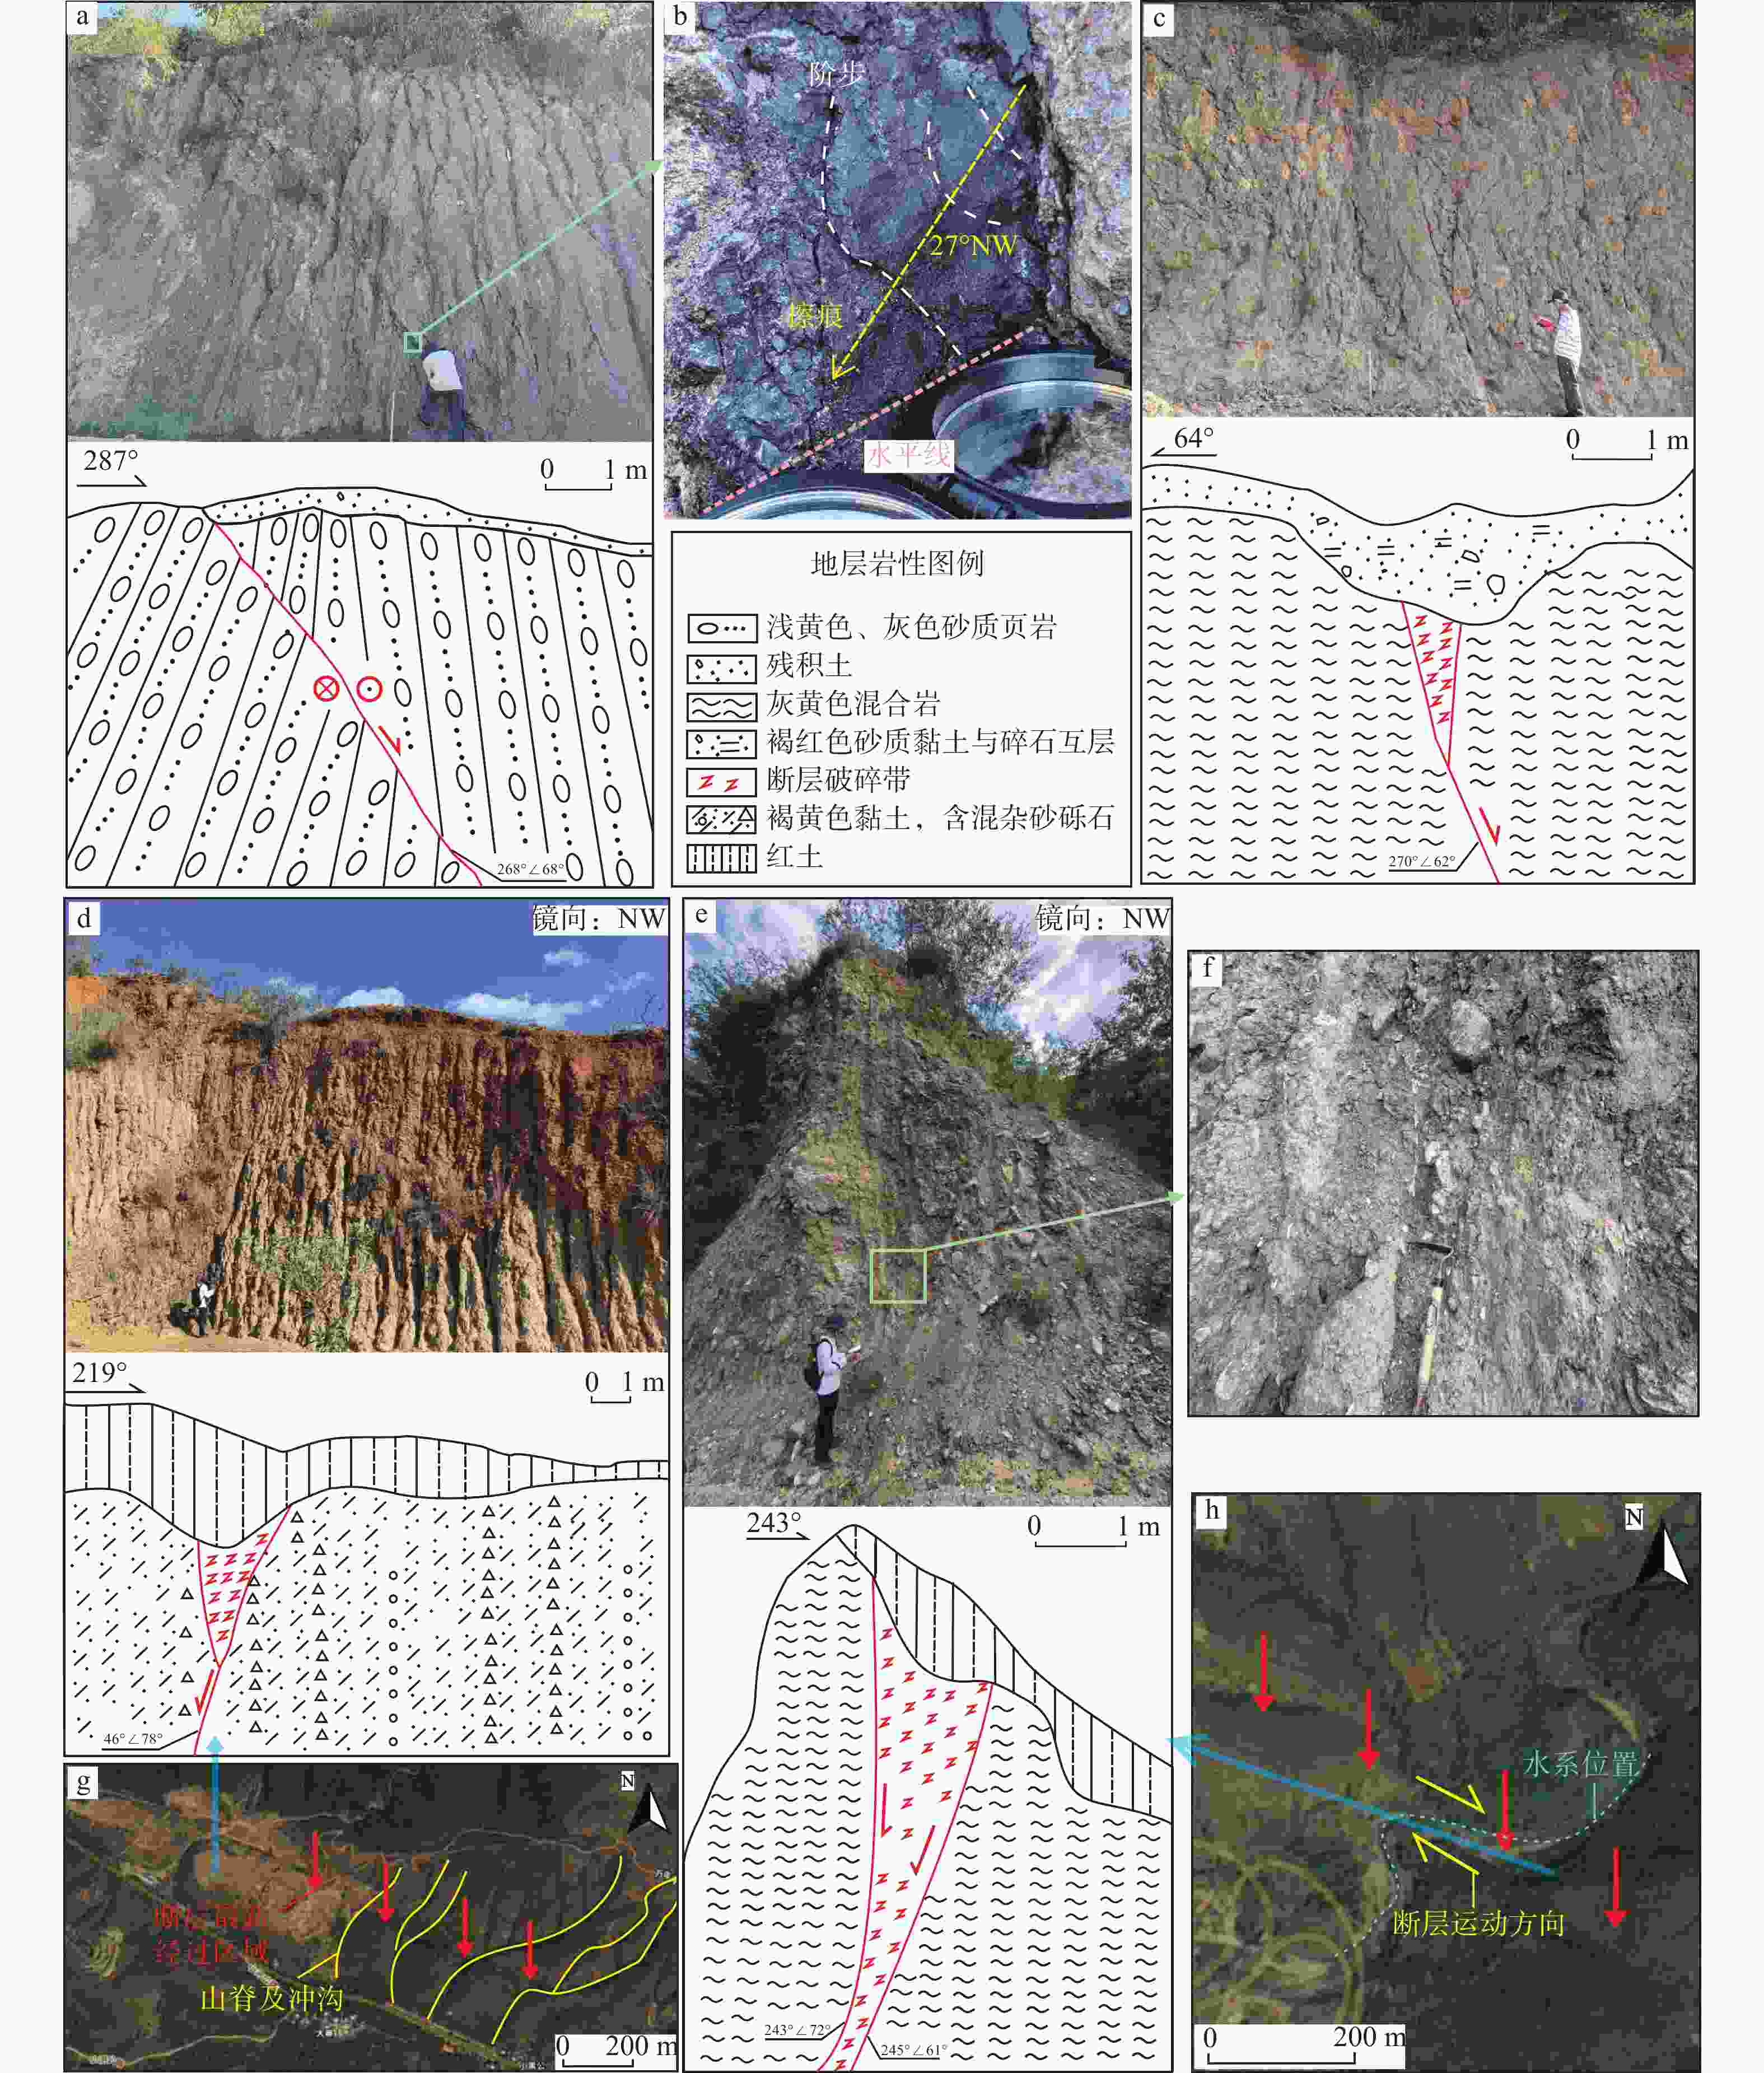
图 2 红河断裂中南段典型露头和遥感影像解译(影像均来源天地图
https://vgimap.tianditu.gov.cn/ )a—嘎洒收费站西北侧断层;b—嘎洒收费站西北侧断层擦痕;c—马鹿洞东南侧断层;d—大寨西北侧断层;e—元阳县城南阿土断层;f—元阳县城南阿土断层破碎带细节;g—大寨西北侧大黑公山脊及冲沟右旋位错遥感影像;h—元阳县城南阿土龙岔河右旋位错遥感影像
Figure 2. Typical outcrops and remote sensing image interpretation, middle and southern segments of the Red River fault zone ( remote sensing images from Tianditu
https://vgimap.tianditu.gov.cn/ )(a) Fault to the northwest of Gasa toll station; (b) Scratches on the fault to the northwest of Gasa toll station; (c) Fault to the southeast of Maludong; (d) Fault to the northwest of Dazhai; (e) Fault to the south of Yuanyang County Atu area; (f) Details of the fracture zone of the fault to the south of Yuanyang County Atu area; (g) Remote sensing image of the dextral dislocation of a ridge and gully at Dazhai, northwest of Daheigong; (h) Remote sensing image of the dextral dislocation of the Atu Longcha River in the south of Yuanyang County
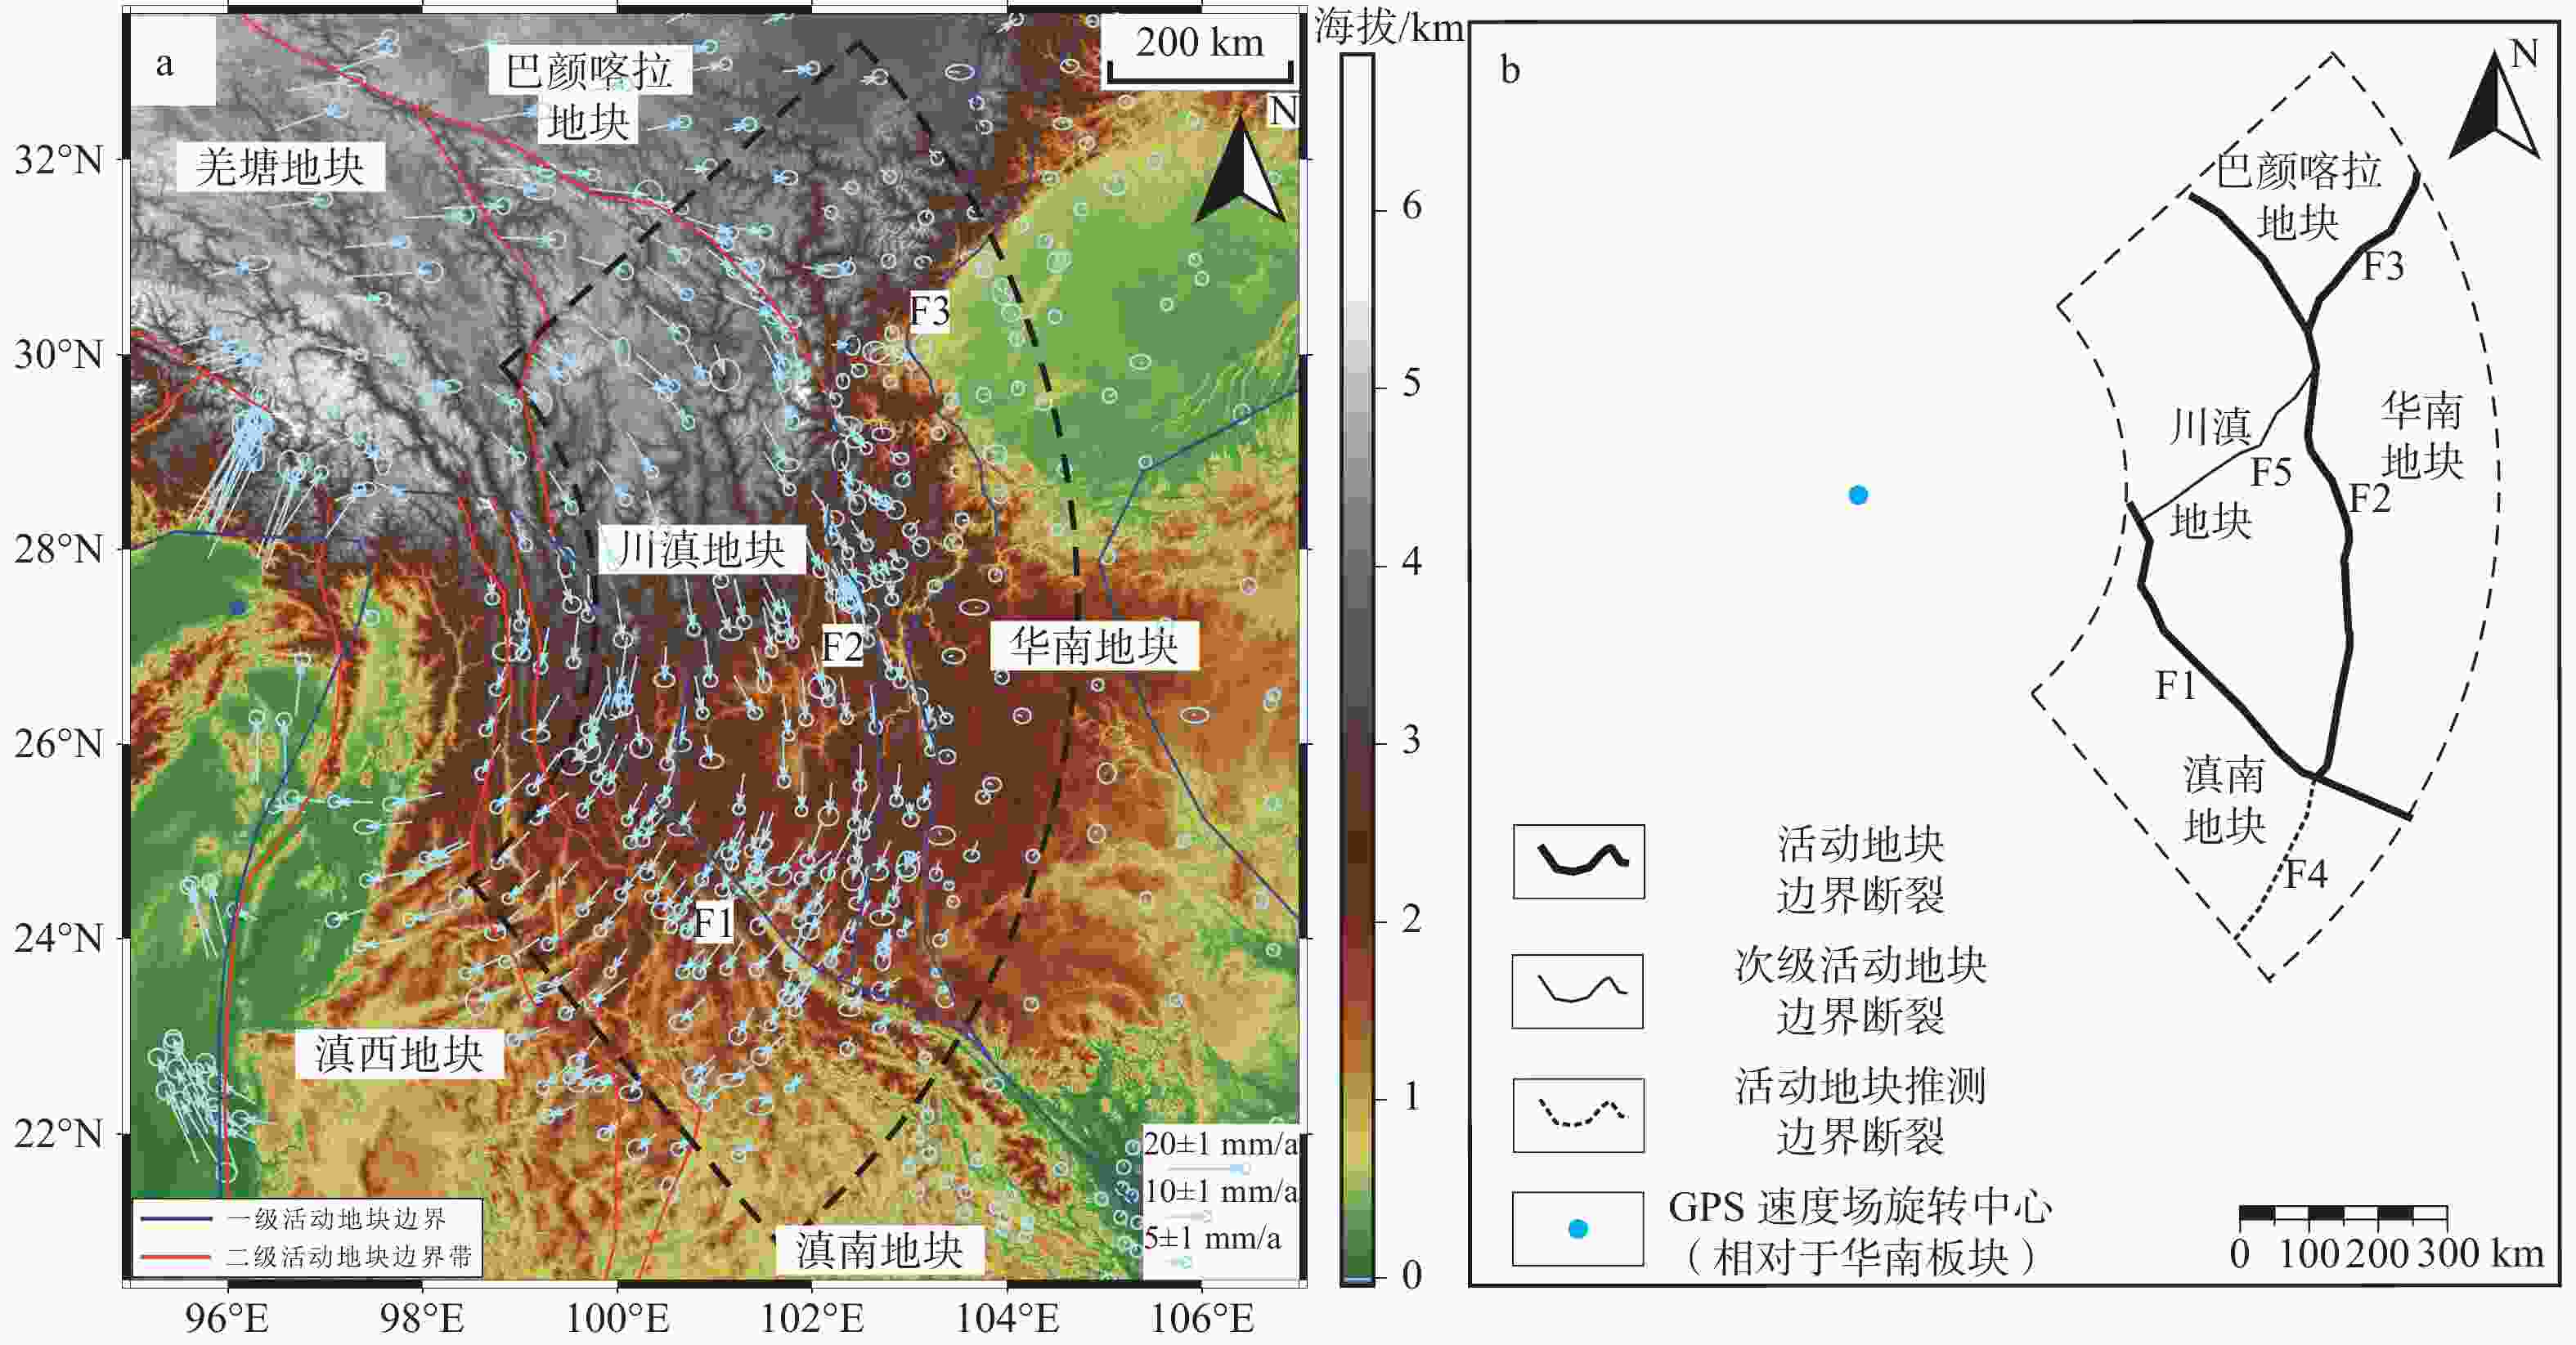
图 3 数值模拟研究区域
F1—红河断裂;F2—鲜水河−安宁河−则木河−小江断裂系统;F3—龙门山断裂;F4—奠边府断裂;F5—丽江小金河断裂a—青藏高原东南缘GPS水平速度场(数据来自Gan et al.,2022;图中蓝色圆点为拟合的相对华南地块旋转中心);b—地质模型中主要断裂格架
Figure 3. Study area of the numerical simulation
(a) Horizontal GPS velocity field of the southeastern margin of the Qinghai-Tibet Plateau (data are from Gan et al., 2022; The blue dots in the figure denote the fitted rotation center relative to the South China Block); (b) The primary fault framework in the geological model F1: Red River Fault; F2: Xianshui River-Anning River-Zemu River-Xiaojiang Fault System; F3: Longmenshan Fault; F4: Dianbianfu Fault, F5: Lijiang-Xiaojinhe Fault
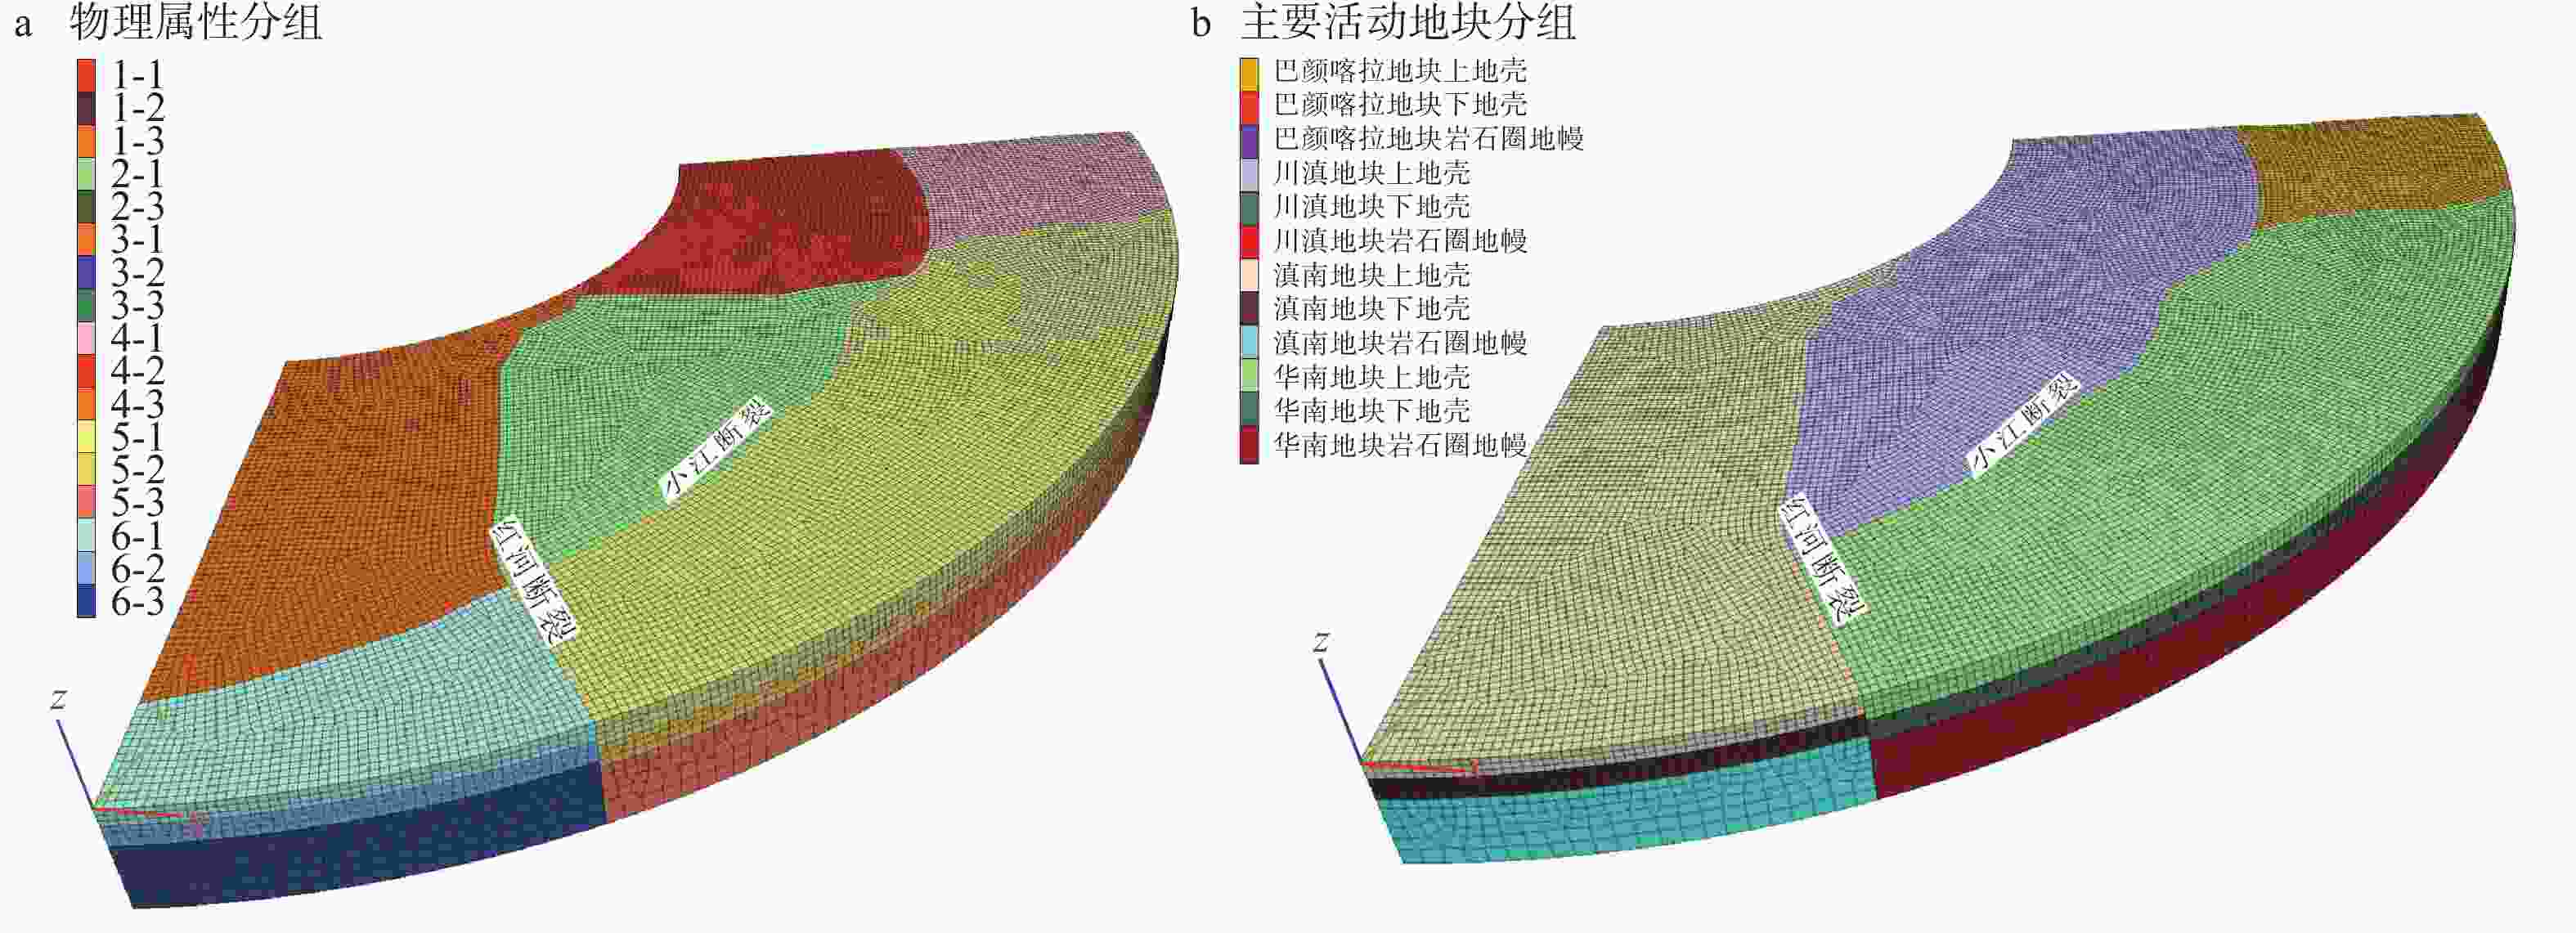
图 4 研究区域三维地质模型
a—物理属性分组;b—主要活动地块分组
Figure 4. Three-dimensional (3D) geological model of the study area
(a) Grouping by physical properties; (b) Grouping by major active blocks
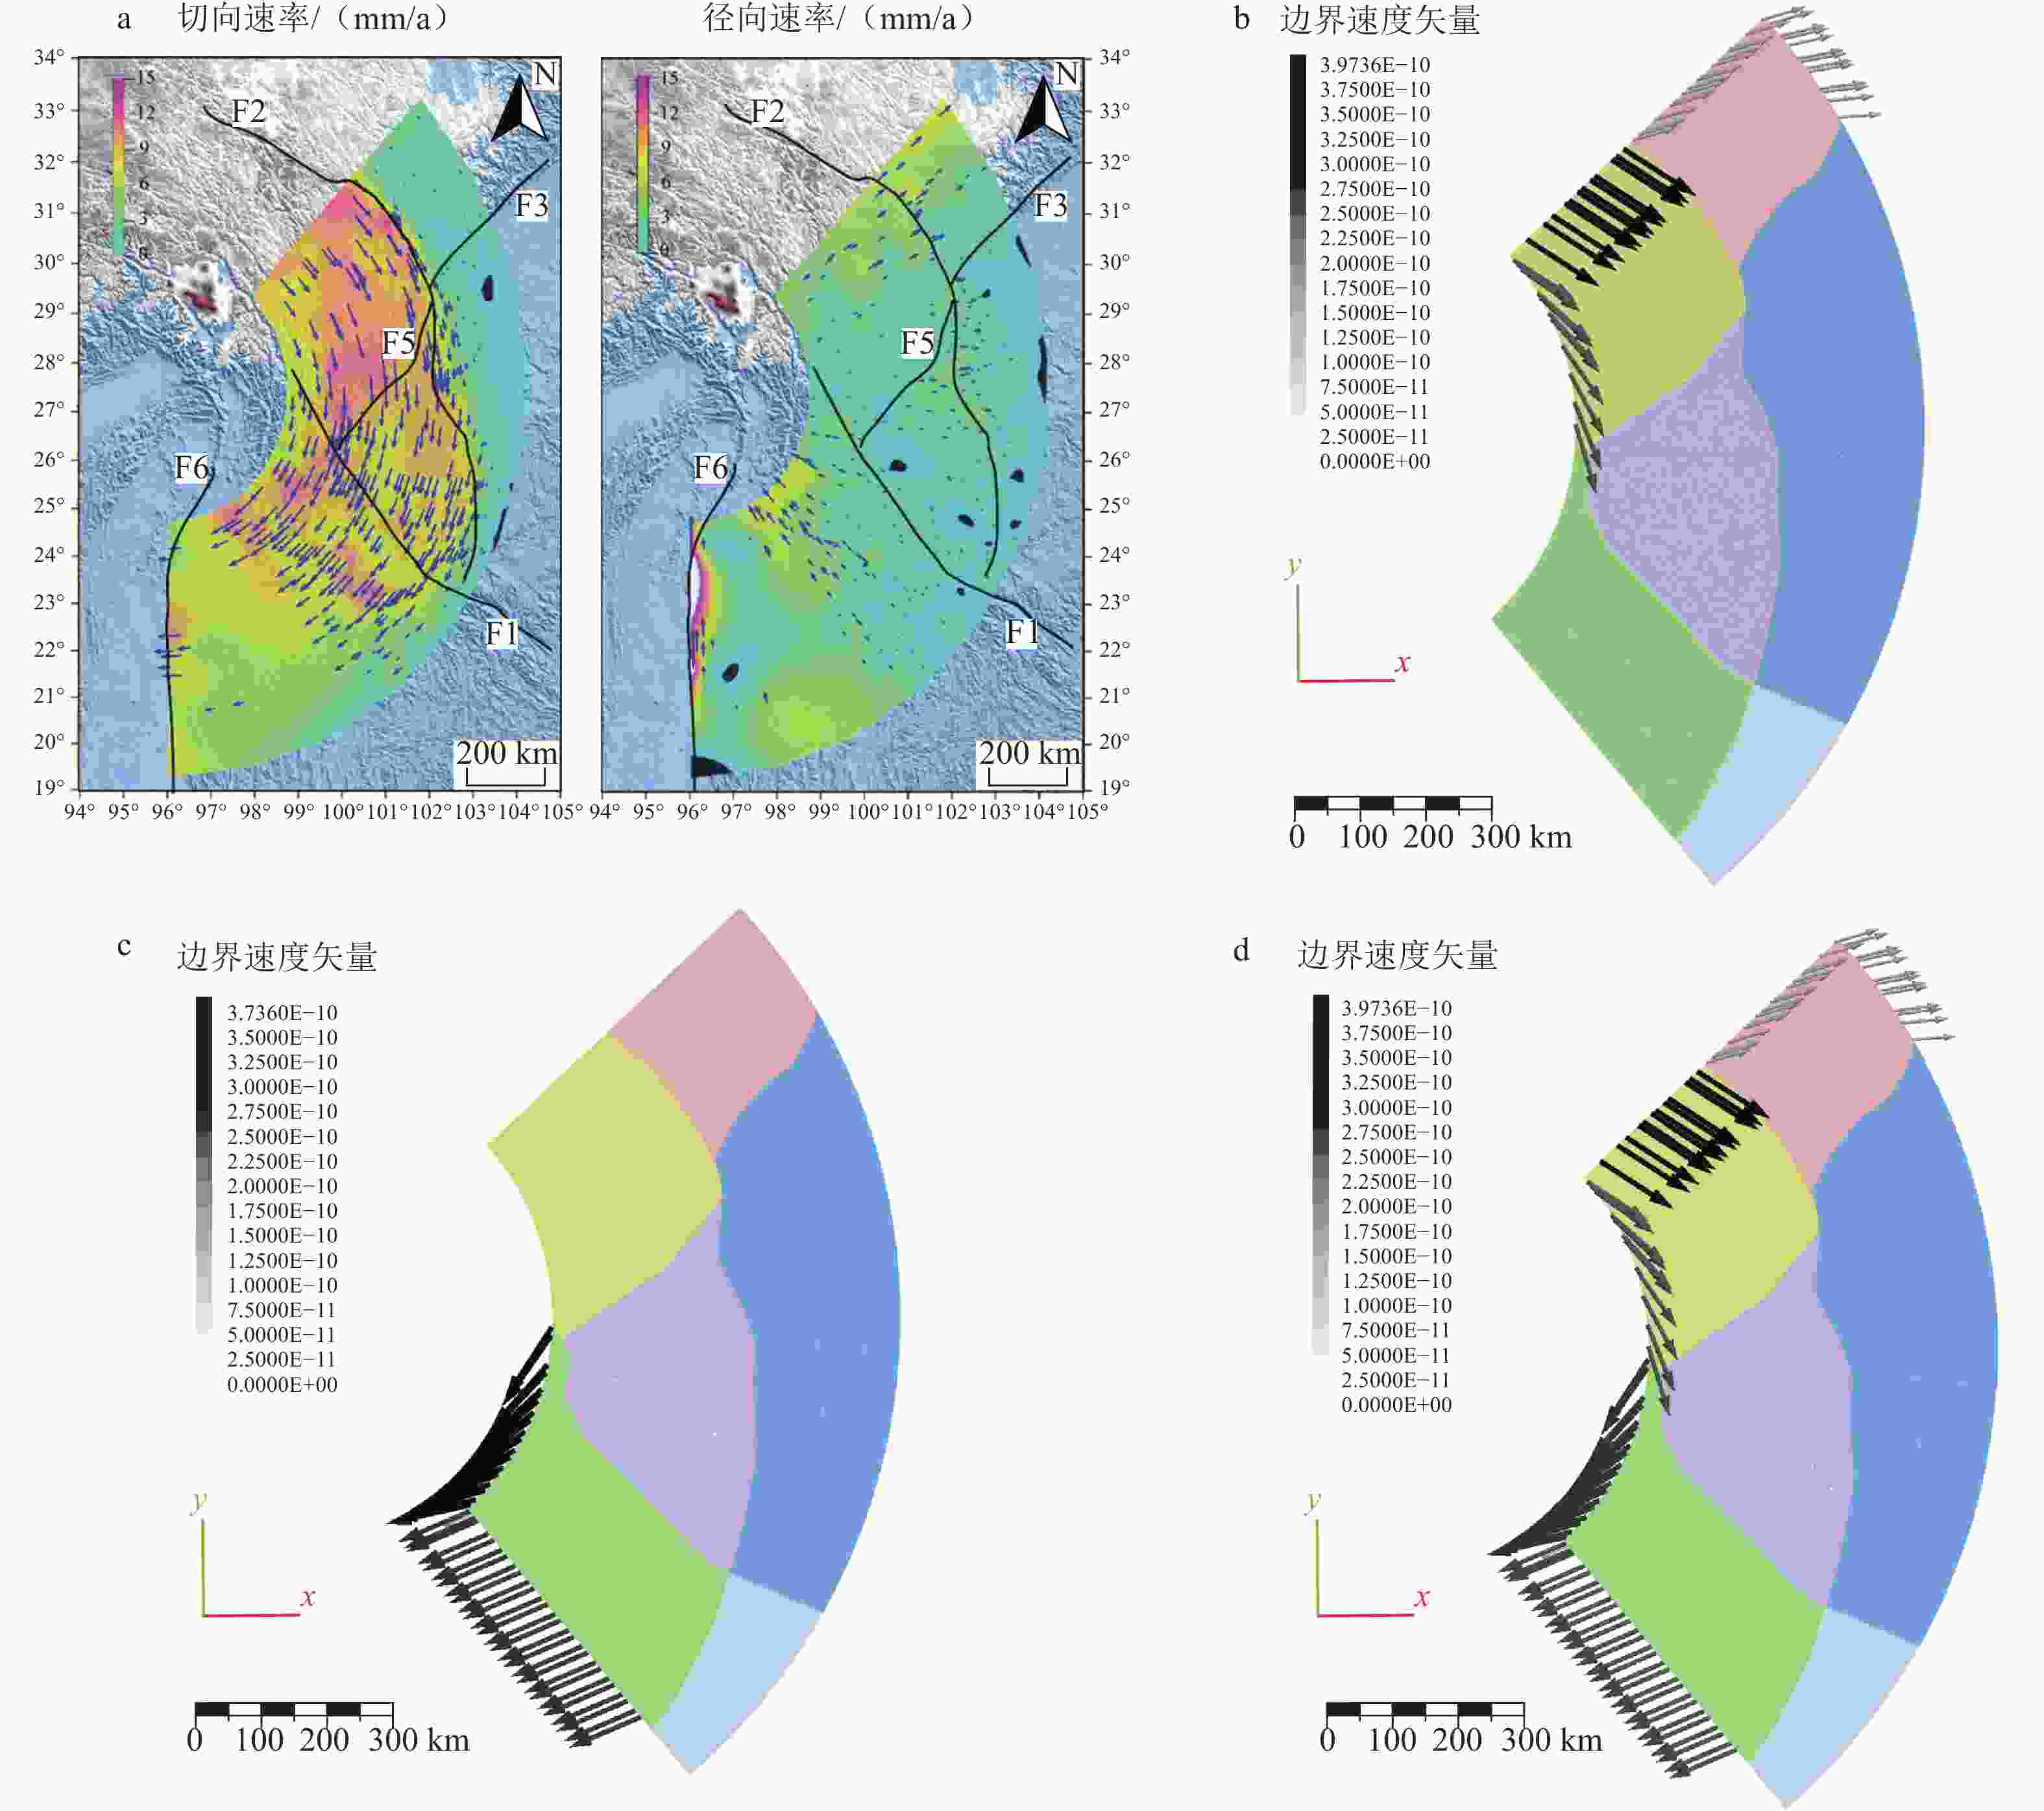
图 5 模型速度边界条件
F1—红河断裂;F2—鲜水河−安宁河−则木河−小江断裂系统;F3—龙门山断裂;F5—丽江小金河断裂;F6—实皆断裂;图b、c、d中不同色块分别对应被赋予不同物理参数的构造单元,其中箭头指向指示了速度矢量的方向,箭头颜色和长度指示边界速度大小,具体数值对应图左侧的色标,单位为m/sa—相对于华南地块速度场旋转中心进行切向和径向分量投影(朱良玉, 2020);b—模型一速度边界条件;c—模型二速度边界条件;d—模型三速度边界条件
Figure 5. Velocity boundary conditions of the model
(a) Projections of the tangential and radial components relative to the rotation center of the velocity field of the South China Block (Zhu, 2020); (b) Velocity boundary condition of Model 1; (c) Velocity boundary condition of Model 2; (d) Velocity boundary condition of Model 3F1: Red River Fault; F2: Xianshuihe-Anninghe-Zemuhe-Xiaojiang Fault System; F3: Longmenshan Fault; F5: Lijiang-Xiaojinhe Fault; F6: Sagaing Fault In figures b, c, and d, the different colors of the blocks correspond to tectonic units with different physical parameters assigned. The arrows point ate the velocity vector directions. Arrow color and length indicate the magnitude of the boundary velocity. The specific values correspond to the color bar on the left of the figure, with units in m/s.
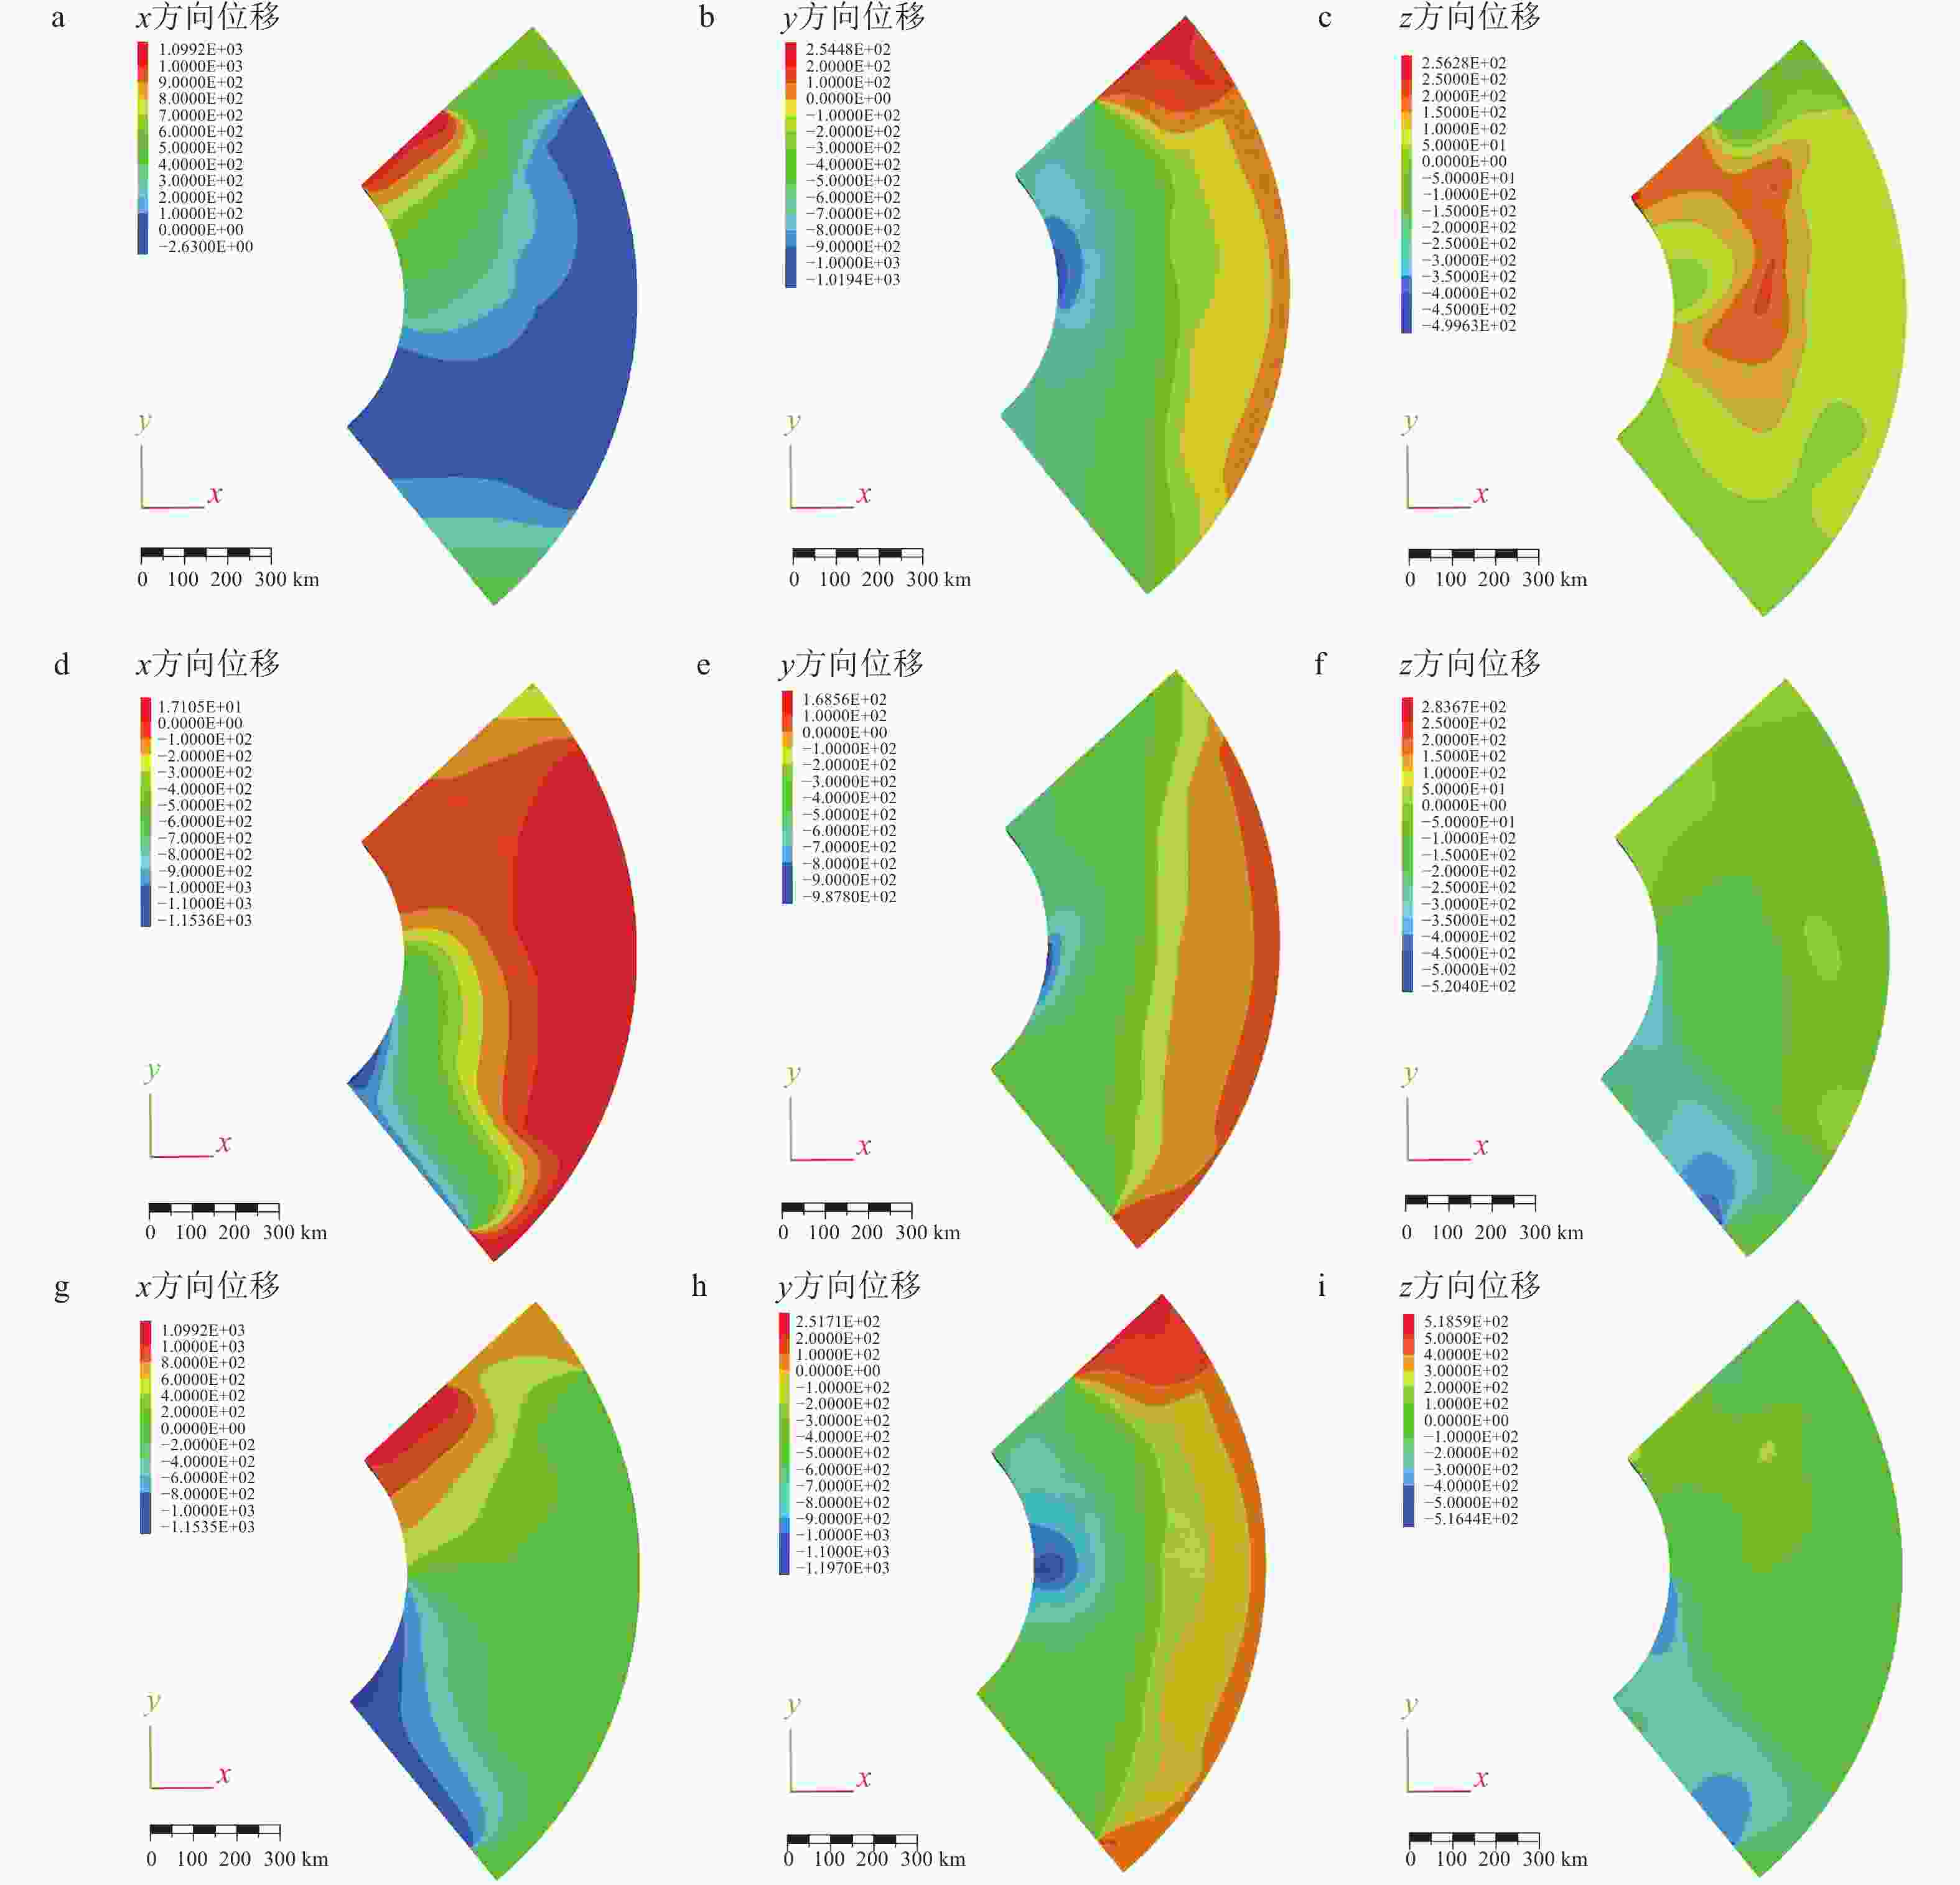
图 6 三维地质模型数值模拟x、y、z轴位移云图(不考虑下地壳流)
位移大小及方向对应每个云图左上角的色标:正值表示沿x、y、z方向位移;负值表示沿x、y、z反方向位移,具体位移大小为该颜色对应的绝对值,单位为ma、b、c—模型一;d、e、f—模型二;g、h、i—模型三
Figure 6. Contour maps for numerical geological 3D simulations ( no lower crustal flow ) of x, y, and z axis displacement
(a), (b), (c) Model 1; (d), (e), (f) Model 2; (g), (h), (i) Model 3 Displacement magnitudes and directions are given as absolute values in meters corresponding to the color bar in the top left corner of each contour map: positive values indicate displacement along the x, y, z direction; negative values indicate displacement along the opposite x, y, z direction.
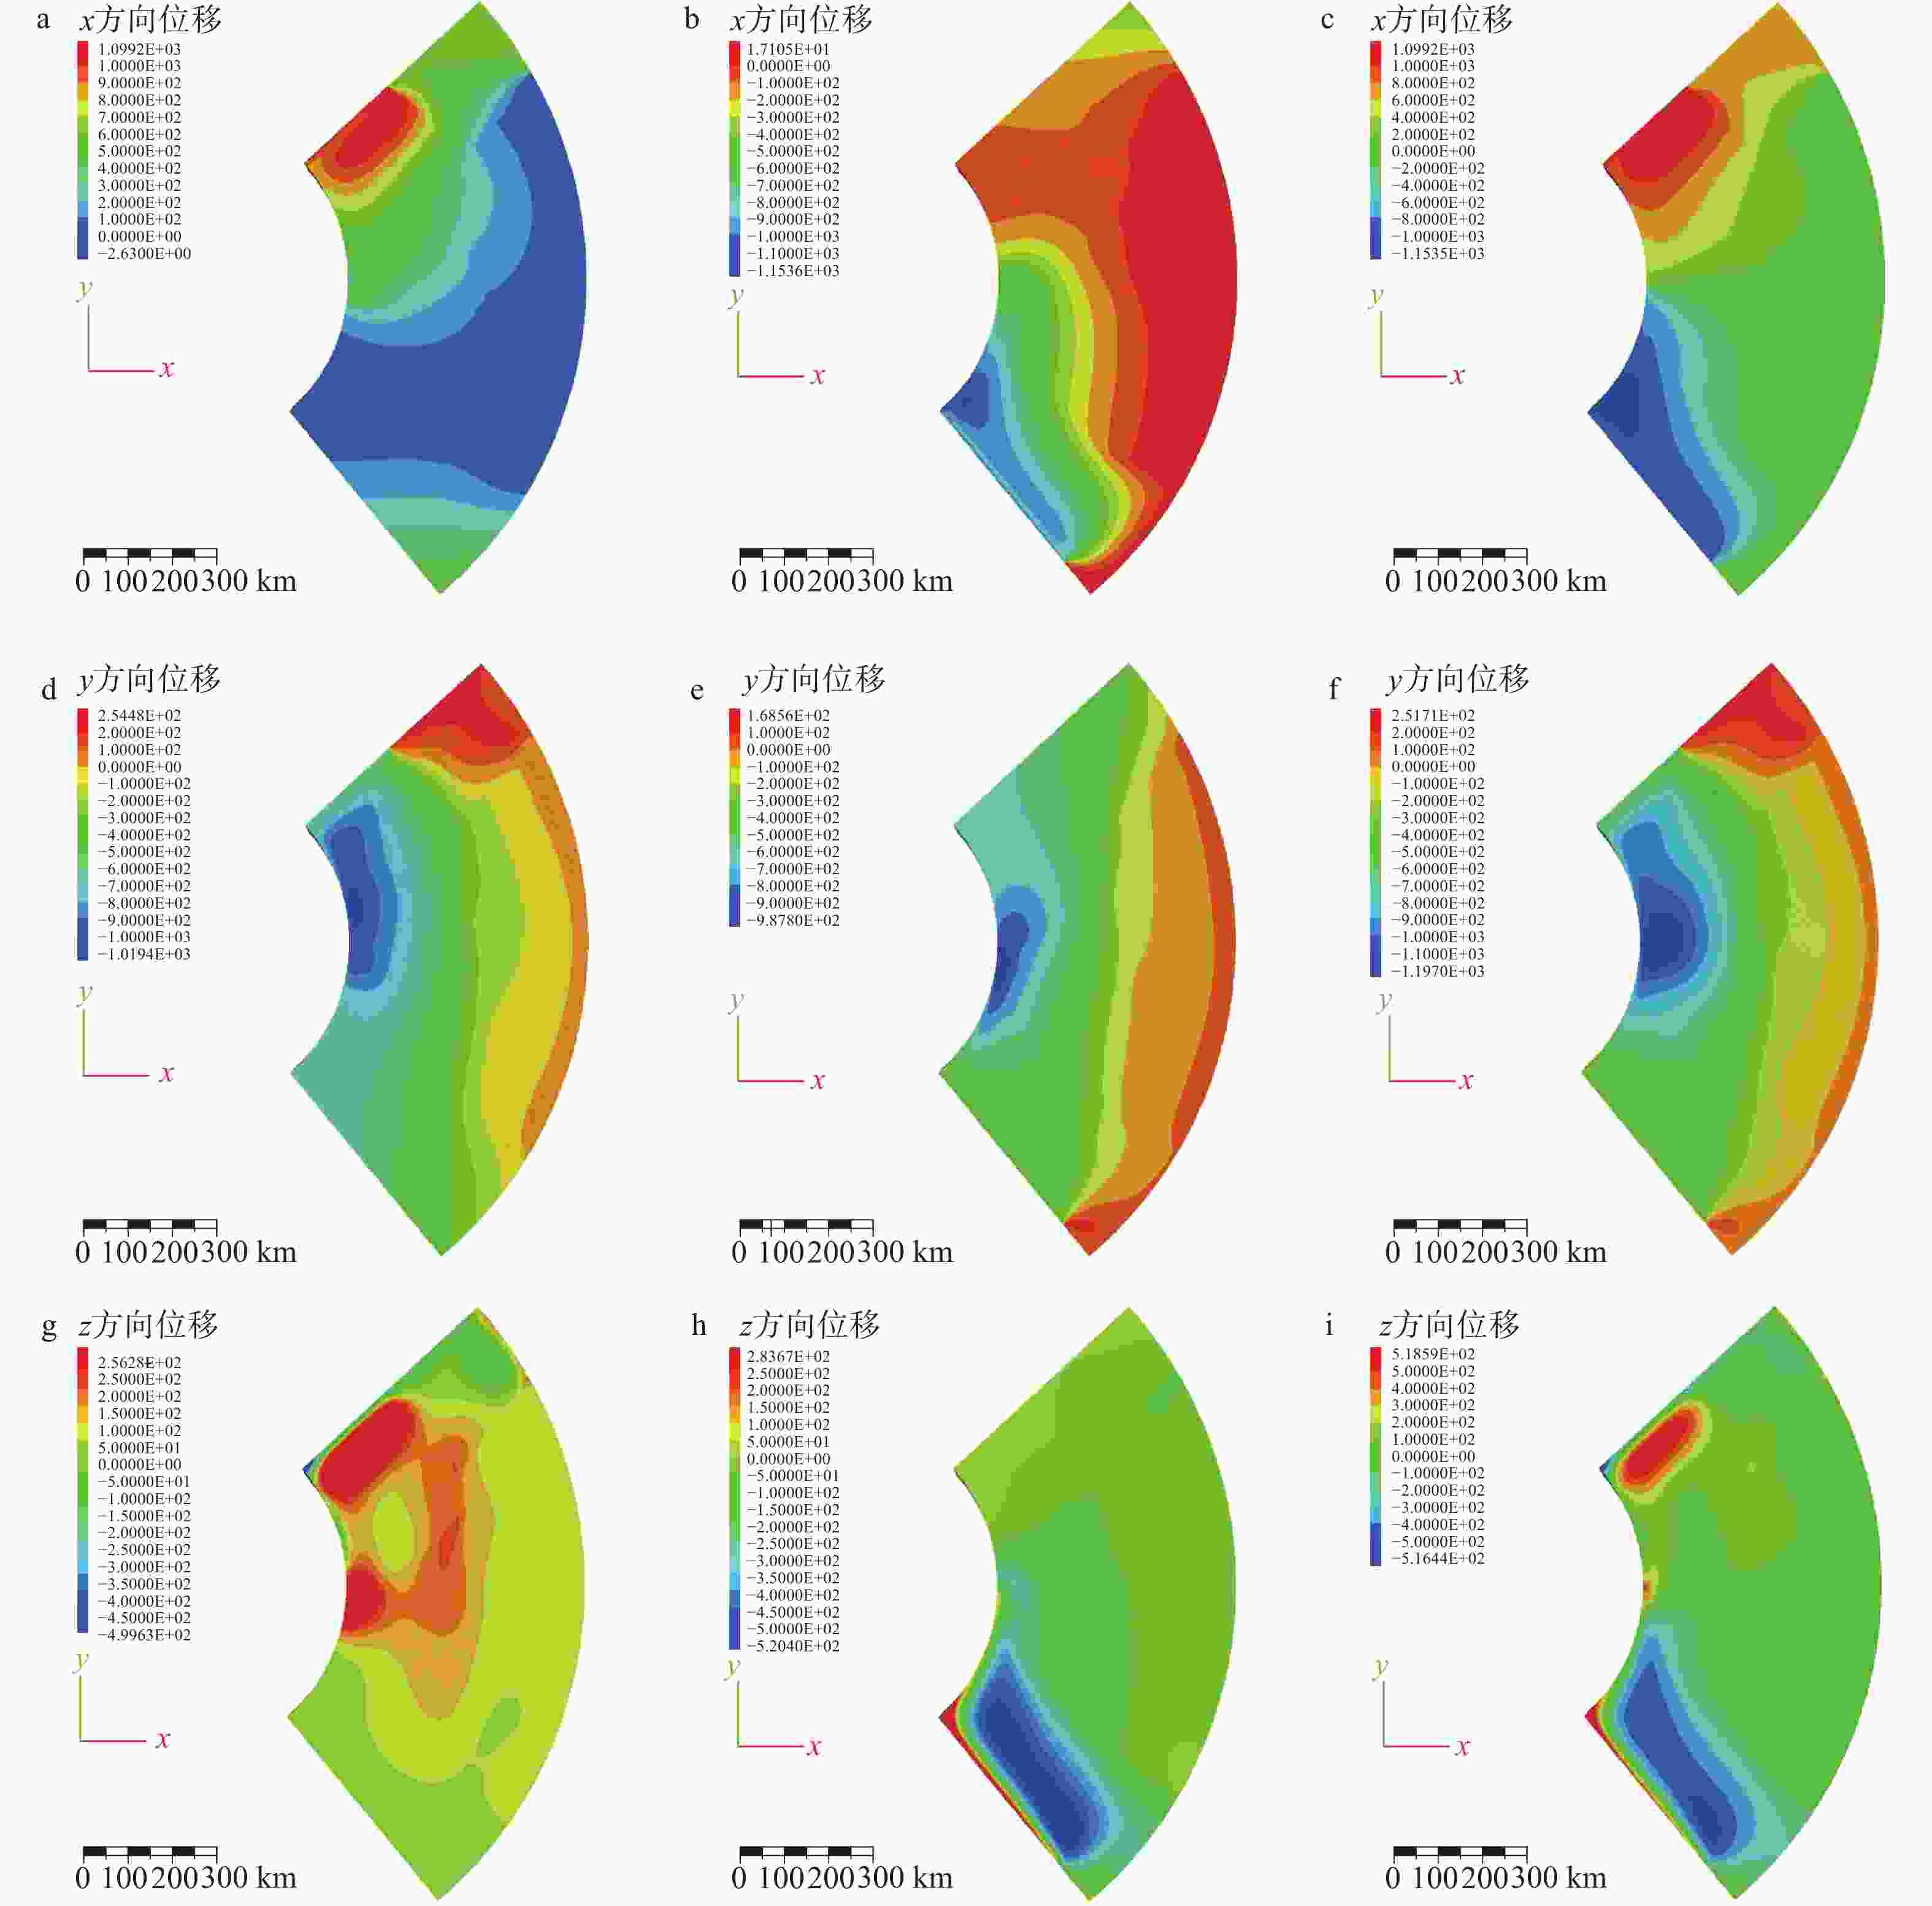
图 7 三维地质模型数值模拟x、y、z轴位移云图(考虑下地壳流)
位移大小及方向对应每个云图左上角的色标:正值表示沿x、y、z方向位移;负值表示沿x、y、z反方向位移;具体位移大小为该颜色对应的绝对值,单位为ma、d、g—模型一;b、e、h—模型二;c、f、I—模型三
Figure 7. Contour maps for numerical geological 3D simulations ( including lower crustal flow ) of x, y, and z axis displacement
(a), (d), (g) Model 1; (b), (e), (h) Model 2; (c), (f), (i) Model 3Displacement magnitudes and directions are given as absolute values in meters corresponding to the color bar in the top left corner of each contour map: positive values indicate displacement along the x, y, z direction; negative values indicate displacement along the opposite x, y, z direction.
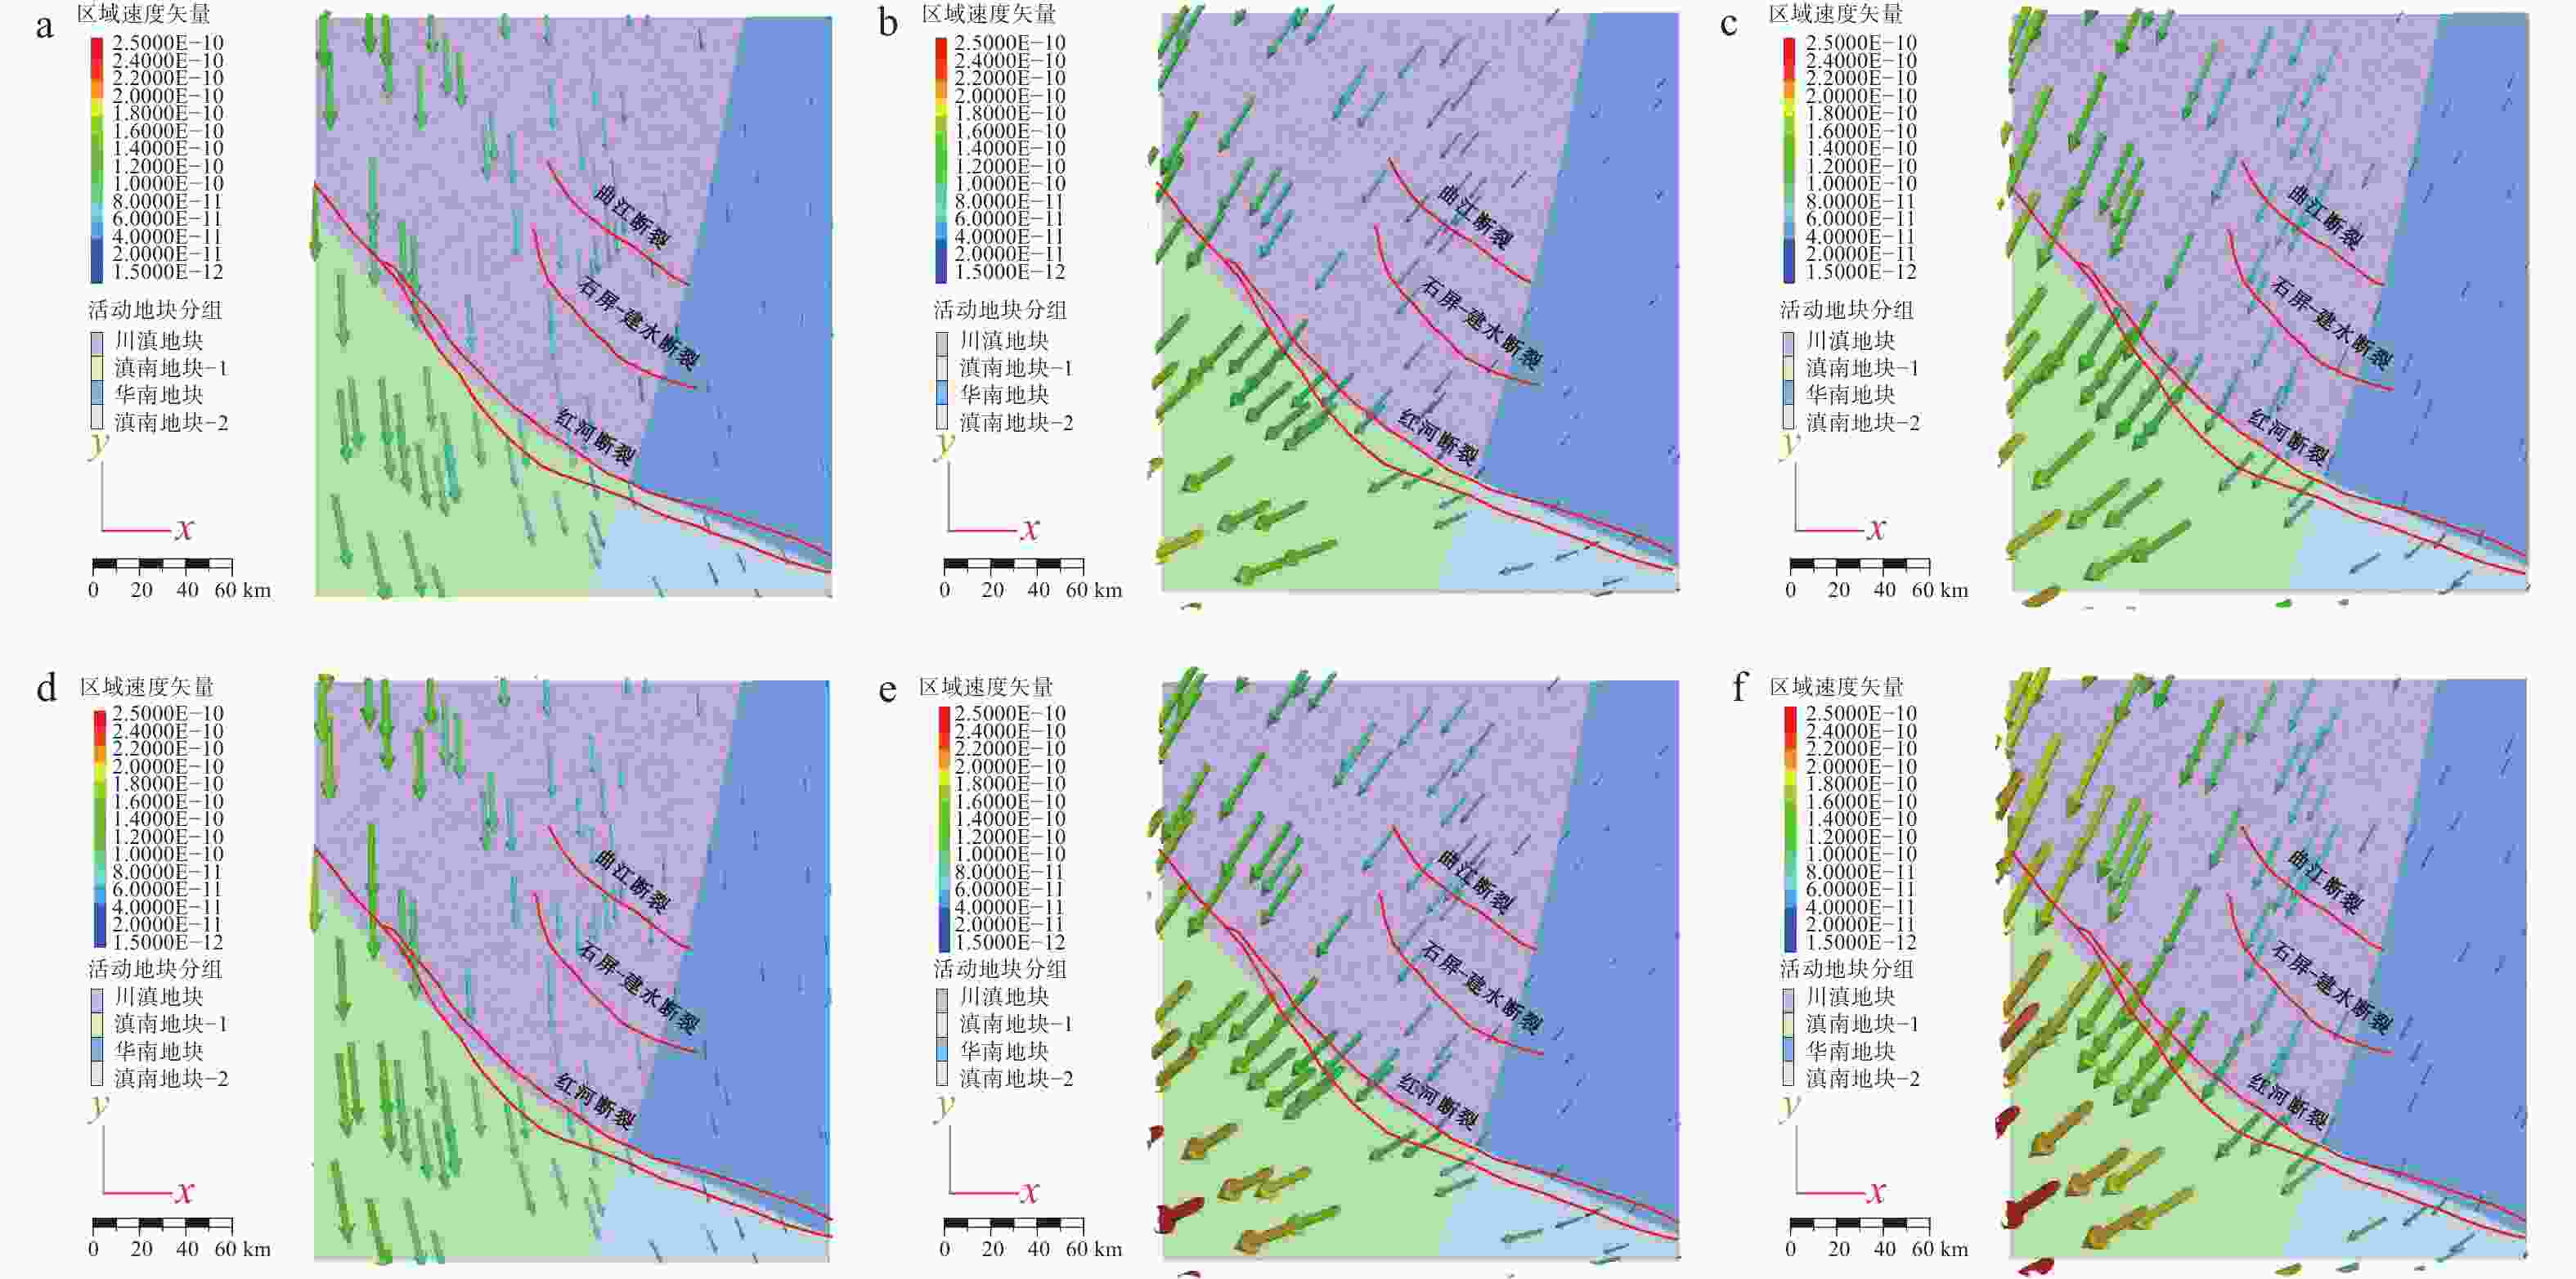
图 8 三维地质模型数值模拟速度矢量云图
箭头颜色和长度指示速度大小,具体数值对应每个云图左上角的色标,单位为m/s;箭头指向指示了速度矢量的方向a—模型一;b—模型二;c—模型三;d—模型四;e—模型五;f—模型六
Figure 8. Contour maps for numerical geological 3D simulations of velocity vectors
(a) Model 1; (b) Model 2; (c) Model 3; (d) Model 4; (e) Model 5; (f) Model 6Arrow colors and lengths indicate the velocity magnitude; specific values correspond to the color bar in the upper left corner of each cloud diagram; units are in m/s; arrows point to the direction of the velocity vectors.
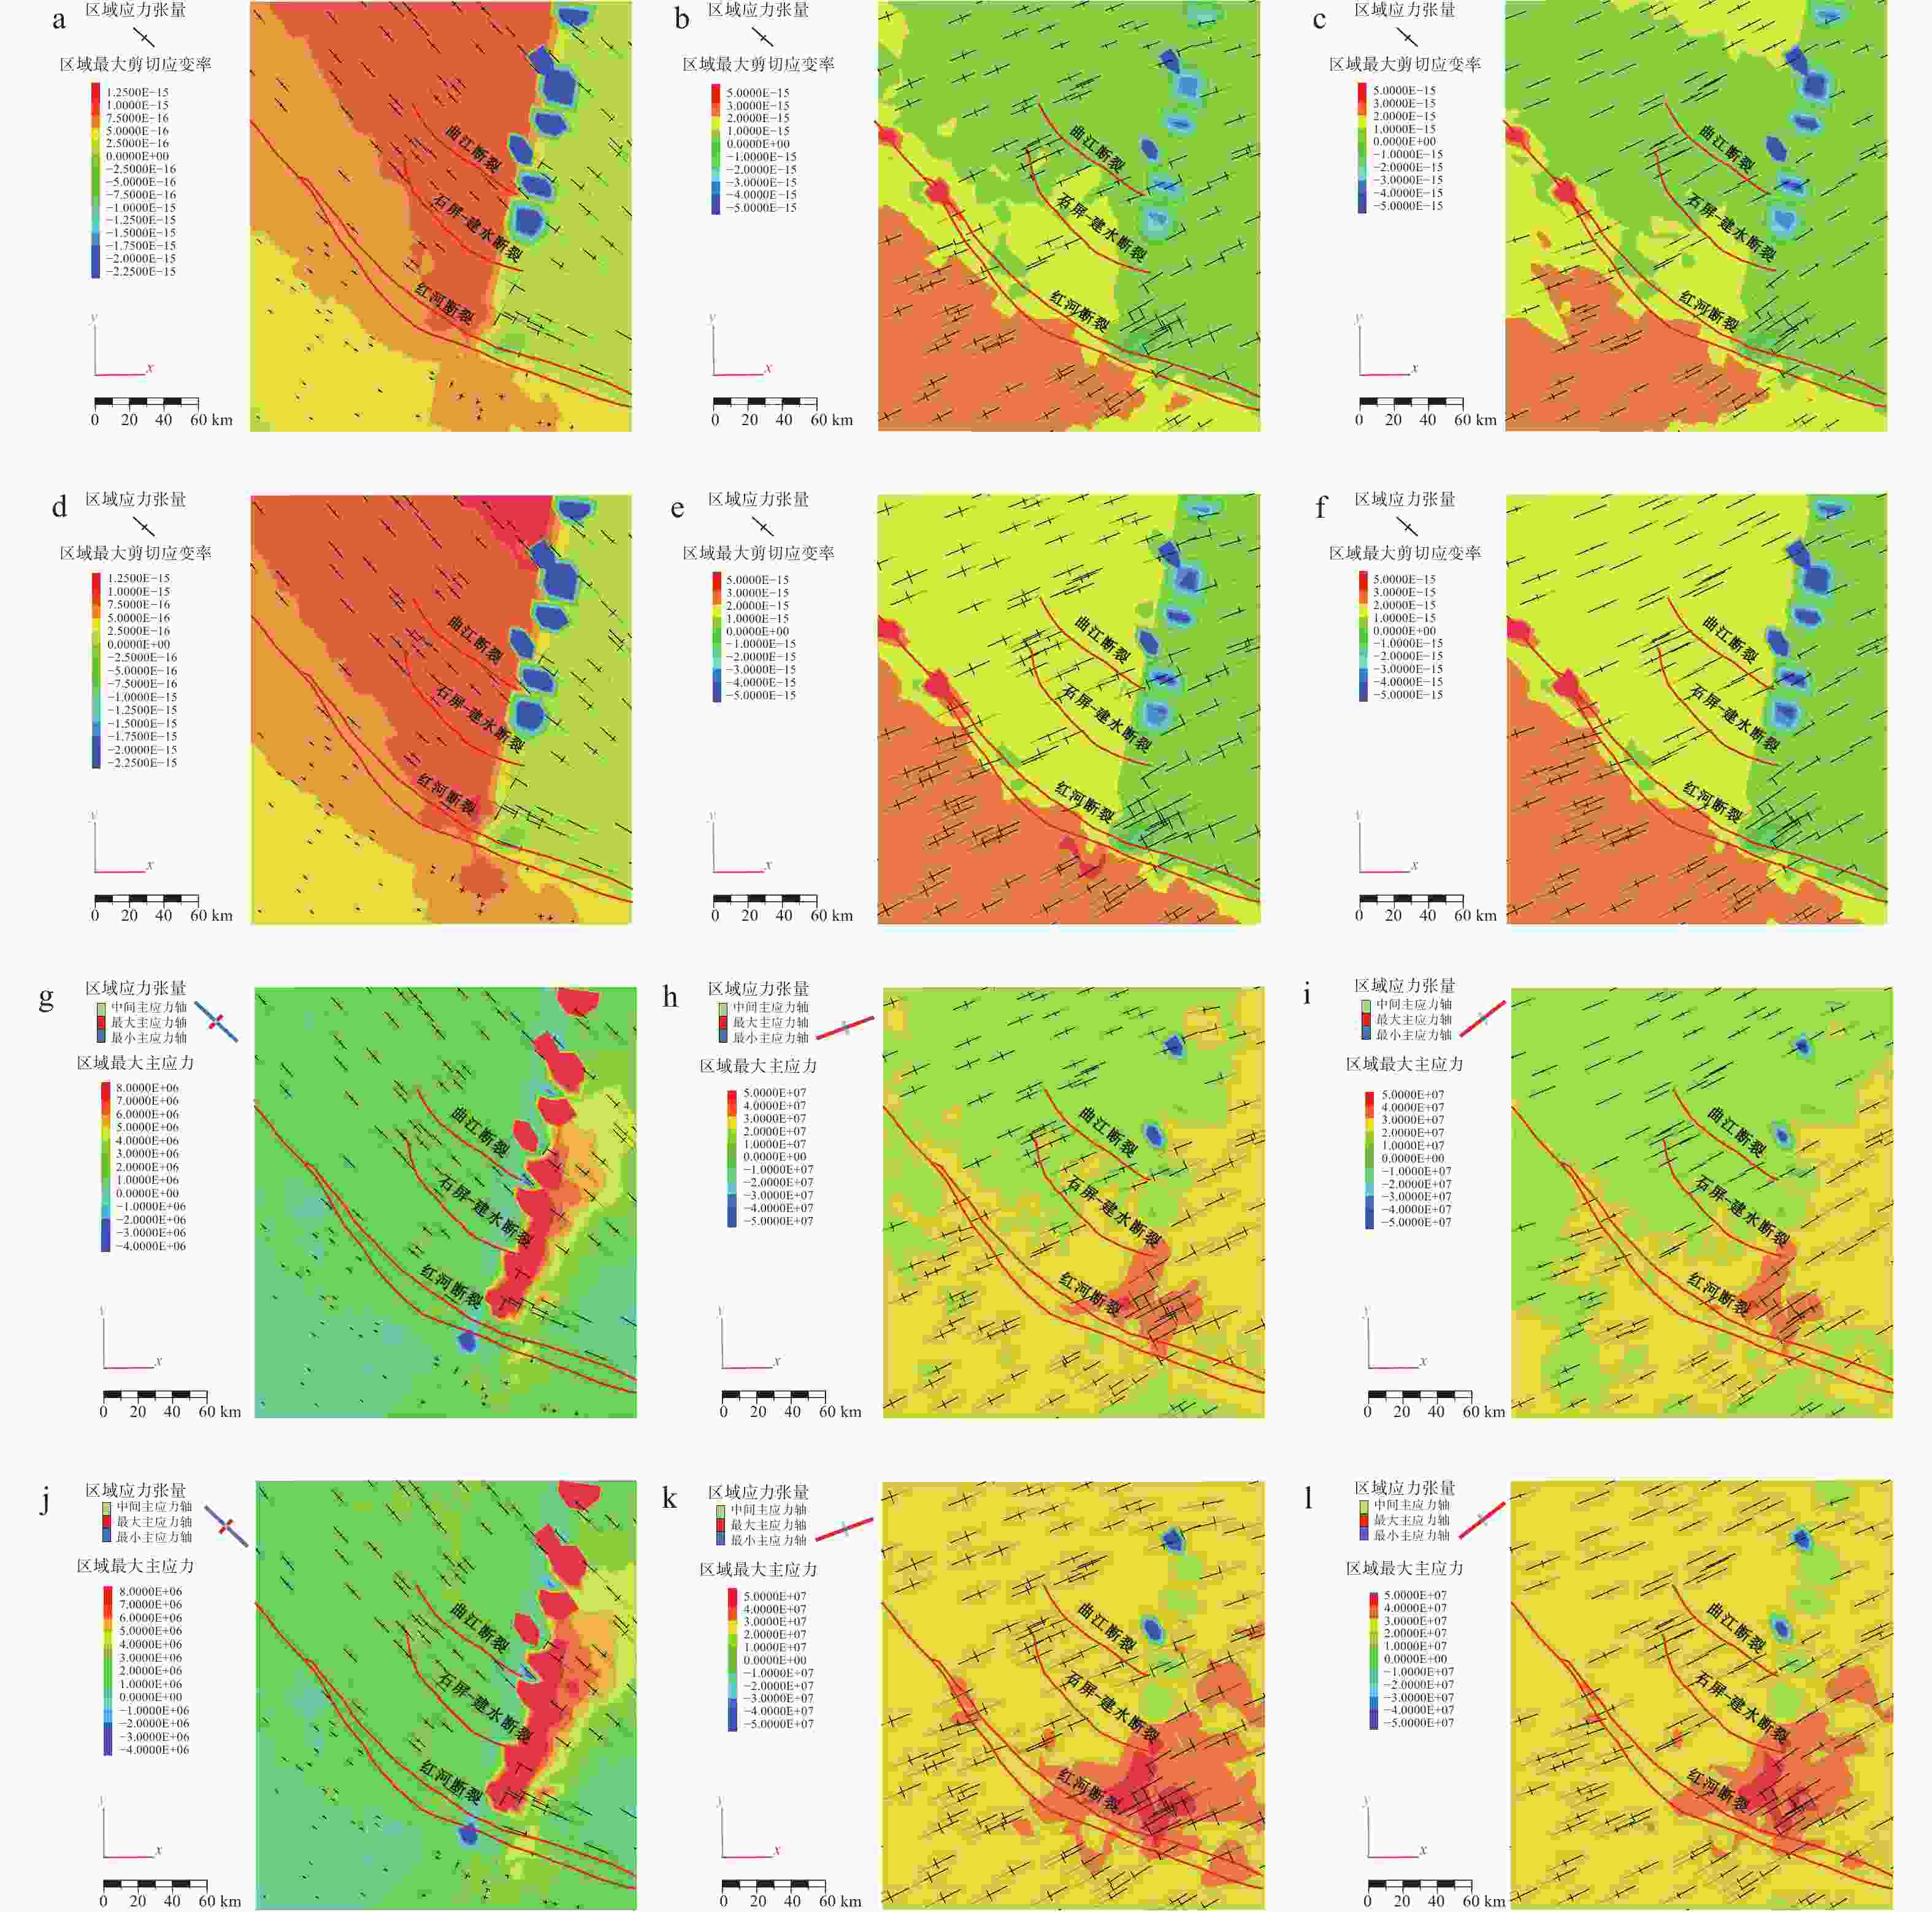
图 9 三维地质模型数值模拟最大剪切应变率及最大主应力云图
云图中叠加了对应的应力张量,用于指示最大、最小和中间主应力的方向及大小,其中g—l图例中提取了各主轴优势方向,并通过不同颜色进行区分(红色指示最大主应力轴,蓝色指示最小主应力轴,绿色指示中间主应力轴)a—f—6个模型近地表最大剪切应变率云图(最大剪切应变率的大小及剪切方向对应每个云图左侧的色标:正值表示顺时针方向;负值表示逆时针方向,最大剪切应变率具体数值为该颜色对应的绝对值,单位为s−1);g—l—6个模型近地表最大主应力云图(最大主应力的大小及特性对应每个云图左侧的色标:正值表示最大主应力方向为拉张;负值表示最大主应力方向为挤压,最大主应力具体数值为该颜色对应的绝对值,单位为Pa)
Figure 9. Contour maps for numerical geological 3D simulations of maximum shear strain rate and maximum principal stress
(a—f) Near-surface maximum shear strain rate contours of the six models (the magnitude and shear direction of the maximum shear strain rate are absolute values in s−1 and correspond to the color bar on the left side of each contour map: positive values indicate clockwise direction; negative values indicate counterclockwise direction); (g—l) near-surface maximum principal stress contours of the six models ( the magnitude and characteristics of the maximum principal stress are absolute values in Pa and correspond to the color bar on the left side of each contour map: positive values indicate tension in the direction of the maximum principal stress; negative values indicate compression in the direction of the maximum principal stress)The contour maps are superimposed with the corresponding stress tensors to indicate the direction and magnitude of the maximum, minimum, and intermediate principal stresses. In the legend from g to l, the dominant directions of each principal axis are extracted and distinguished by different colors (red indicates the maximum principal stress axis, blue indicates the minimum principal stress axis, and green indicates the intermediate principal stress axis).
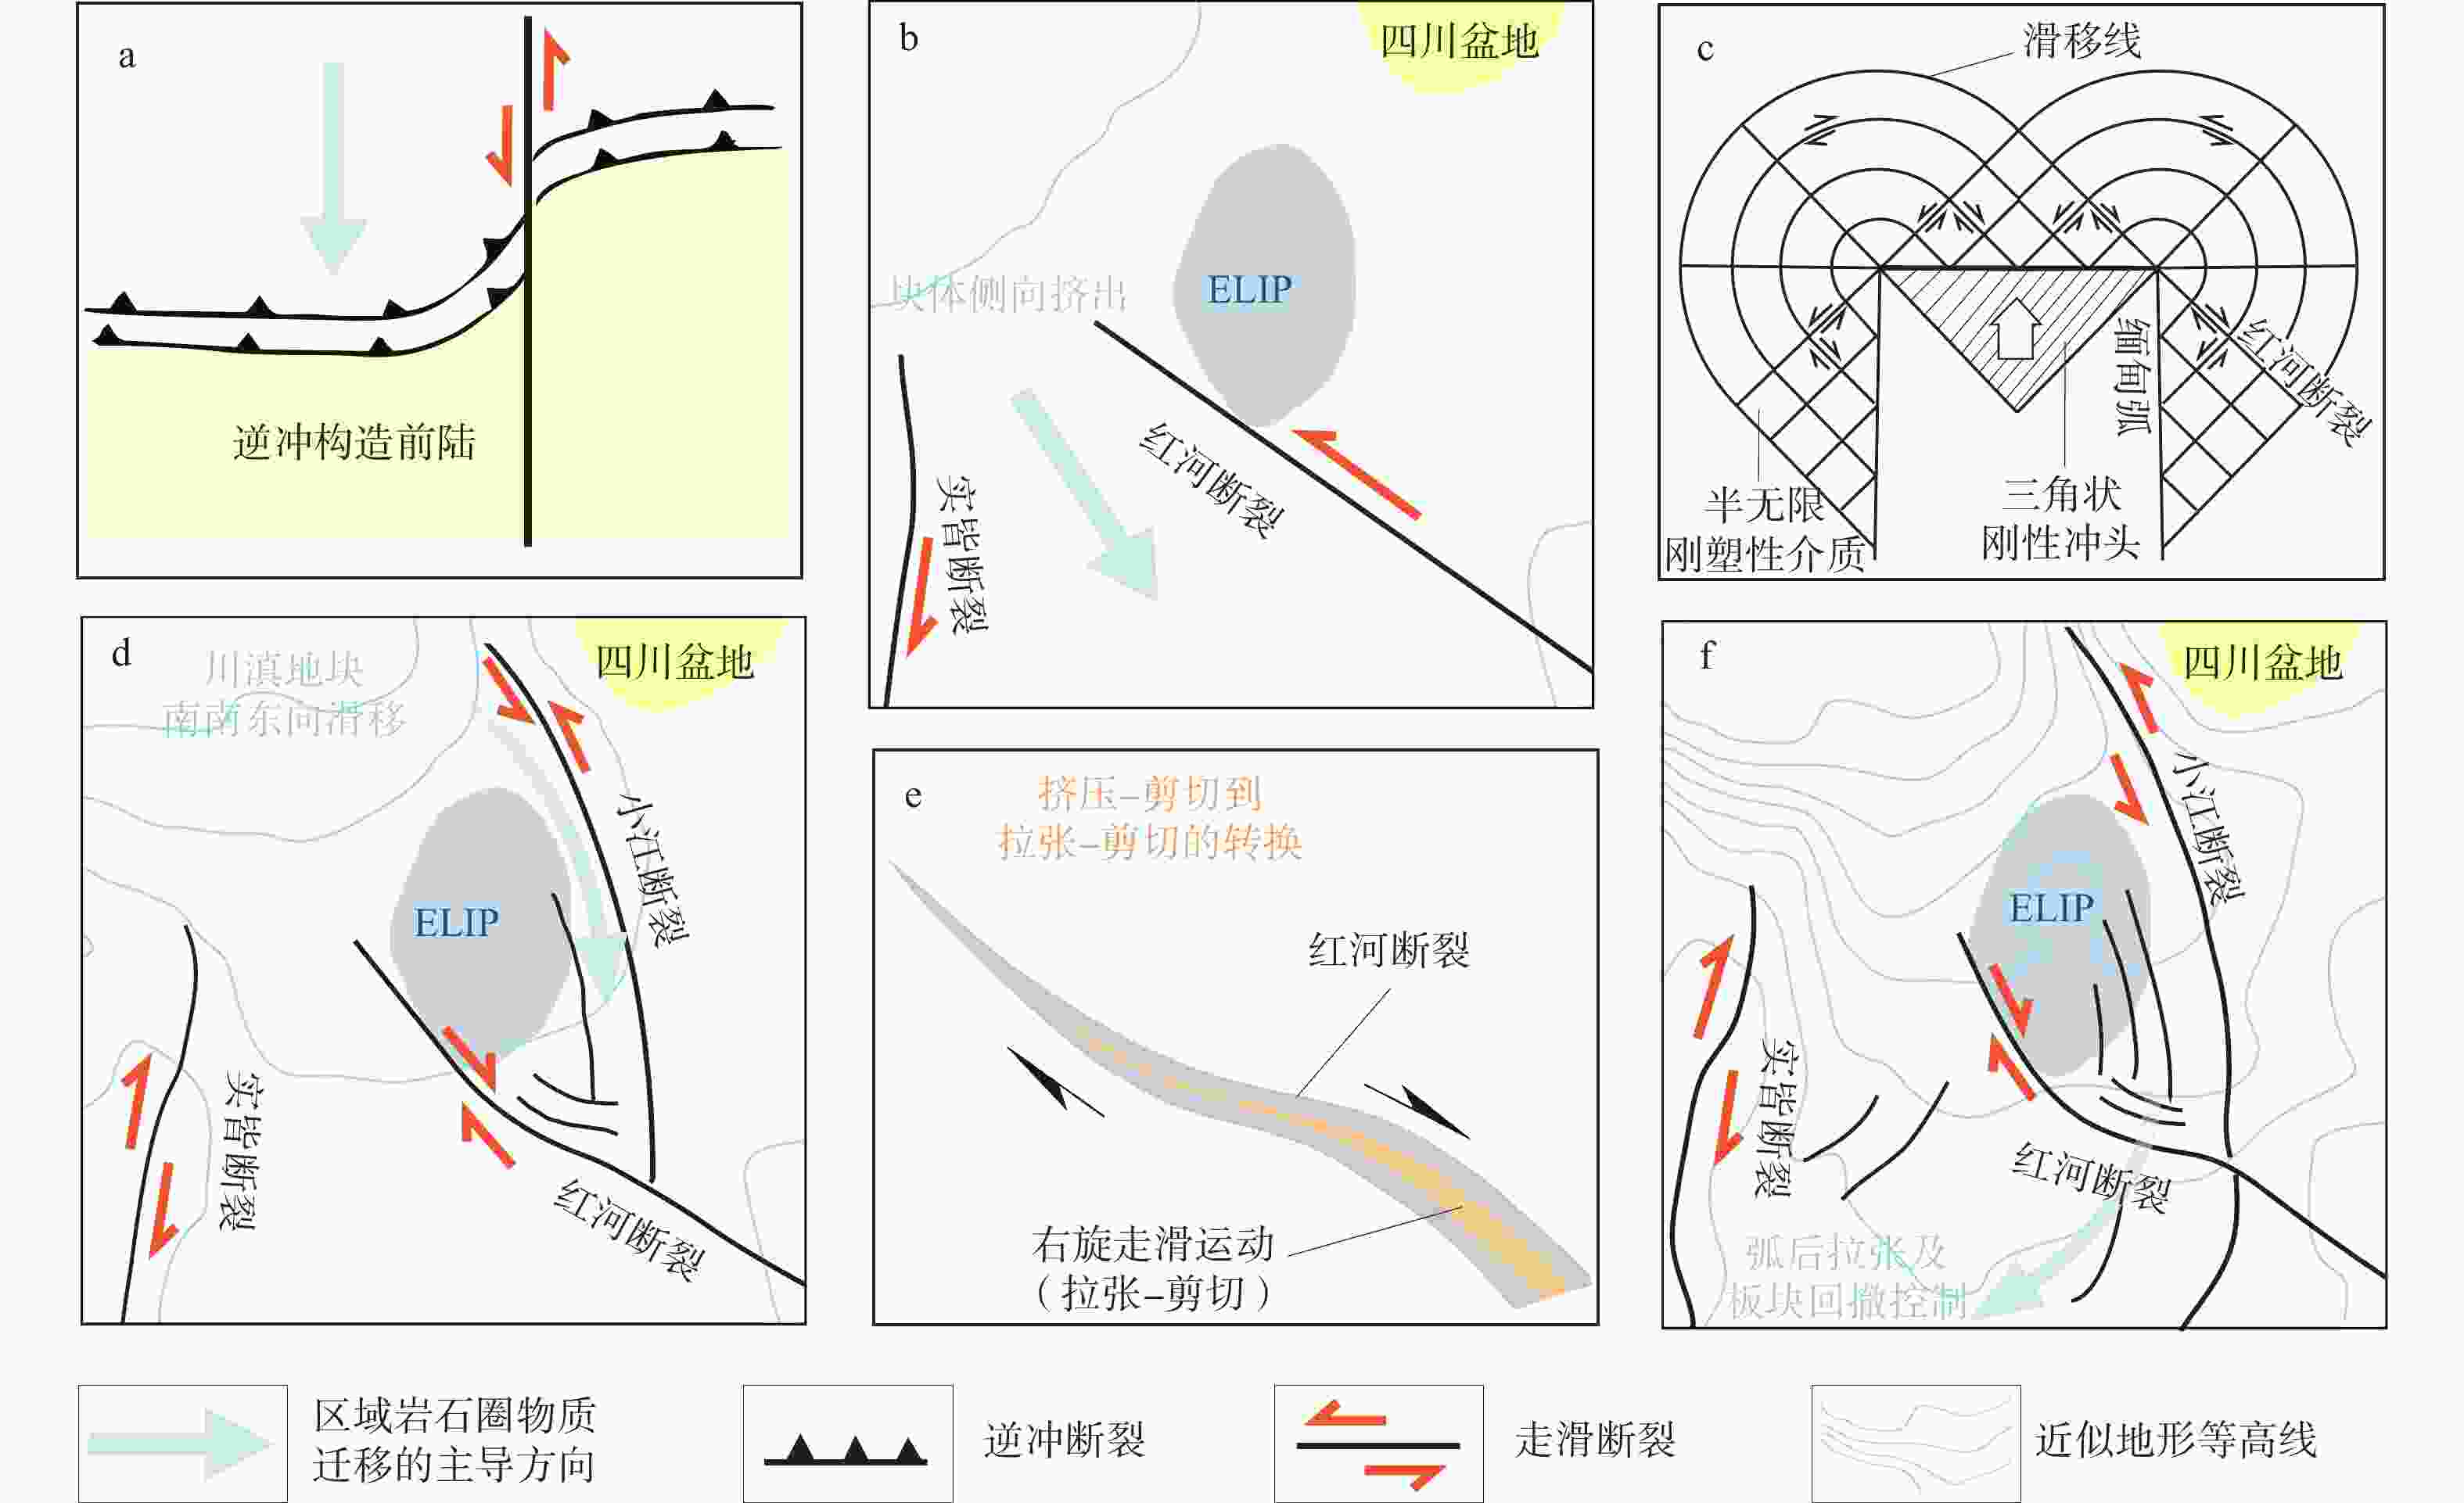
图 10 滇东南弧形构造形成与演化
a—受走滑断层控制的逆冲构造(修改自Macedo and Marshak,1999);b、d、f—滇东南弧形构造演化(图中浅蓝色近似地形等高线参考自Schoenbohm et al.,2006a;ELIP表示峨眉山大火成岩省的内区,范围圈定参考Xu et al.,2004);c—滑移线场模式(修改自Tapponnier and Molnar,1976,其中三角状刚性冲头用于类比印度板块,半无限刚塑性介质用于类比亚洲大陆,滑移线则指示了材料中的最大剪切应力和变形的位置);e—红河断裂中南段右旋走滑拉张−剪切变形示意图
Figure 10. Formation and evolution of the southeast Yunnan Arcuate Structural Belt
(a) Thrust structures controlled by a strike-slip fault (modified from Macedo and Marshark, 1999); (b), (d), (f) The evolution of southeast Yunnan Arcuate Structural Belt (the light blue areas are approximate topographic contours from Schoenbohm et al., 2006a; ELIP represents the inner zone of the Emeishan large igneous province, and its range is delineated with reference to Xu et al., 2004); (c) Slip-line field model (modified from Tapponnier and Molnar,1976, the triangular rigid punch is used to analogize the Indian Plate, the semi-infinite rigid-plastic medium is used to analogize the Asian Continent, and the slip lines indicate the locations of maximum shear stress and deformation in the material); (e) Schematic diagram of dextral strike-slip and transtension in the central and southern segments of the Red River fault
表 1 各构造单元(活动地块)的介质属性
Table 1. Material properties of each tectonic unit
地块/分层 深度/km P波速度/
(km/s)S波速度/
(km/s)密度/
(g/m3)泊松比 杨氏模量/
GPa剪切模量/
GPa黏滞系数/
(Pa·s)川滇
地块上地壳 16.1~27.0 6.00~6.10 3.52~3.55 2.72~2.74 0.238~0.244 83.419~85.908 33.702~34.531 1×10²²~3×10²² 下地壳 38.0~59.9 6.30~7.00 3.65~3.99 2.78~2.95 0.241~0.259 92.396~118.291 37.037~46.964 3×10²⁰~6×10²⁰ 岩石圈
地幔100.0 8.02~8.12 4.46~4.51 3.28~3.34 0.276~0.277 168.045~173.501 65.841~67.936 8×10²⁰~4×10²¹ 滇南
地块上地壳 14.59~17.38 6.00~6.10 3.52~3.55 2.72~2.74 0.238~0.244 83.419~85.908 33.702~34.531 5×10²¹ 下地壳 30.0~41.7 6.30~7.00 3.65~3.99 2.78~2.95 0.247~0.259 92.396~118.291 37.037~46.964 8×10²⁰ 岩石圈
地幔100.0 7.90~7.94 4.40~4.42 3.26~3.37 0.275~0.276 169.431~177.461 63.114~64.079 2×10²⁰ 华南
地块上地壳 21.02~22.80 6.00~6.10 3.52~3.55 2.72~2.74 0.238~0.244 83.419~85.908 33.702~34.531 1×10²³ 下地壳 38.0~46.8 6.30~7.00 3.65~3.99 2.78~2.95 0.247~0.259 92.396~118.291 37.037~46.964 1×10²² 岩石圈
地幔100.0 8.12~8.13 4.50~4.51 3.34~3.35 0.277~0.278 173.501~174.128 67.936~68.139 5×10²¹ 巴颜喀
拉地块上地壳 22.89~27.54 6.00~6.10 3.52~3.55 2.72~2.74 0.238~0.244 83.419~85.908 33.702~34.531 1×10²² 下地壳 53.2~59.0 6.30~7.00 3.65~3.99 2.78~2.95 0.241~0.259 92.396~118.291 37.037~46.964 1×10²⁰ 岩石圈
地幔100.0 7.96~8.01 4.43~4.45 3.28~3.30 0.276~0.277 164.226~166.871 64.370~65.348 9×10²⁰  下载: 导出CSV
表 2 模型边界条件设置方案
Table 2. Boundary condition setting of the model
模型名称 模型一 模型二 模型三 模型四 模型五 模型六 川滇地块速度边界 施加 未施加 施加 施加 未施加 施加 滇南地块速度边界 未施加 施加 施加 未施加 施加 施加 华南地块速度边界 施加 施加 施加 施加 施加 施加 巴颜喀拉地块速度边界 施加 未施加 施加 施加 未施加 施加 下地壳流影响 未考虑 未考虑 未考虑 考虑 考虑 考虑
下载: 导出CSV
-
[1] ALLEN C R, GILLESPIE A R, YUAN H, et al., 1984. Red River and associated faults, Yunnan Province, China: Quaternary geology, slip rates, and seismic hazard[J]. Geological Society of America Bulletin, 95(6): 686-700. doi: 10.1130/0016-7606(1984)95<686:RRAAFY>2.0.CO;2 [2] ALLMENDINGER R W, REILINGER R, LOVELESS J, 2007. Strain and rotation rate from GPS in Tibet, Anatolia, and the Altiplano[J]. Tectonics, 26(3): TC3013. [3] BAI D H, UNSWORTH M J, MEJU M A, et al., 2010. Crustal deformation of the eastern Tibetan plateau revealed by magnetotelluric imaging[J]. Nature Geoscience, 3(5): 358-362. doi: 10.1038/ngeo830 [4] BAI Z M, WANG C Y, 2003. Tomographic investigation of the upper crustal structure and seismotectonic environments in Yunnan Province[J]. Acta Seismologica Sinica, 25(2): 117-127. (in Chinese with English abstract [5] BAI Z M, WANG C Y, 2004. Tomography research of the Zhefang-Binchuan and Menglian-Malong wide—angle seismic profiles in Yunnan Province[J]. Chinese Journal of Geophysics, 47(2): 257-267. (in Chinese with English abstract [6] CAO J L, SHI Y L, ZHANG H, et al., 2009. Numerical simulation of GPS observed clockwise rotation around the eastern Himalayan syntax in the Tibetan Plateau[J]. Chinese Science Bulletin, 54(8): 1398-1410. (in Chinese with English abstract doi: 10.1007/s11434-008-0588-7 [7] CAO Y, FU H, QIAN J W, 2023. Characteristics of 3D velocity structure in the arcuate tectonic belt of southeastern Yunnan[J]. Journal of Seismological Research, 46(2): 245-260. (in Chinese with English abstract [8] CHANG L J, DING Z F, WANG C Y, 2015. Upper mantle anisotropy beneath the southern segment of North-South tectonic belt, China[J]. Chinese Journal of Geophysics, 58(11): 4052-4067. (in Chinese with English abstract [9] CHEN C Y, ZHAN W, LI X C, et al., 2024a. Block motion, slip rates, and earthquake hazard assessment of boundary faults in the Sichuan–Yunnan region, China[J]. Acta Geophysica, 72(6): 3831-3848. doi: 10.1007/s11600-024-01319-1 [10] CHEN Y Y, LI Z H, TANG K, et al., 2024b. Mechanism of metamorphic fluid expulsion from ductile contact aureole: Insights from numerical modeling of a growing mid-crustal magma chamber[J]. Earth and Planetary Science Letters, 626: 118545. doi: 10.1016/j.jpgl.2023.118545 [11] CHEN Z K, SU J B, LU Y, 2019. Application and trend of numerical simulation in dynamic study of orogenic belt in China[J]. Journal of Geomechanics, 25(2): 151-165. (in Chinese with English abstract [12] CLARK M K, ROYDEN L H, 2000. Topographic ooze : building the eastern margin of Tibet by lower crustal flow[J]. Geology, 28(8): 703-706. [13] CU'Ò'NG N, TOKARSKI A K, ŚWIERCZEWSKA A, et al., 2013. Late Tertiary tectonics of the Red River Fault Zone: Structural evolution of sedimentary rocks[J]. Journal of Geodynamics, 69: 31-53. doi: 10.1016/j.jog.2012.05.002 [14] DONG L, SHEN X Z, QIAN Y P, 2020. Study on velocity and density contrasts across the Moho in the southeastern margin of the Tibetan Plateau[J]. Chinese Journal of Geophysics, 63(3): 915-927. (in Chinese with English abstract [15] DONG X P, LI Z H, JING X H, et al., 2023. Stratigraphic sequence characteristics and geochronology research progress of the Cenozoic in the arcuate tectonic belt on the northeastern margin of the Tibet Plateau[J]. Journal of Geomechanics, 29(4): 465-484. (in Chinese with English abstract [16] FAN W J, ZHU Y, JI Y F, et al., 2023. Present-day tectonic stress evolution in southern Yunnan based on focal mechanisms[J]. Sensors, 23(17): 7406. doi: 10.3390/s23177406 [17] FERRILL D A, GROSHONG R H, 1993. Kinematic model for the curvature of the northern Subalpine Chain, France[J]. Journal of Structural Geology, 15(3-5): 523-541. doi: 10.1016/0191-8141(93)90146-2 [18] GAN W J, MOLNAR P, ZHANG P Z, et al., 2022. Initiation of clockwise rotation and eastward transport of southeastern Tibet inferred from deflected fault traces and GPS observations[J]. GSA Bulletin, 134(5-6): 1129-1142. doi: 10.1130/B36069.1 [19] GAO Y, SHI Y T, WANG Q, 2020. Seismic anisotropy in the southeastern margin of the Tibetan Plateau and its deep tectonic significances[J]. Chinese Journal of Geophysics, 63(3): 802-816. (in Chinese with English abstract [20] GE J, SHI X H, CHEN H L, et al., 2022. Two kinematic transformations of the Pamir salient since the Mid-Cenozoic: constraints from multi-timescale deformation analysis[J]. Frontiers in Earth Science, 10: 967529. doi: 10.3389/feart.2022.967529 [21] HAN S, WU Z H, WANG S F, et al., 2024. Late Quaternary surface deformation and tectonic implications of the Bue Co strike-slip fault system in central-western Qiangtang block[J]. Journal of Geomechanics, 30(2): 298-313. (in Chinese with English abstract [22] HAN X M, CHAI T J, XIAO J A, et al., 1982. Neotectonic movement of the central part of the Shiping-Jianshui Fault in Yunnan Province and earthquake[J]. Journal of Seismological Research, 5(2): 220-225. (in Chinese with English abstract [23] HAO M, WANG Q L, SHEN Z K, et al., 2014. Present day crustal vertical movement inferred from precise leveling data in eastern margin of Tibetan Plateau[J]. Tectonophysics, 632: 281-292. doi: 10.1016/j.tecto.2014.06.016 [24] HE H L, LI P, FANG Z J, 1992. Analysis of seismogenic conditions in the wedge tectonic region of Southeast Yunnan Province[J]. Seismology and Geology, 13(3): 217-226. (in Chinese with English abstract [25] HU N, HAN Z J, 2013. Seismological study on behaviors of present-day movement of arcuate tectonic belt in Southeast Yunnan[J]. Seismology and Geology, 35(1): 1-21. (in Chinese with English abstract [26] HUANG Z C, JI C, WU H T, et al., 2021. Review on the crustal structures and deformations in the southeastern margin of the Tibetan Plateau[J]. Reviews of Geophysics and Planetary Physics, 52(3): 291-307. (in Chinese with English abstract [27] JIAO L Q, TAPPONNIER P, DONZÉ F V, et al., 2023. Discrete element modeling of southeast Asia's 3D lithospheric deformation during the Indian collision[J]. Journal of Geophysical Research: Solid Earth, 128(1): e2022JB025578. doi: 10.1029/2022JB025578 [28] JIAO L Q, TAPPONNIER P, MCCALLUM A C C, et al., 2024. The shape of the Himalayan “Arc”: an ellipse pinned by syntaxial strike-slip fault tips[J]. Proceedings of the National Academy of Sciences of the United States of America, 121(4): e2313278121. [29] KAN R J, ZHANG S C, YAN F T, et al., 1977. Present tectonic stress field and its relation to the characteristics of recent tectonic activity in southwestern China[J]. Acta Geophysica Sinica, 20(2): 96-109. (in Chinese with English abstract [30] LAI K Y, CHEN Y G, LÂM D Đ, 2012. Pliocene-to-present morphotectonics of the Dien Bien Phu fault in northwest Vietnam[J]. Geomorphology, 173-174: 52-68. doi: 10.1016/j.geomorph.2012.05.026 [31] LELOUP P H, LACASSIN R, TAPPONNIER P, et al., 1995. The Ailao Shan-Red river shear zone (Yunnan, China), tertiary transform boundary of Indochina[J]. Tectonophysics, 251(1-4): 3-84. doi: 10.1016/0040-1951(95)00070-4 [32] LELOUP P H, ARNAUD N, LACASSIN R, et al., 2001. New constraints on the structure, thermochronology, and timing of the Ailao Shan‐Red River shear zone, SE Asia[J]. Journal of Geophysical Research: Solid Earth, 106(B4): 6683-6732. doi: 10.1029/2000JB900322 [33] LI L, 2015. Study on the activity of the Xiaojian-Dianbianfu fault[D]. Kunming: Yunnan University. (in Chinese) [34] LI L Y, ZHAN W, CHEN C Y, et al., 2023. Stress-strain characteristics before the 2021 Ms 6.4 Yangbi earthquake in Yunnan Province, China, and implications for the seismogenic mechanism[J]. Pure and Applied Geophysics, 180(7): 2543-2559. doi: 10.1007/s00024-023-03314-x [35] LI S G, 1954. Vortex structure and other problems relating to the compounding of geotectonic systems of northwestern China[J]. Acta Geological Sinica, 34(4): 339-410. (in Chinese) [36] LI S H, HUANG B C, ZHU R X, 2012. Paleomagnetic constraints on the tectonic rotation of the southeastern margin of the Tibetan Plateau[J]. Chinese Journal of Geophysics, 55(1): 76-94. (in Chinese with English abstract doi: 10.1002/cjg2.1702 [37] LI X, RAN Y K, CHEN L C, et al., 2016. The Holocene seismic evidence on southern segment of the Red River fault zone[J]. Seismology and Geology, 38(3): 596-604. (in Chinese with English abstract [38] LI Y F, QU G S, ZHANG J, 2007. Developments in research of arcuate structure[J]. Advances in Earth Sciences, 22(7): 708-715. (in Chinese with English abstract [39] LI Z H, 2014. A review on the numerical geodynamic modeling of continental subduction, collision and exhumation[J]. Science China Earth Sciences, 57(1): 47-69. doi: 10.1007/s11430-013-4696-0 [40] LI Z H, LIU M Q, GERYA T, 2015. Material transportation and fluid-melt activity in the subduction channel: numerical modeling[J]. Science China Earth Sciences, 58(8): 1251-1268. doi: 10.1007/s11430-015-5123-5 [41] LI Z J, WANG Y, GAN W J, et al., 2020. Diffuse deformation in the SE Tibetan Plateau: new insights from geodetic observations[J]. Journal of Geophysical Research: Solid Earth, 125(10): e2020JB019383. doi: 10.1029/2020JB019383 [42] LIN G, ZHAO C B, ZHANG Y H, et al., 2005. The principle, method and related research progress on the numerical modeling of geological structural deformation[J]. Advance in Earth Sciences, 20(5): 549-555. (in Chinese with English abstract [43] LIU M, YANG Y Q, STEIN S, et al., 2000. Crustal shortening in the Andes: why do GPS rates differ from geological rates?[J]. Geophysical Research Letters, 27(18): 3005-3008. doi: 10.1029/2000GL008532 [44] LIU X X, SHAO Z G, 2020. Current fault movement characteristics in the Lijiang-Xiaojinhe fault zone[J]. Chinese Journal of Geophysics, 63(3): 1117-1126. (in Chinese with English abstract [45] MA H Y, LUO A X, WANG C Y, et al., 2022. Formation and evolution characteristics of arcuate tectonic belt[J]. Journal of Xi'an University of Science and Technology, 42(4): 752-759. (in Chinese with English abstract [46] MACEDO J, MARSHAK S, 1999. Controls on the geometry of fold-thrust belt salients[J]. Geological Society of America Bulletin, 111(12): 1808-1822. doi: 10.1130/0016-7606(1999)111<1808:COTGOF>2.3.CO;2 [47] MARSHAK S, 1988. Kinematics of orocline and arc formation in thin-skinned orogens[J]. Tectonics, 7(1): 73-86. doi: 10.1029/TC007i001p00073 [48] NING S X, CHEN Y S, 2023. Is there an interconnected lower crustal channel flow beneath southeastern margin of Tibetan Plateau?[J]. Acta Scientiarum Naturalium Universitatis Pekinensis, 59(3): 395-406. (in Chinese with English abstract [49] PEI X, LI Z H, SHI Y L, 2021. Formation mechanism of arcuate tectonic structures around Northeast Tibetan Plateau: insight from 3‐D numerical modeling[J]. Terra Nova, 33(4): 345-355. doi: 10.1111/ter.12519 [50] QIAO L, YAO H J, LAI Y C, et al., 2018. Crustal structure of Southwest China and northern Vietnam from ambient noise tomography: implication for the large‐scale material transport model in SE Tibet[J]. Tectonics, 37(5): 1492-1506. doi: 10.1029/2018TC004957 [51] REN L L, ZHANG B, ZHENG D W, et al., 2020. Tectonic transformation and its exhumation history of the Ailao Shan-Red River shear zone in Oligocene: Evidences from apatite fission track thermochronology of the southern segment of the Ailao Shan range[J]. Acta Petrologica Sinica, 36(6): 1787-1802. (in Chinese with English abstract doi: 10.18654/1000-0569/2020.06.09 [52] REPLUMAZ A, LACASSIN R, TAPPONNIER P, et al., 2001. Large river offsets and Plio-Quaternary dextral slip rate on the Red River fault (Yunnan, China)[J]. Journal of Geophysical Research: Solid Earth, 106(B1): 819-836. doi: 10.1029/2000JB900135 [53] SCHELLART W P, CHEN Z, STRAK V, et al., 2019. Pacific subduction control on Asian continental deformation including Tibetan extension and eastward extrusion tectonics[J]. Nature Communications, 10(1): 4480. doi: 10.1038/s41467-019-12337-9 [54] SCHOENBOHM L M, BURCHFIEL B C, LIANGZHONG C, et al., 2006a. Miocene to present activity along the Red River fault, China, in the context of continental extrusion, upper-crustal rotation, and lower-crustal flow[J]. GSA Bulletin, 118(5-6): 672-688. doi: 10.1130/B25816.1 [55] SCHOENBOHM L M, BURCHFIEL B C, LIANGZHONG C, et al., 2006b. Propagation of surface uplift, lower crustal flow, and Cenozoic tectonics of the southeast margin of the Tibetan Plateau[J]. Geology, 34(10): 813-816. doi: 10.1130/G22679.1 [56] SHEN Z K, LÜ J, WANG M, et al., 2005. Contemporary crustal deformation around the southeast borderland of the Tibetan Plateau[J]. Journal of Geophysical Research: Solid Earth, 110(B11): 1-17. [57] SHI X H, SIEH K, WELDON R, et al., 2018. Slip rate and rare large prehistoric earthquakes of the Red River fault, southwestern China[J]. Geochemistry, Geophysics, Geosystems, 19(7): 2014-2031. doi: 10.1029/2017GC007420 [58] SHI Y T, GAO Y, SU Y J, et al., 2012. Shear-wave splitting beneath Yunnan area of Southwest China[J]. Earthquake Science, 25(1): 25-34. doi: 10.1007/s11589-012-0828-4 [59] SHU Y H, SHI X H, HAINES S, et al., 2024. Illite K‐Ar dating of the Leibo fault zone, southeastern margin of the Tibetan Plateau: Implications for the quasi‐synchronous far‐field tectonic response to the India‐Asia collision[J]. Geophysical Research Letters, 51(6): e2023GL108027. doi: 10.1029/2023GL108027 [60] SUN Y, NIU F, LIU H, et al., 2012. Crustal structure and deformation of the SE Tibetan plateau revealed by receiver function data[J]. Earth and Planetary Science Letters, 349-350: 186-197. doi: 10.1016/j.jpgl.2012.07.007 [61] TAN X H, SONG C Z, ZHA F S, et al., 2010. Application of numerical simulation in tectonic deformation research[J]. Journal of Hefei University of Technology (Natural Science), 33(12): 1851-1857. (in Chinese with English abstract [62] TAPPONNIER P, MOLNAR P, 1976. Slip-line field theory and large-scale continental tectonics[J]. Nature, 264(5584): 319-324. doi: 10.1038/264319a0 [63] TAPPONNIER P, PELTZER G, LE DAIN A Y, et al., 1982. Propagating extrusion tectonics in Asia: new insights from simple experiments with plasticine[J]. Geology, 10(12): 611-616. doi: 10.1130/0091-7613(1982)10<611:PETIAN>2.0.CO;2 [64] TAPPONNIER P, LACASSIN R, LELOUP P H, et al., 1990. The Ailao Shan/Red River metamorphic belt: tertiary left-lateral shear between Indochina and South China[J]. Nature, 343(6257): 431-437. doi: 10.1038/343431a0 [65] TAPPONNIER P, XU Z Q, ROGER F, et al., 2001. Oblique stepwise rise and growth of the Tibet Plateau[J]. Science, 294(547): 1671-1677. [66] WAN Y K, SHEN X Q, LIU R F, et al., 2021. Present slip and stress distribution of block boundary faults in the Sichuan-Yunnan region[J]. Seismology and Geology, 43(6): 1614-1637. (in Chinese with English abstract [67] WANG A, WANG G C, WANG T L, et al., 2023. Cenozoic tectonics and geomorphic evolution of the lower Jinsha River on the southeastern margin of the Tibetan Plateau[J]. Journal of Geomechanics, 29(4): 453-464. (in Chinese with English abstract [68] WANG C Y, ZHU C N, LIU Y Q, 1978. Determination of earthquake fault parameter for the Tonghai earthquake from ground deformation data[J]. Acta Geophysica Sinica, 21(3): 191-198. (in Chinese with English abstract [69] WANG C Y, HAN W B, WU J P, et al., 2007. Crustal structure beneath the eastern margin of the Tibetan Plateau and its tectonic implications[J]. Journal of Geophysical Research: Solid Earth, 112(B7): B07307. [70] WANG E, BURCHFIEL B C, ROYDEN L H, et al. , 1998. Late Cenozoic Xianshuihe-Xiaojiang, Red River, and Dali fault systems of southwestern Sichuan and central Yunnan, China[M]. Geological Society of America. [71] WANG H, CAO J L, ZHANG H, et al., 2007. Numerical simulation of the influence of lower-crustal flow on the deformation of the Sichuan-Yunnan region[J]. Acta Seismologica Sinica, 29(6): 581-591. (in Chinese with English abstract [72] WANG R R, XU Z Q, LIANG F H, 2013. Origin of the Dabashan salient: evidence from numerical modelling[J]. Acta Geologica Sinica, 87(10): 1489-1497. (in Chinese with English abstract [73] WANG Y, ZHANG B, HOU J J, et al., 2014. Structure and tectonic geomorphology of the Qujiang fault at the intersection of the Ailao Shan–Red River fault and the Xianshuihe–Xiaojiang fault system, China[J]. Tectonophysics, 634: 156-170. doi: 10.1016/j.tecto.2014.07.031 [74] WANG Y, ZHANG B, SCHOENBOHM L M, et al., 2016. Late Cenozoic tectonic evolution of the Ailao Shan‐Red River fault (SE Tibet): implications for kinematic change during plateau growth[J]. Tectonics, 35(8): 1969-1988. doi: 10.1002/2016TC004229 [75] WANG Y, WANG Y J, SCHOENBOHM L M, et al., 2020. Cenozoic exhumation of the Ailaoshan‐Red River shear zone: New insights from low-temperature thermochronology[J]. Tectonics, 39(9): e2020TC006151. doi: 10.1029/2020TC006151 [76] WANG Y, WANG Y J, ZHANG P Z, et al., 2022. Cenozoic tectonic evolution of regional fault systems in the SE Tibetan Plateau[J]. Science China Earth Sciences, 65(4): 601-623. doi: 10.1007/s11430-021-9880-3 [77] WANG Y Z, WANG E N, SHEN Z K, et al., 2008. GPS-constrained inversion of present-day slip rates along major faults of the Sichuan-Yunnan region, China[J]. Science in China Series D: Earth Sciences, 51(9): 1267-1283. (in Chinese with English abstract doi: 10.1007/s11430-008-0106-4 [78] WEI W X, 2013. Study on mechanisms and characteristics of major faults in the eastern boundary of the Sichuan-Yunnan block[D]. Beijing: Institute of Geology, China Earthquake Administration. (in Chinese with English abstract [79] WEN X Z, MA S L, XU X W, et al., 2008. Historical pattern and behavior of earthquake ruptures along the eastern boundary of the Sichuan-Yunnan faulted-block, southwestern China[J]. Physics of the Earth and Planetary Interiors, 168(1-2): 16-36. doi: 10.1016/j.pepi.2008.04.013 [80] WEN X Z, DU F, LONG F, et al., 2011. Tectonic dynamics and correlation of major earthquake sequences of the Xiaojiang and Qujiang-Shiping fault systems, Yunnan, China[J]. Science China Earth Sciences, 54(10): 1563-1575. doi: 10.1007/s11430-011-4231-0 [81] WU H L, SHI W, DONG S W, et al., 2009. A numerical simulating study of mechanical characteristic of superposed deformation in Daba Mountain Foreland[J]. Earth Science Frontiers, 16(3): 190-196. (in Chinese with English abstract doi: 10.1016/S1872-5791(08)60088-3 [82] WU Z H, LONG C X, FAN T Y, et al., 2015. The arc rotational-shear active tectonic system on the southeastern margin of Tibetan Plateau and its dynamic characteristics and mechanism[J]. Geological Bulletin of China, 34(1): 1-31. (in Chinese with English abstract [83] XIANG H F, WAN J L, HAN Z J, et al., 2007. Geological analysis and FT dating of the large-scale right-lateral strike-slip movement of the Red River fault zone[J]. Science in China Series D: Earth Sciences, 50(3): 331-342. (in Chinese with English abstract doi: 10.1007/s11430-007-2037-x [84] XU X W, WEN X Z, ZHENG R Z, et al., 2003. Pattern of latest tectonic motion and its dynamics for active blocks in Sichuan-Yunnan region[J]. Science in China Series D: Earth Sciences, 46(2): 210-226. [85] XU Y G, HE B, CHUNG S L, et al.,2004. Geologic, geochemical, and geophysical consequences of plume involvement in the Emeishan flood-basalt province[J]. Geology,32(10):917-920. (in Chinese with English abstract [86] XU Z Q, WANG Q, LI Z H, et al., 2016. Indo-Asian collision: tectonic transition from compression to strike slip[J]. Acta Geologica Sinica, 90(1): 1-23. (in Chinese with English abstract doi: 10.1111/1755-6724.12639 [87] YANG H Y, PENG H C, HU J F, 2017. The lithospheric structure beneath southeast Tibet revealed by P and S receiver functions[J]. Journal of Asian Earth Sciences, 138: 62-71. doi: 10.1016/j.jseaes.2017.02.001 [88] ZENG R S, SUN W G, 1992. Discussion on seismic activity, source mechanism and eastward flow of material from the Qinghai-Tibet Plateau and its adjacent regions[J]. Acta Seismologica Sinica, 14(S1): 534-564. (in Chinese) [89] ZHANG J G, DING Z F, 2016. Discussion about several issues on Dien Bien Phu fault & North-South Seismic Belt[J]. Journal of Seismological Research, 39(4): 527-536. (in Chinese with English abstract [90] ZHANG P Z, DENG Q D, ZHANG G M, et al., 2003. Active tectonic blocks and strong earthquakes in the continent of China[J]. Science in China Series D: Earth Sciences, 46(2): 13-24. [91] ZHANG Z L, LIU X M, 1982. The focal characteristics of the Tonghai earthquake, Yunnan province, on January 5, 1970[J]. Acta Geophysica Sinica, 25(5): 440-447. (in Chinese with English abstract [92] ZHANG Z Q, 2019. Crustal thicknesses and Poisson's ratios of the southeastern margin of the Tibetan Plateau[D]. Beijing: Institute of Earthquake Forecasting, China Earthquake Administration. (in Chinese with English abstract [93] ZHANG Z Q, GAO Y, 2019. Crustal thicknesses and Poisson's ratios beneath the Chuxiong‐Simao Basin in the Southeast Margin of the Tibetan Plateau[J]. Earth and Planetary Physics, 3(1): 69-84. doi: 10.26464/epp2019008 [94] ZHANG Z Q, 2022. Crust and upper mantle shear wave velocity structure of the southeastern Tibetan Plateau and its deformation characteristics[D]. Beijing: University of Science and Technology of China. (in Chinese with English abstract [95] ZHENG G, WANG H, WRIGHT T J, et al., 2017. Crustal deformation in the India‐Eurasia collision zone from 25 years of GPS measurements[J]. Journal of Geophysical Research: Solid Earth, 122(11): 9290-9312 doi: 10.1002/2017JB014465 [96] ZHENG H W, LI T D, GAO R, et al., 2006. The advance of numerical simulation in geodynamics[J]. Progress in Geophysics, 21(2): 360-369. (in Chinese with English abstract [97] ZHENG T Y, HE Y M, DING L, et al., 2020. Direct structural evidence of Indian continental subduction beneath Myanmar[J]. Nature Communications, 11(1): 1944. doi: 10.1038/s41467-020-15746-3 [98] ZHOU Q Y, LI X, CHANG Y Q, et al., 2023. Strong earthquake recurrence interval in the southern segment of the Red River Fault, southwestern China[J]. Frontiers in Earth Science, 11: 1280787. doi: 10.3389/feart.2023.1280787 [99] ZHU L Y, 2020. Numerical simulation of crustal deformation dynamics in southeastern Tibet[D]. Beijing: Institute of Geology, China Earthquake Administration. (in Chinese with English abstract [100] ZHU S B, SHI Y L, 2004. Genetic algorithm-finite element inversion of drag forces exerted by the lower crust on the upper crust in the Sichuan-Yunnan area[J]. Chinese Journal of Geophysics, 47(2): 232-239. (in Chinese with English abstract [101] 白志明,王椿镛,2003. 云南地区上部地壳结构和地震构造环境的层析成像研究[J]. 地震学报,25(2):117-127. doi: 10.3321/j.issn:0253-3782.2003.02.001 [102] 白志明,王椿镛,2004. 云南遮放-宾川和孟连-马龙宽角地震剖面的层析成像研究[J]. 地球物理学报,47(2):257-267. doi: 10.3321/j.issn:0001-5733.2004.02.012 [103] 曹建玲,石耀霖,张怀,等,2009. 青藏高原GPS位移绕喜马拉雅东构造结顺时针旋转成因的数值模拟[J]. 科学通报,54(2):224-234. [104] 曹颖,付虹,钱佳威,2023. 滇东南弧形构造区三维速度结构特征[J]. 地震研究,46(2):245-260. [105] 常利军,丁志峰,王椿镛,2015. 南北构造带南段上地幔各向异性特征[J]. 地球物理学报,58(11):4052-4067. doi: 10.6038/cjg20151114 [106] 陈振坤,苏金宝,陆艺,2019. 中国造山带动力学研究中的数值模拟应用与发展[J]. 地质力学学报,25(2):151-165. doi: 10.12090/j.issn.1006-6616.2019.25.02.014 [107] 董蕾,沈旭章,钱银苹,2020. 青藏高原东南缘Moho面速度密度跃变研究[J]. 地球物理学报,63(3):915-927. doi: 10.6038/cjg2020N0168 [108] 董晓朋,李振宏,井向辉,等,2023. 青藏高原东北缘弧形构造带新生代地层沉积序列及年代学研究进展[J]. 地质力学学报,29(4):465-484. [109] 高原,石玉涛,王琼,2020. 青藏高原东南缘地震各向异性及其深部构造意义[J]. 地球物理学报,63(3):802-816. doi: 10.6038/cjg2020O0003 [110] 韩帅,吴中海,王世锋,等,2024. 羌塘地块中西部布木错走滑断裂系的第四纪晚期地表变形特征与构造意义[J]. 地质力学学报,30(2):298-313. [111] 韩新民,柴天俊,肖九安,等,1982. 石屏-建水断裂中段的新活动与地震[J]. 地震研究,5(2):220-225. [112] 何宏林,李玶,方仲景,1992. 滇东南楔形构造区发震构造背景探讨[J]. 地震地质,13(3):217-226. [113] 呼楠,韩竹军,2013. 滇东南弧形构造带现今活动性质的地震学研究[J]. 地震地质,35(1):1-21. [114] 黄周传,吉聪,吴寒婷,等,2021. 青藏高原东南缘地壳结构与变形机制研究进展[J]. 地球与行星物理论评,52(3):291-307. [115] 阚荣举,张四昌,晏凤桐,等,1977. 我国西南地区现代构造应力场与现代构造活动特征的探讨[J]. 地球物理学报,20(2):96-109. [116] 李力,2015. 小江—奠边府断裂活动性研究[D]. 昆明:云南大学. [117] 李四光,1954. 旋卷构造及其他有关中国西北部大地构造体系复合问题[J]. 地质学报,34(4):339-410. [118] 李仕虎,黄宝春,朱日祥,2012. 青藏高原东南缘构造旋转的古地磁学证据[J]. 地球物理学报,55(1):76-94. [119] 李西,冉勇康,陈立春,等,2016. 红河断裂带南段全新世地震活动证据[J]. 地震地质,38(3):596-604. [120] 李岩峰,曲国胜,张进,2007. 弧形构造研究进展[J]. 地球科学进展,22(7):708-715. doi: 10.3321/j.issn:1001-8166.2007.07.006 [121] 林舸,赵重斌,张晏华,等,2005. 地质构造变形数值模拟研究的原理、方法及相关进展[J]. 地球科学进展,20(5):549-555. [122] 刘晓霞,邵志刚,2020. 丽江—小金河断裂带现今断层运动特征[J]. 地球物理学报,63(3):1117-1126. doi: 10.6038/cjg2020N0228 [123] 马海勇,罗安湘,王朝阳,等,2022. 弧形构造带形成演化特征研究[J]. 西安科技大学学报,42(4):752-759. [124] 宁铄现,陈永顺,2023. 青藏高原东南缘存在连通的下地壳流吗?[J]. 北京大学学报(自然科学版),59(3):395-406. [125] 任龙龙,张波,郑德文,等,2020. 哀牢山-红河剪切带渐新世的构造体制转换与剥露历史:来自哀牢山南段磷灰石裂变径迹的证据[J]. 岩石学报,36(6):1787-1802. doi: 10.18654/1000-0569/2020.06.09 [126] 谭晓慧,宋传中,查甫生,等,2010. 数值模拟方法在构造变形研究中的应用[J]. 合肥工业大学学报(自然科学版),33(12):1851-1857. doi: 10.3969/j.issn.1003-5060.2010.12.021 [127] 万永魁,沈小七,刘瑞丰,等,2021. 川滇地区活动块体边界断裂现今运动和应力分布[J]. 地震地质,43(6):1614-1637. doi: 10.3969/j.issn.0253-4967.2021.06.015 [128] 王岸,王国灿,王团乐,等,2023. 青藏高原东南缘金沙江下游新生代构造与地貌演化[J]. 地质力学学报,29(4):453-464. doi: 10.12090/j.issn.1006-6616.2023043 [129] 王椿镛,朱成男,刘玉权,1978. 用地形变资料测定通海地震的地震断层参数[J]. 地球物理学报,21(3):191-198. [130] 王辉,曹建玲,张怀,等,2007. 川滇地区下地壳流动对上地壳运动变形影响的数值模拟[J]. 地震学报,29(6):581-591. doi: 10.3321/j.issn:0253-3782.2007.06.003 [131] 王瑞瑞,许志琴,梁凤华,2013. 大巴山弧形构造的成因:来自数值模拟的证据[J]. 地质学报,87(10):1489-1497. [132] 王阎昭,王恩宁,沈正康,等,2008. 基于GPS资料约束反演川滇地区主要断裂现今活动速率[J]. 中国科学 D辑:地球科学,38(5):582-597. [133] 魏文薪,2013. 川滇块体东边界主要断裂带运动特性及动力学机制研究[D]. 北京:中国地震局地质研究所. [134] 闻学泽,杜方,龙锋,等,2011. 小江和曲江-石屏两断裂系统的构造动力学与强震序列的关联性[J]. 中国科学:地球科学,41(5):713-724. [135] 武红岭,施炜,董树文,等,2009. 大巴山前陆叠加构造力学特征的模拟研究[J]. 地学前缘,16(3):190-196. doi: 10.3321/j.issn:1005-2321.2009.03.015 [136] 吴中海,龙长兴,范桃园,等,2015. 青藏高原东南缘弧形旋扭活动构造体系及其动力学特征与机制[J]. 地质通报,34(1):1-31. doi: 10.3969/j.issn.1671-2552.2015.01.002 [137] 向宏发,万景林,韩竹军,等,2006. 红河断裂带大型右旋走滑运动发生时代的地质分析与FT测年[J]. 中国科学 D辑:地球科学,36(11):977-987. [138] 徐锡伟,闻学泽,郑荣章,等,2003. 川滇地区活动块体最新构造变动样式及其动力来源[J]. 中国科学(D辑),33(S1):151-162. [139] 许志琴,王勤,李忠海,等,2016. 印度-亚洲碰撞:从挤压到走滑的构造转换[J]. 地质学报,90(1):1-23. doi: 10.3969/j.issn.0001-5717.2016.01.001 [140] 曾融生,孙为国,1992. 青藏高原及其邻区的地震活动性和震源机制以及高原物质东流的讨论[J]. 地震学报,14(S1):534-564. [141] 张建国,丁志峰,2016. 奠边府断裂与南北地震带若干问题讨论[J]. 地震研究,39(4):527-536. doi: 10.3969/j.issn.1000-0666.2016.04.001 [142] 张培震,邓起东,张国民,等,2003. 中国大陆的强震活动与活动地块[J]. 中国科学(D辑),33(S1):12-20. [143] 张之立,刘新美,1982. 1970年1月5日云南通海地震的震源特征[J]. 地球物理学报,25(5):440-447. doi: 10.3321/j.issn:0001-5733.1982.05.007 [144] 张智奇,2022. 青藏高原东南缘地壳上地幔速度结构与变形特征研究[D]. 北京:中国科学技术大学. [145] 张子琦,2019. 青藏高原东南缘地壳厚度和泊松比研究[D]. 北京:中国地震局地震预测研究所. [146] 郑洪伟,李廷栋,高锐,等,2006. 数值模拟在地球动力学中的研究进展[J]. 地球物理学进展,21(2):360-369. doi: 10.3969/j.issn.1004-2903.2006.02.005 [147] 朱良玉,2020. 青藏高原东南缘地壳形变动力学数值模拟研究[D]. 北京:中国地震局地质研究所. [148] 朱守彪,石耀霖,2004. 用遗传有限单元法反演川滇下地壳流动对上地壳的拖曳作用[J]. 地球物理学报,47(2):232-239. doi: 10.3321/j.issn:0001-5733.2004.02.009 -

 下载:
下载:


计量
- 文章访问数: 1565
- HTML全文浏览量: 386
- PDF下载量: 162
- 被引次数: 0
