

Spatiotemporal evolution of interseismic coupling and stress accumulation near an asperity on a vertical strike-slip fault: Insights from three-dimensional viscoelastic numerical simulation
-
摘要: 了解断层凹凸体附近的运动学状态和应力积累对于评估其地震危险性至关重要。断层的闭锁程度被广泛用来刻画断层的震间运动学特征,但断层闭锁程度空间分布与凹凸体位置之间的关系很少被人关注。除此之外,地球介质的流变作用如何调节凹凸体附近滑动亏损和剪应力积累速率的时空演化目前仍不清楚。为揭示凹凸体对震间变形以及应力积累的调节作用,构建了包含直立走滑断层的三维弹性/黏弹性有限元模型,采用接触算法考虑凹凸体的闭锁作用,讨论单一凹凸体附近闭锁程度和剪应力积累速率的时空变化,并通过鲜水河断裂的实例对基于断层闭锁的震间变形方法进行验证。研究结果显示:由于凹凸体的锁定作用,距离凹凸体一定范围的断层面无法完全自由滑动,导致以凹凸体为中心的一定区域内存在滑动亏损,因此断层闭锁程度呈现出以凹凸体为中心的环状衰减样式;在完全弹性条件下,凹凸体附近区域的闭锁程度和剪应力积累速率不随时间变化;在黏弹性条件下,凹凸体附近区域的闭锁程度和剪应力积累速率等值线随时间的加载不断变大,且闭锁程度等值线随时间变化效应更加明显;对于断层两侧黏度存在差异的场景,由于断层两侧松弛时间不一样,断层的震间变形和应力积累速率主要受到松弛时间较低一侧介质流变性质控制。最终得出以下结论:由于介质的连续性,凹凸体邻近区域虽然不闭锁,但其滑动速率仍低于块体运动速度,从而导致闭锁程度的空间样式表现为由凹凸体向外逐渐衰减;黏弹性效应调节凹凸体附近的变形,导致凹凸体附近闭锁程度等值线空间范围随时间增大;断层闭锁程度可以近似作为衡量剪应力积累速率的指标,当不考虑黏弹性效应可以近似取0.5作为中强闭锁的阈值,低于该值剪应力积累不明显;考虑鲜水河断裂带炉霍至康定段的空间非均匀闭锁分布,模拟得到的地表速度与GPS观测吻合较好,验证了方法的可靠性。该项研究建立了断层闭锁程度和剪应力积累速率之间的桥梁,为潜在震源区识别提供有益思路。Abstract:
Objective Understanding the kinematic state and stress accumulation near fault protuberances is crucial for accurate assessment of earthquake hazards. Interseismic coupling (ISC) is a widely used method for characterizing the kinematic behavior of faults. Despite its importance, the correlation between the spatial distribution of ISC and the positioning of fault asperities, areas of increased frictional resistance, has not been extensively studied. Furthermore, the influence of the rheological properties of Earth materials on the temporal and spatial evolutions of slip deficits and shear stress accumulation in close proximity to these asperities remains poorly understood. Methods We developed a set of three-dimensional (3D) elastic and viscoelastic finite element models to investigate the effects of fault asperities on interseismic deformation and stress accumulation. These models incorporate vertical strike-slip faults and use sophisticated contact algorithms to simulate the mechanical locking associated with asperities. Our innovative approach, referred to as the “binary fault-locking approach”, simplifies fault behavior into a binary system, categorizing states as either “locked” or “unlocked”. The present study analyzes the spatial and temporal variations in the ISC and shear stress accumulation rates around a single asperity, providing novel insights into the mechanics of fault systems. In addition, we validate the efficacy of the “binary fault-locking approach” by applying it to the Xianshuihe fault, thereby reinforcing the relevance of our findings to real-world fault behavior. Through this study, we aim to enhance our understanding of fault mechanics and improve earthquake hazard assessments, which ultimately contributes to more effective risk-mitigation strategies. Results Because of the mechanical locking of the asperity, a fault-sliding surface within a certain distance from the asperity cannot slide freely, resulting in a slip deficit in an area centered around the asperity. Consequently, the degree of fault-locking displays a ring-shaped attenuation pattern centered on this asperity. Under purely elastic conditions, the ISC and shear stress accumulation rates near the vicinity of the asperity remained constant over time. Conversely, under viscoelastic conditions, the contours of the ISC and shear stress accumulation in the areas surrounding the asperity expanded with time under loading, and the effects of temporal changes in the locking degree became more pronounced. In scenarios where the viscosity differs on either side of the fault, the interseismic deformation and stress accumulation rate of the fault are primarily controlled by the rheological properties of the material on the side with a lower relaxation time, owing to the different relaxation times on either side of the fault. Conclusion (1) Because of the continuity of the medium, although the region adjacent to an asperity is not fully locked, its slip velocity is still lower than the movement velocity of block, resulting in a spatial pattern of decreasing ISC outward from the fault asperity. (2) Viscoelastic effects regulated the deformation near a fault asperity, leading to an increase in the spatial extent of the ISC over time. (3) The ISC can serve as an approximate indicator of the shear stress accumulation rate. Irrespective of viscoelastic effects, a value of approximately 0.5 can be used as the threshold for moderate to strong locking, and shear stress accumulation is insignificant below this value. (4) Considering the spatially nonuniform fault coupling along the Luhuo-Kangding segment of the Xianshuihe fault, the simulated surface velocities closely matched the GPS observations, thus confirming the reliability of the method. Significance This study establishes an important connection between ISC and shear stress accumulation rate, providing valuable insights for identifying potential seismic hazards. Overall, this study emphasizes the intricate interactions between fault dynamics and geological structures, and highlights the significance of detailed modeling for understanding earthquake mechanisms. By addressing the gaps in knowledge regarding the influence of protuberances on fault behavior, this research contributes valuable information to the field of seismic hazard estimation, thereby enhancing our ability to effectively mitigate earthquake risks. -
Key words:
- numerical simulation /
- asperity /
- interseismic coupling /
- stress accumulation /
- viscoelasticity /
- crustal stress /
- earthquake dynamics
-

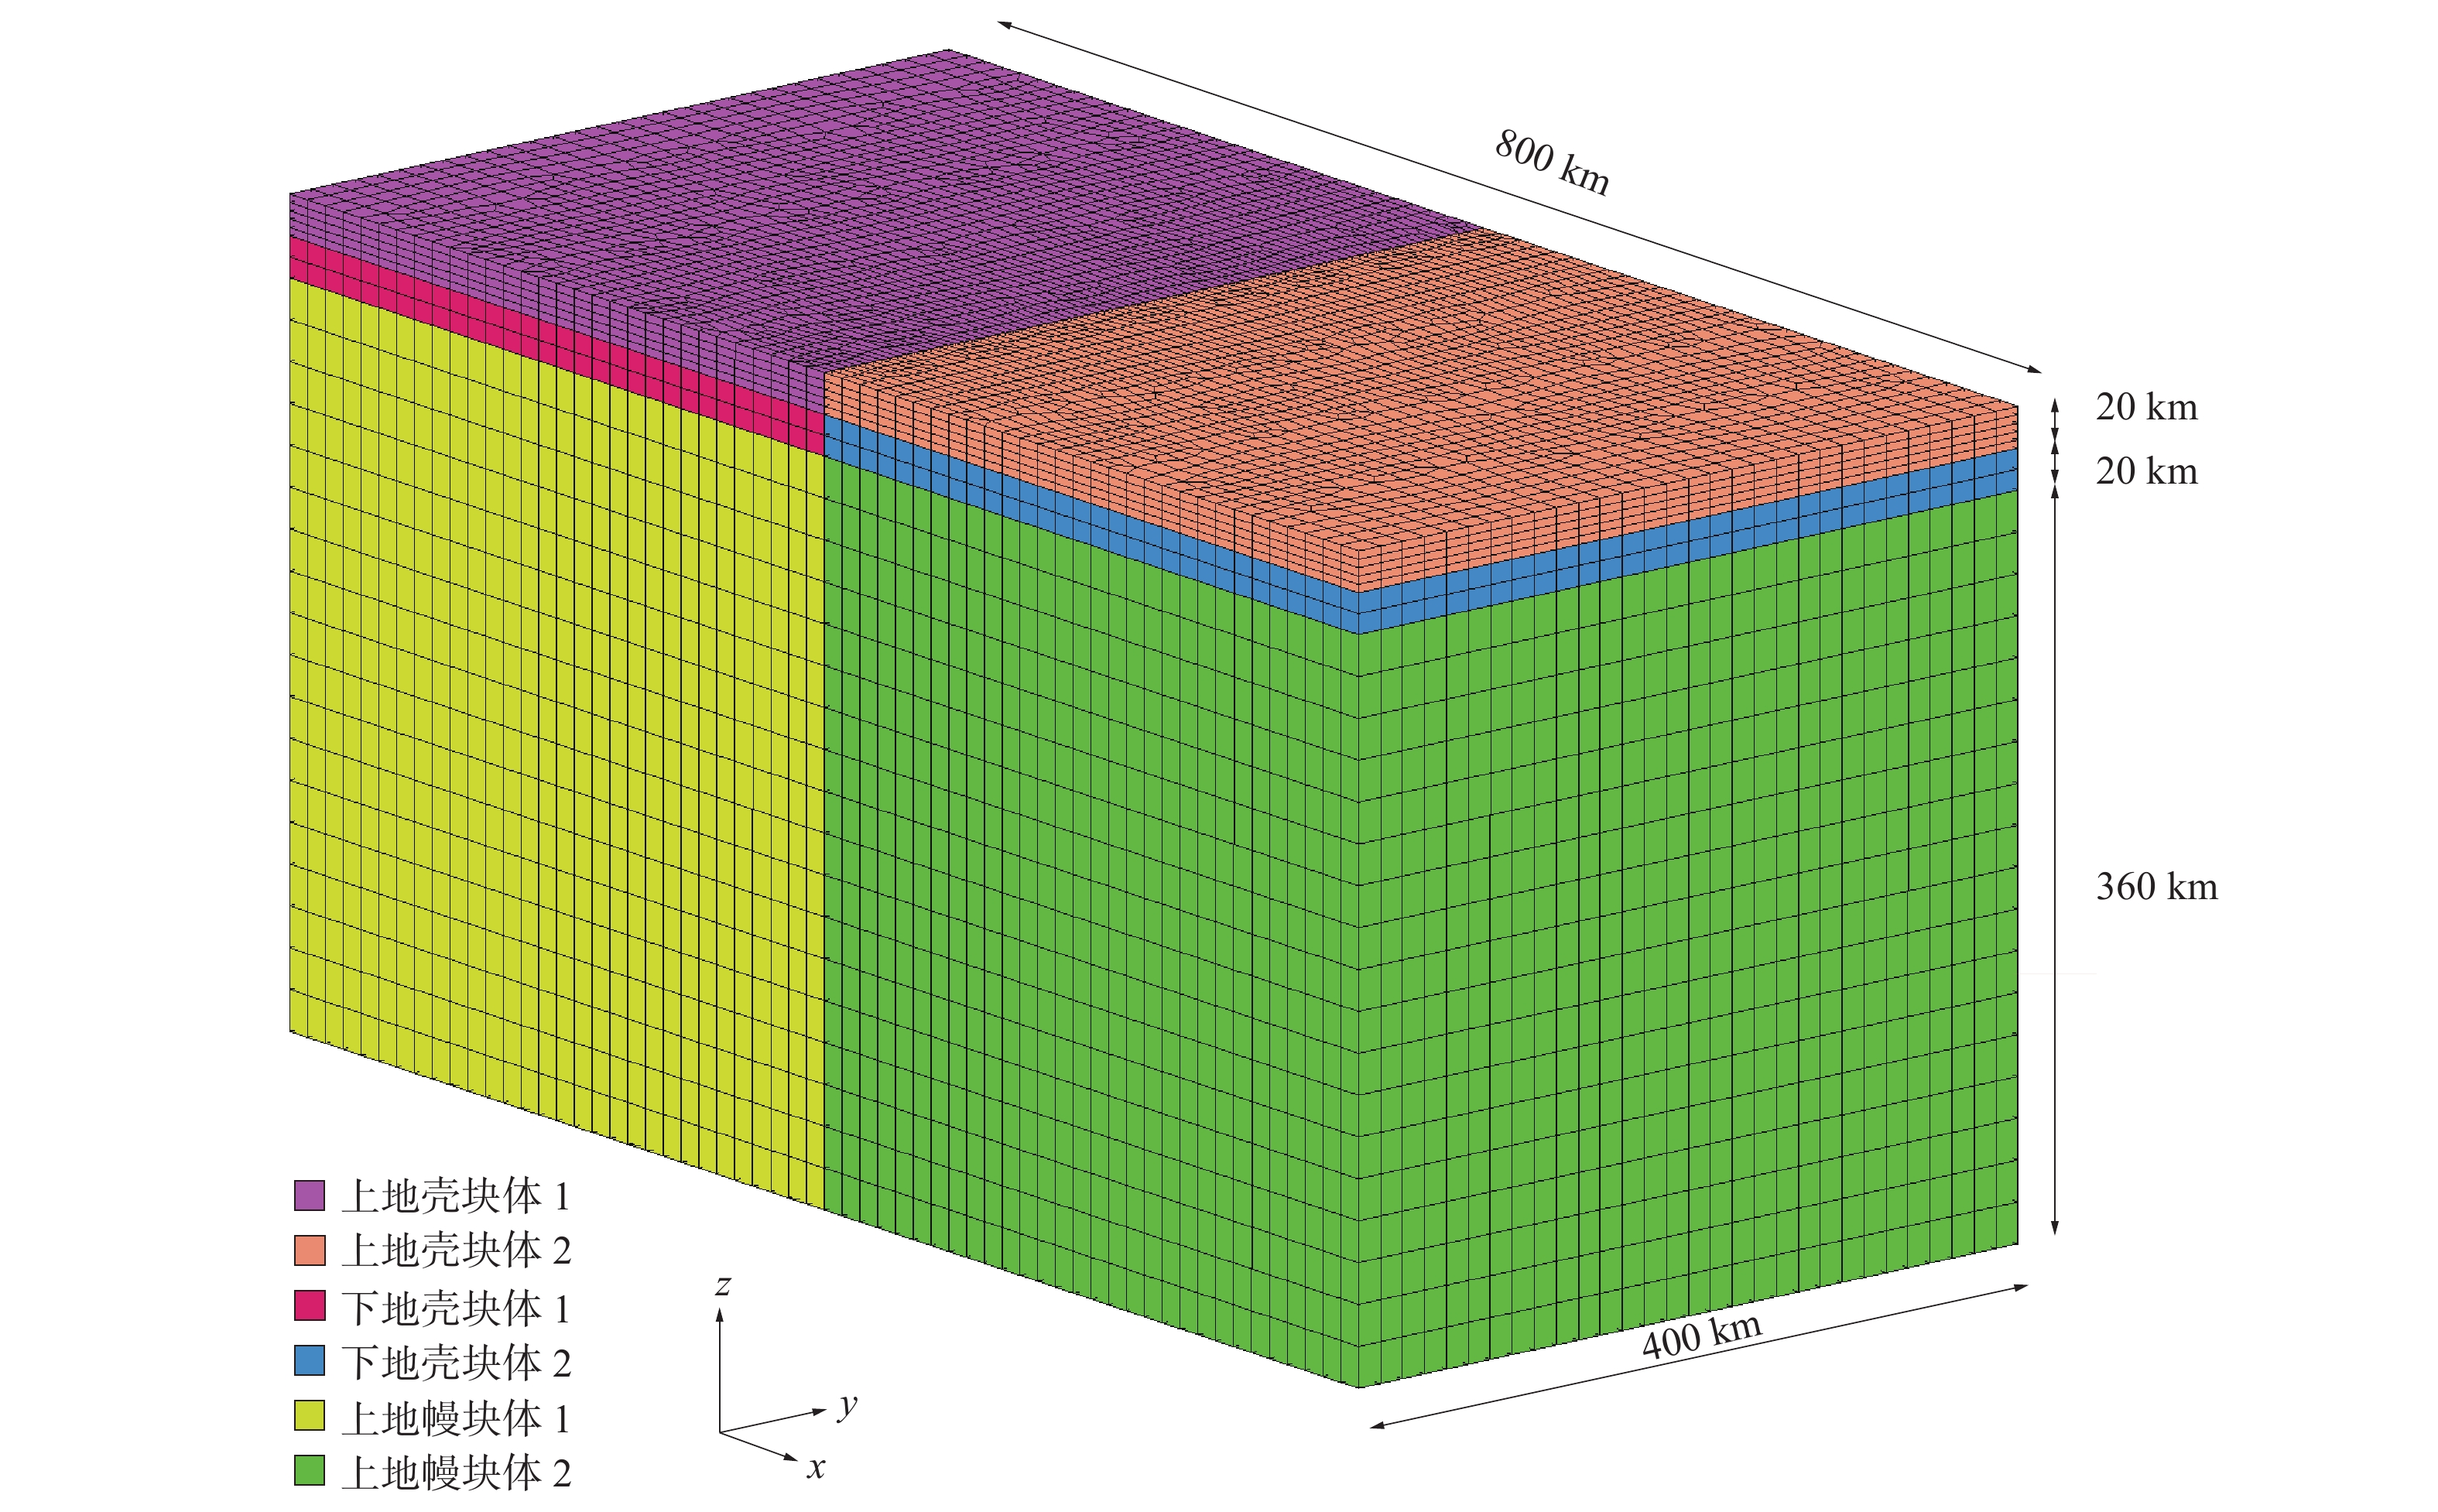
图 1 模型网格图
模型坐标为右手系,其中x轴正向代表东,y轴正向代表北,z轴正向代表上
Figure 1. Mesh of the finite element method (FEM) model
An east-north-up (ENU) system is used in the model.
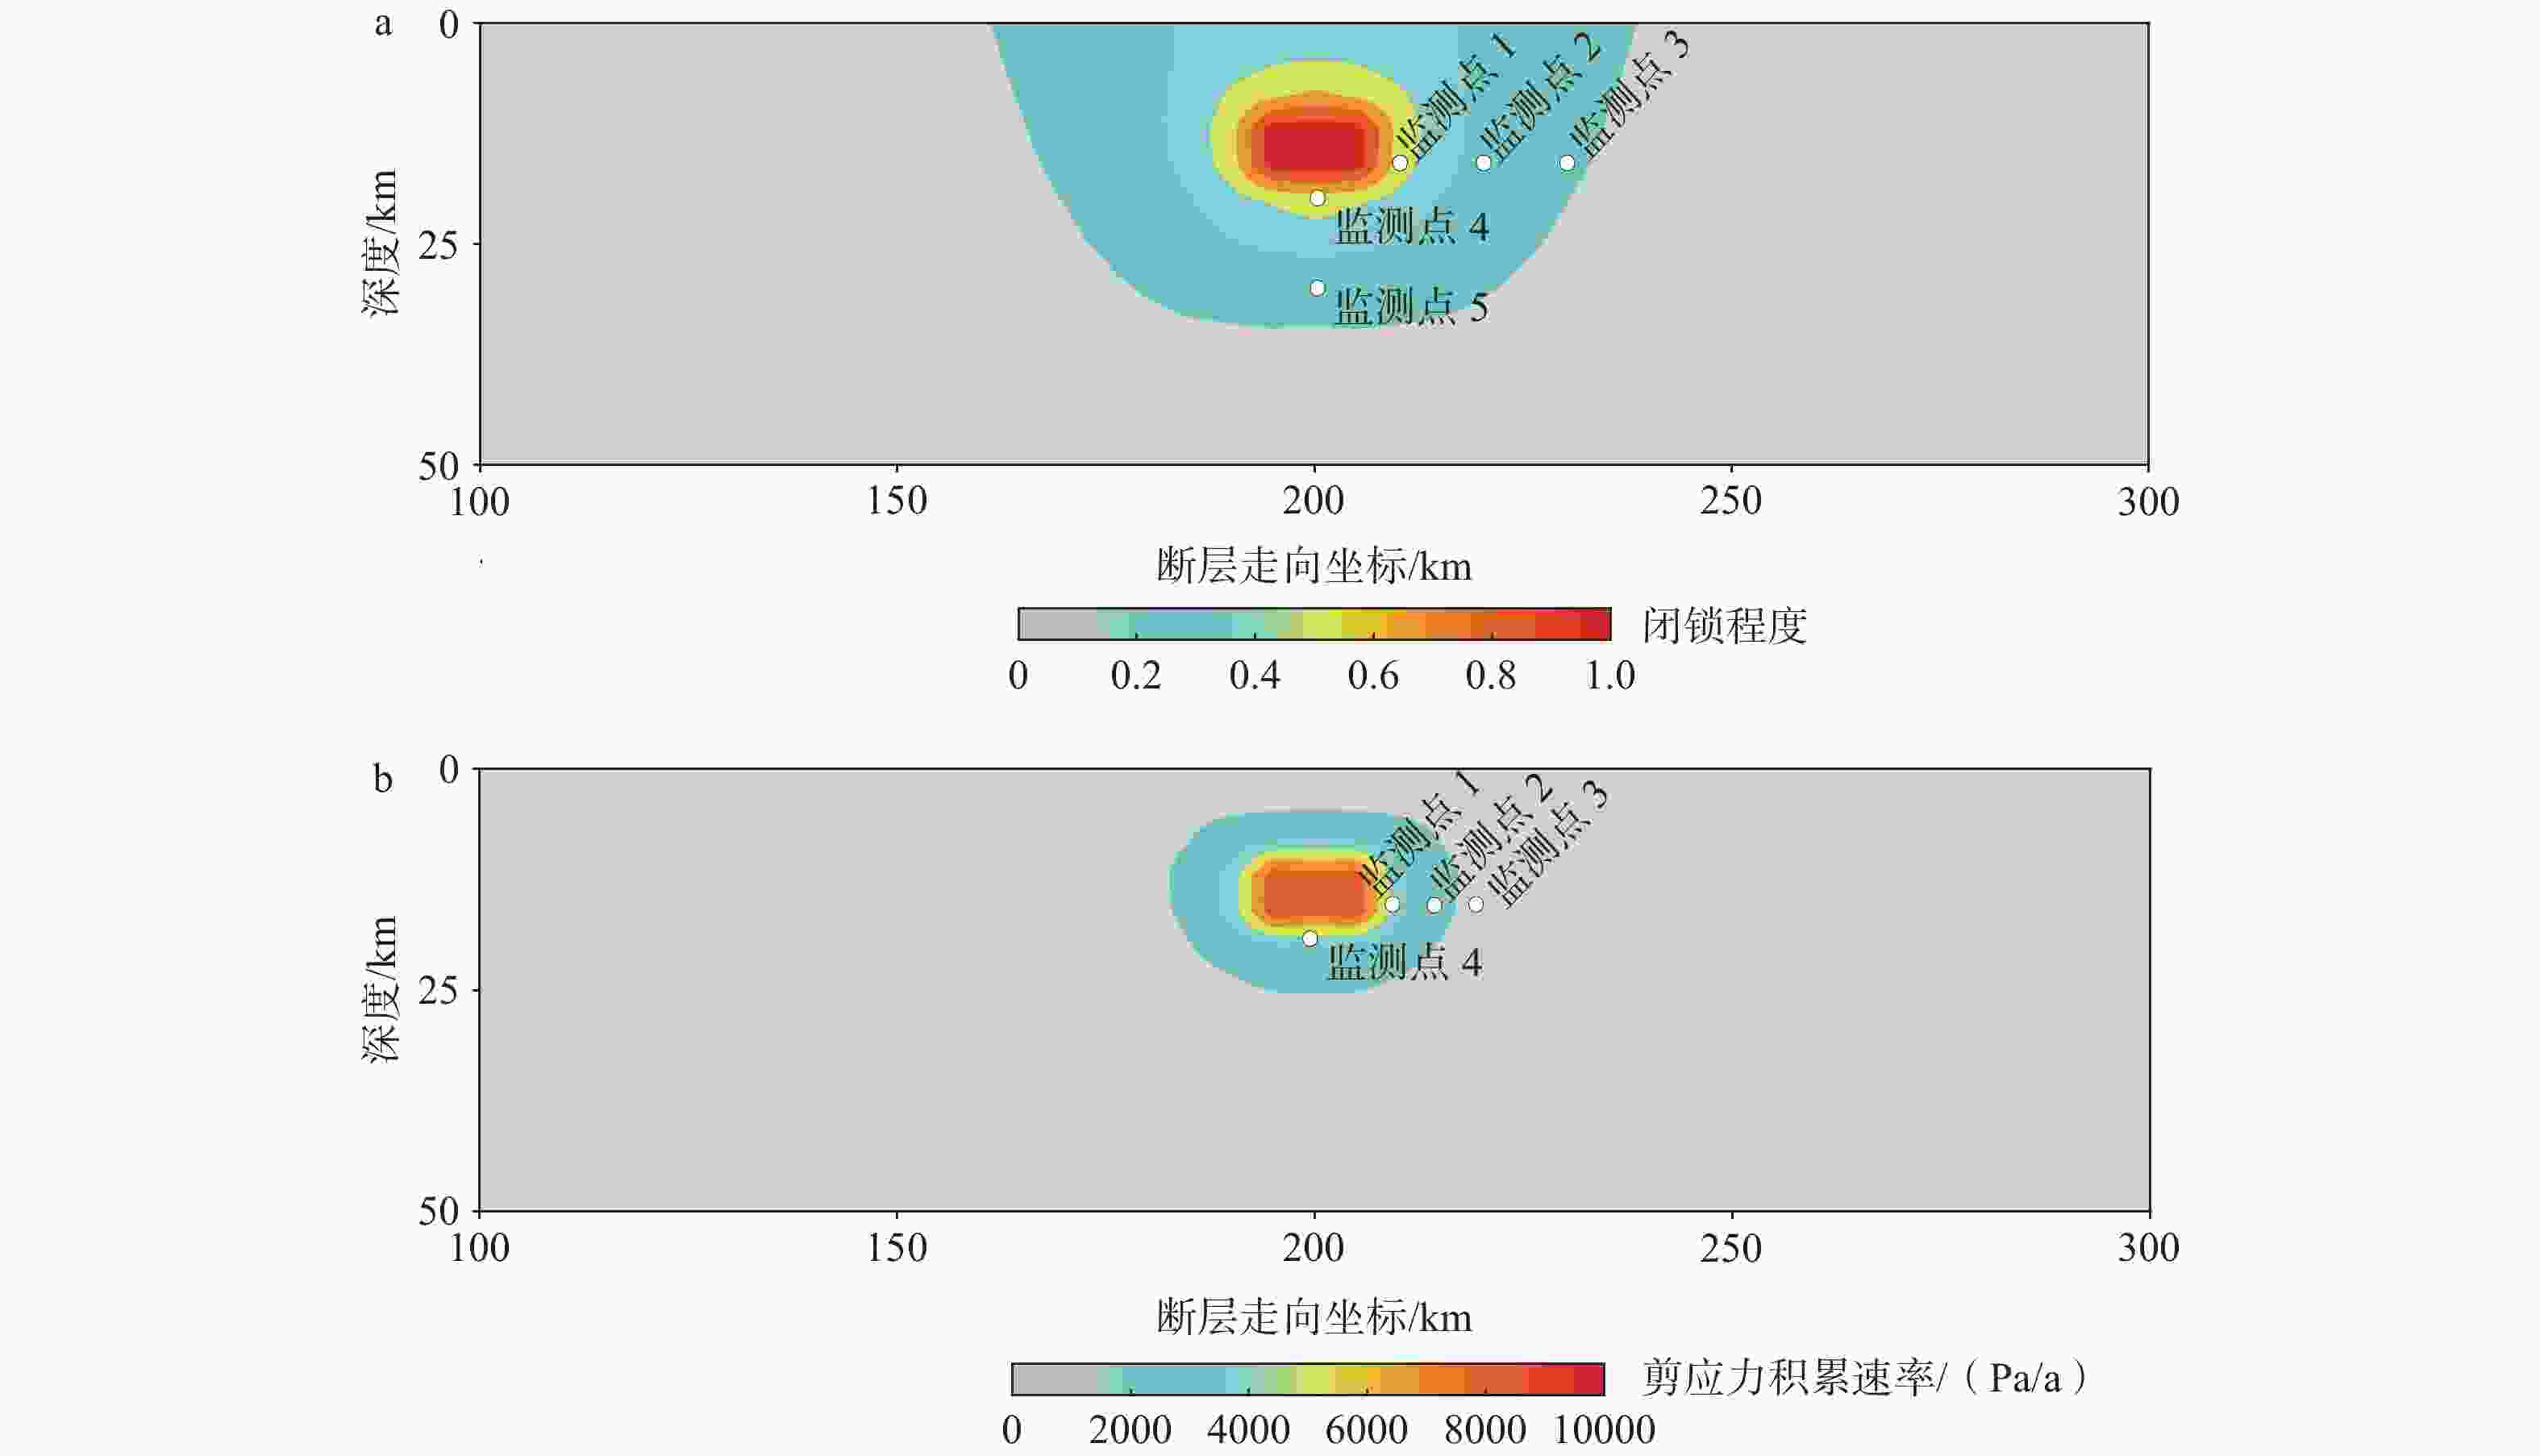
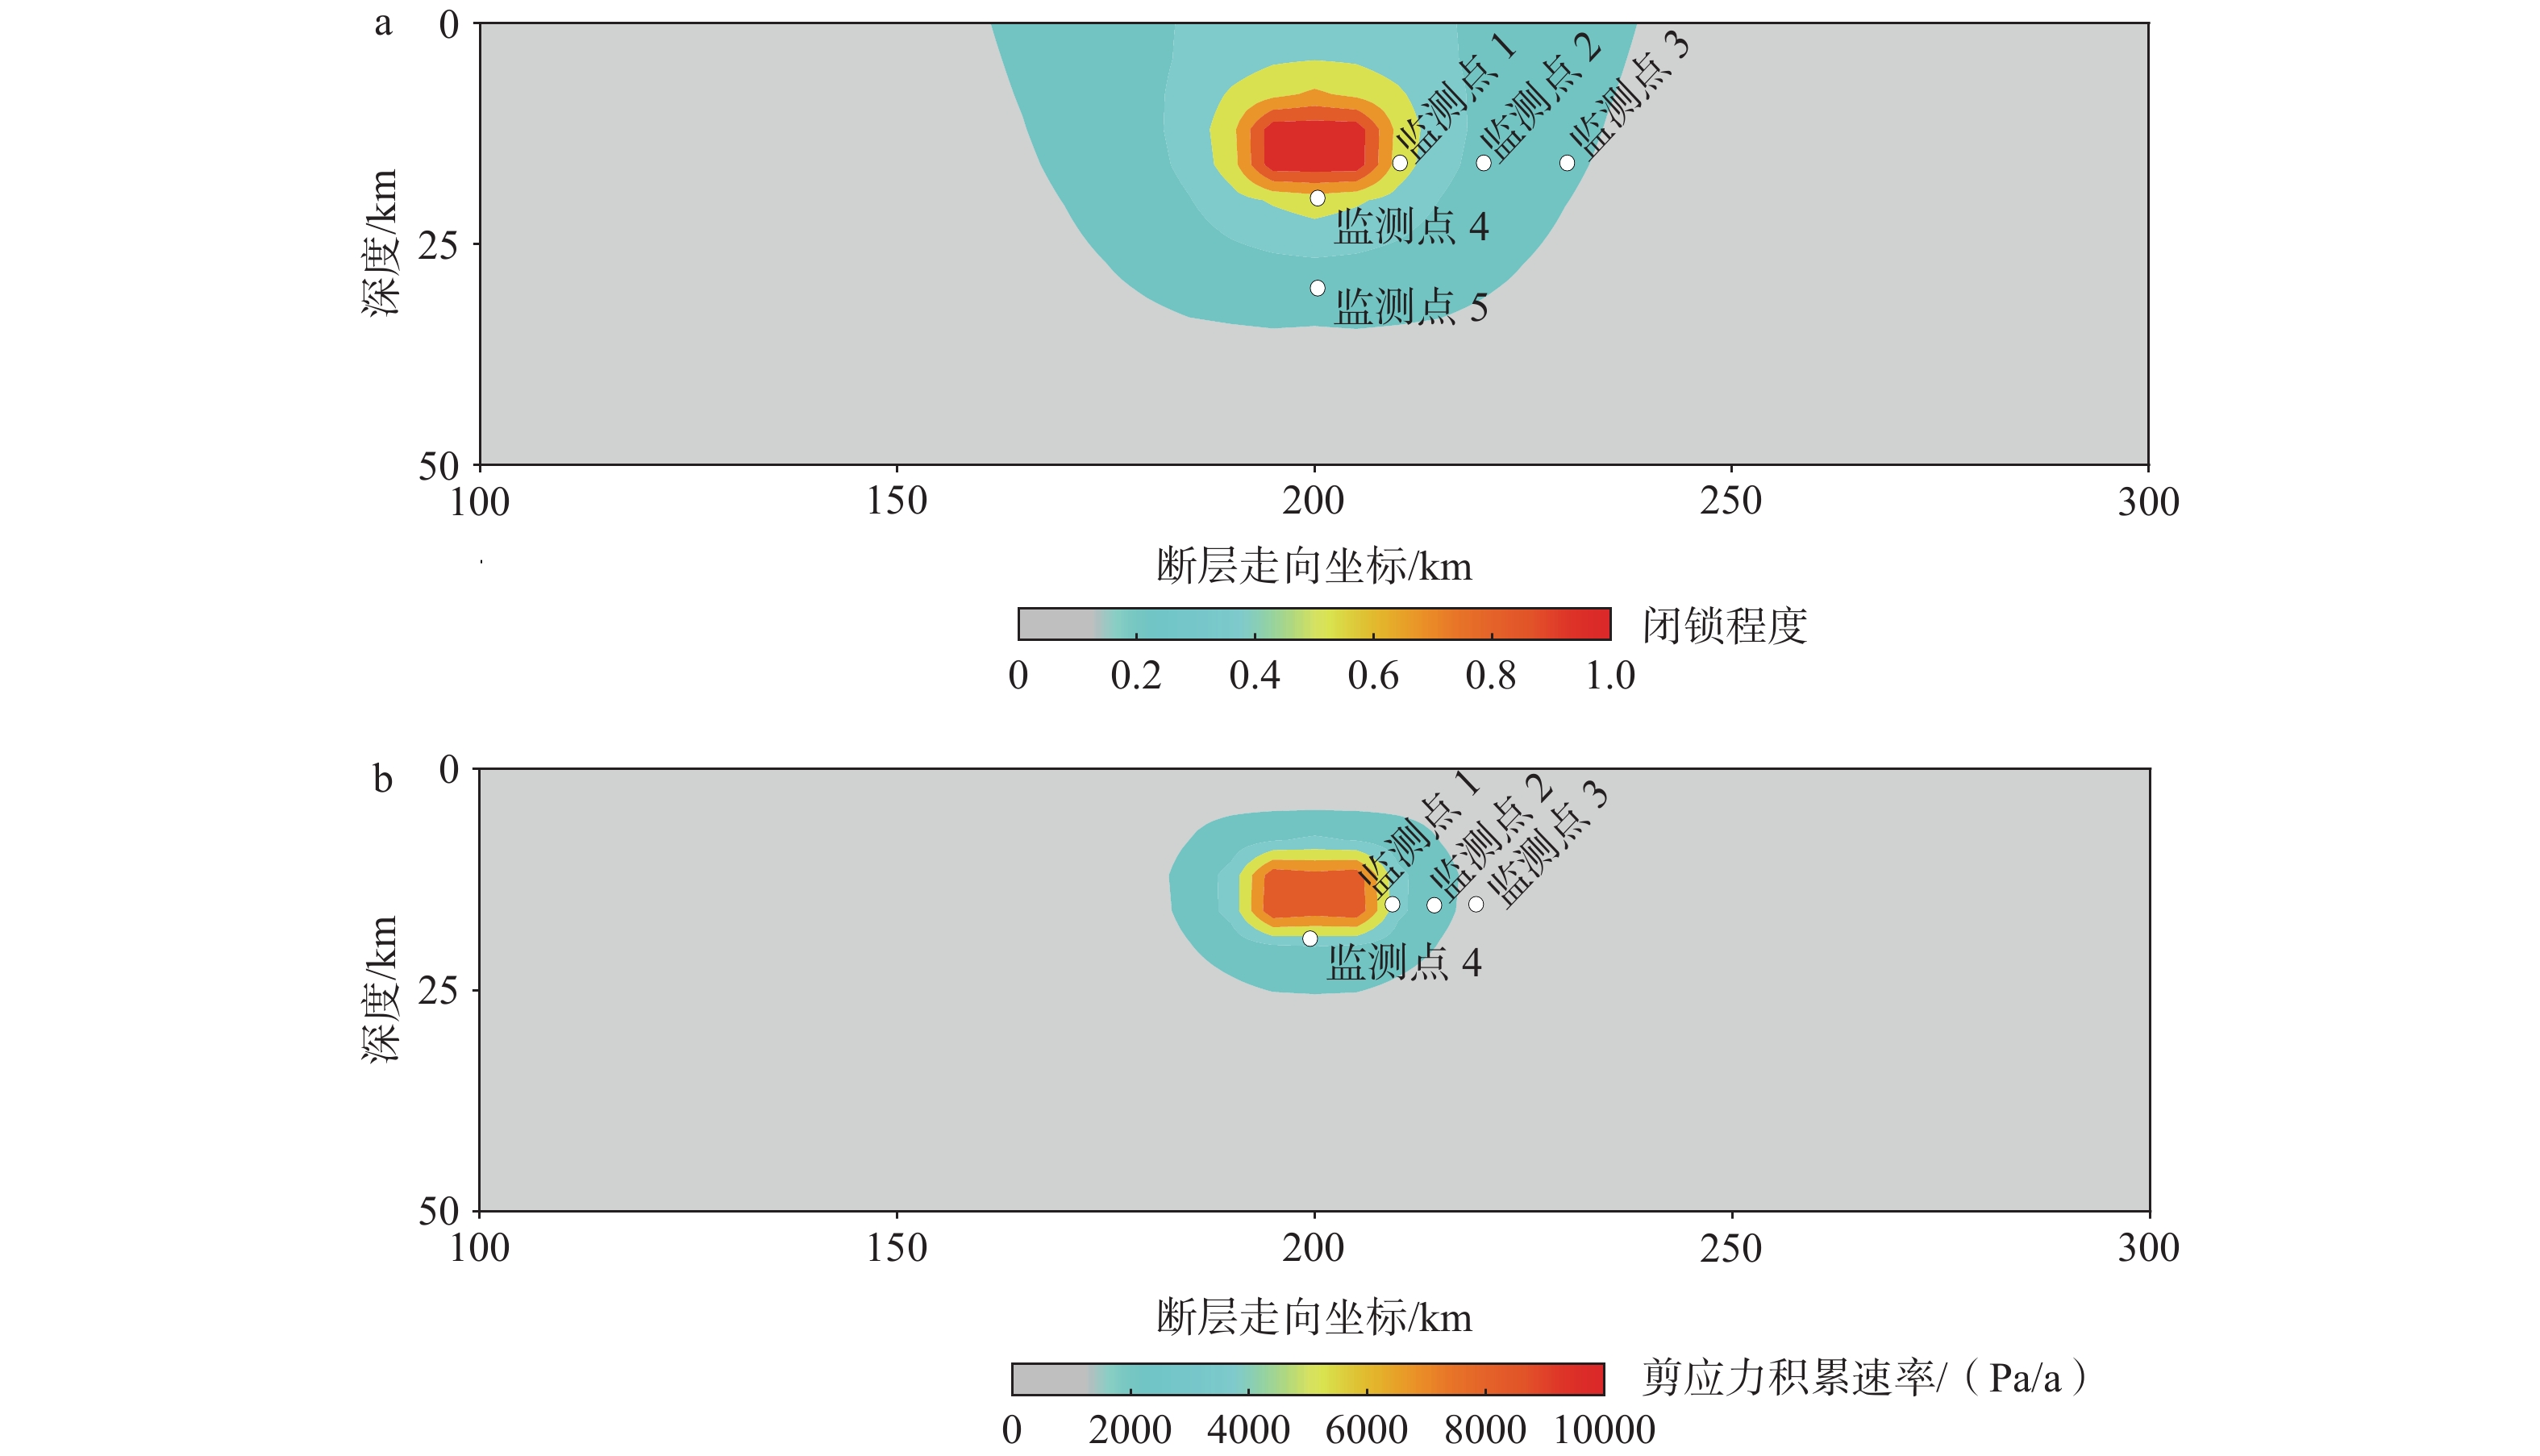
图 2 弹性模型的计算结果
a—闭锁程度;b—剪应力积累速率
Figure 2. Elastic model results
(a) Interseismic coupling (ISC); (b) Shear stress accumulation rates
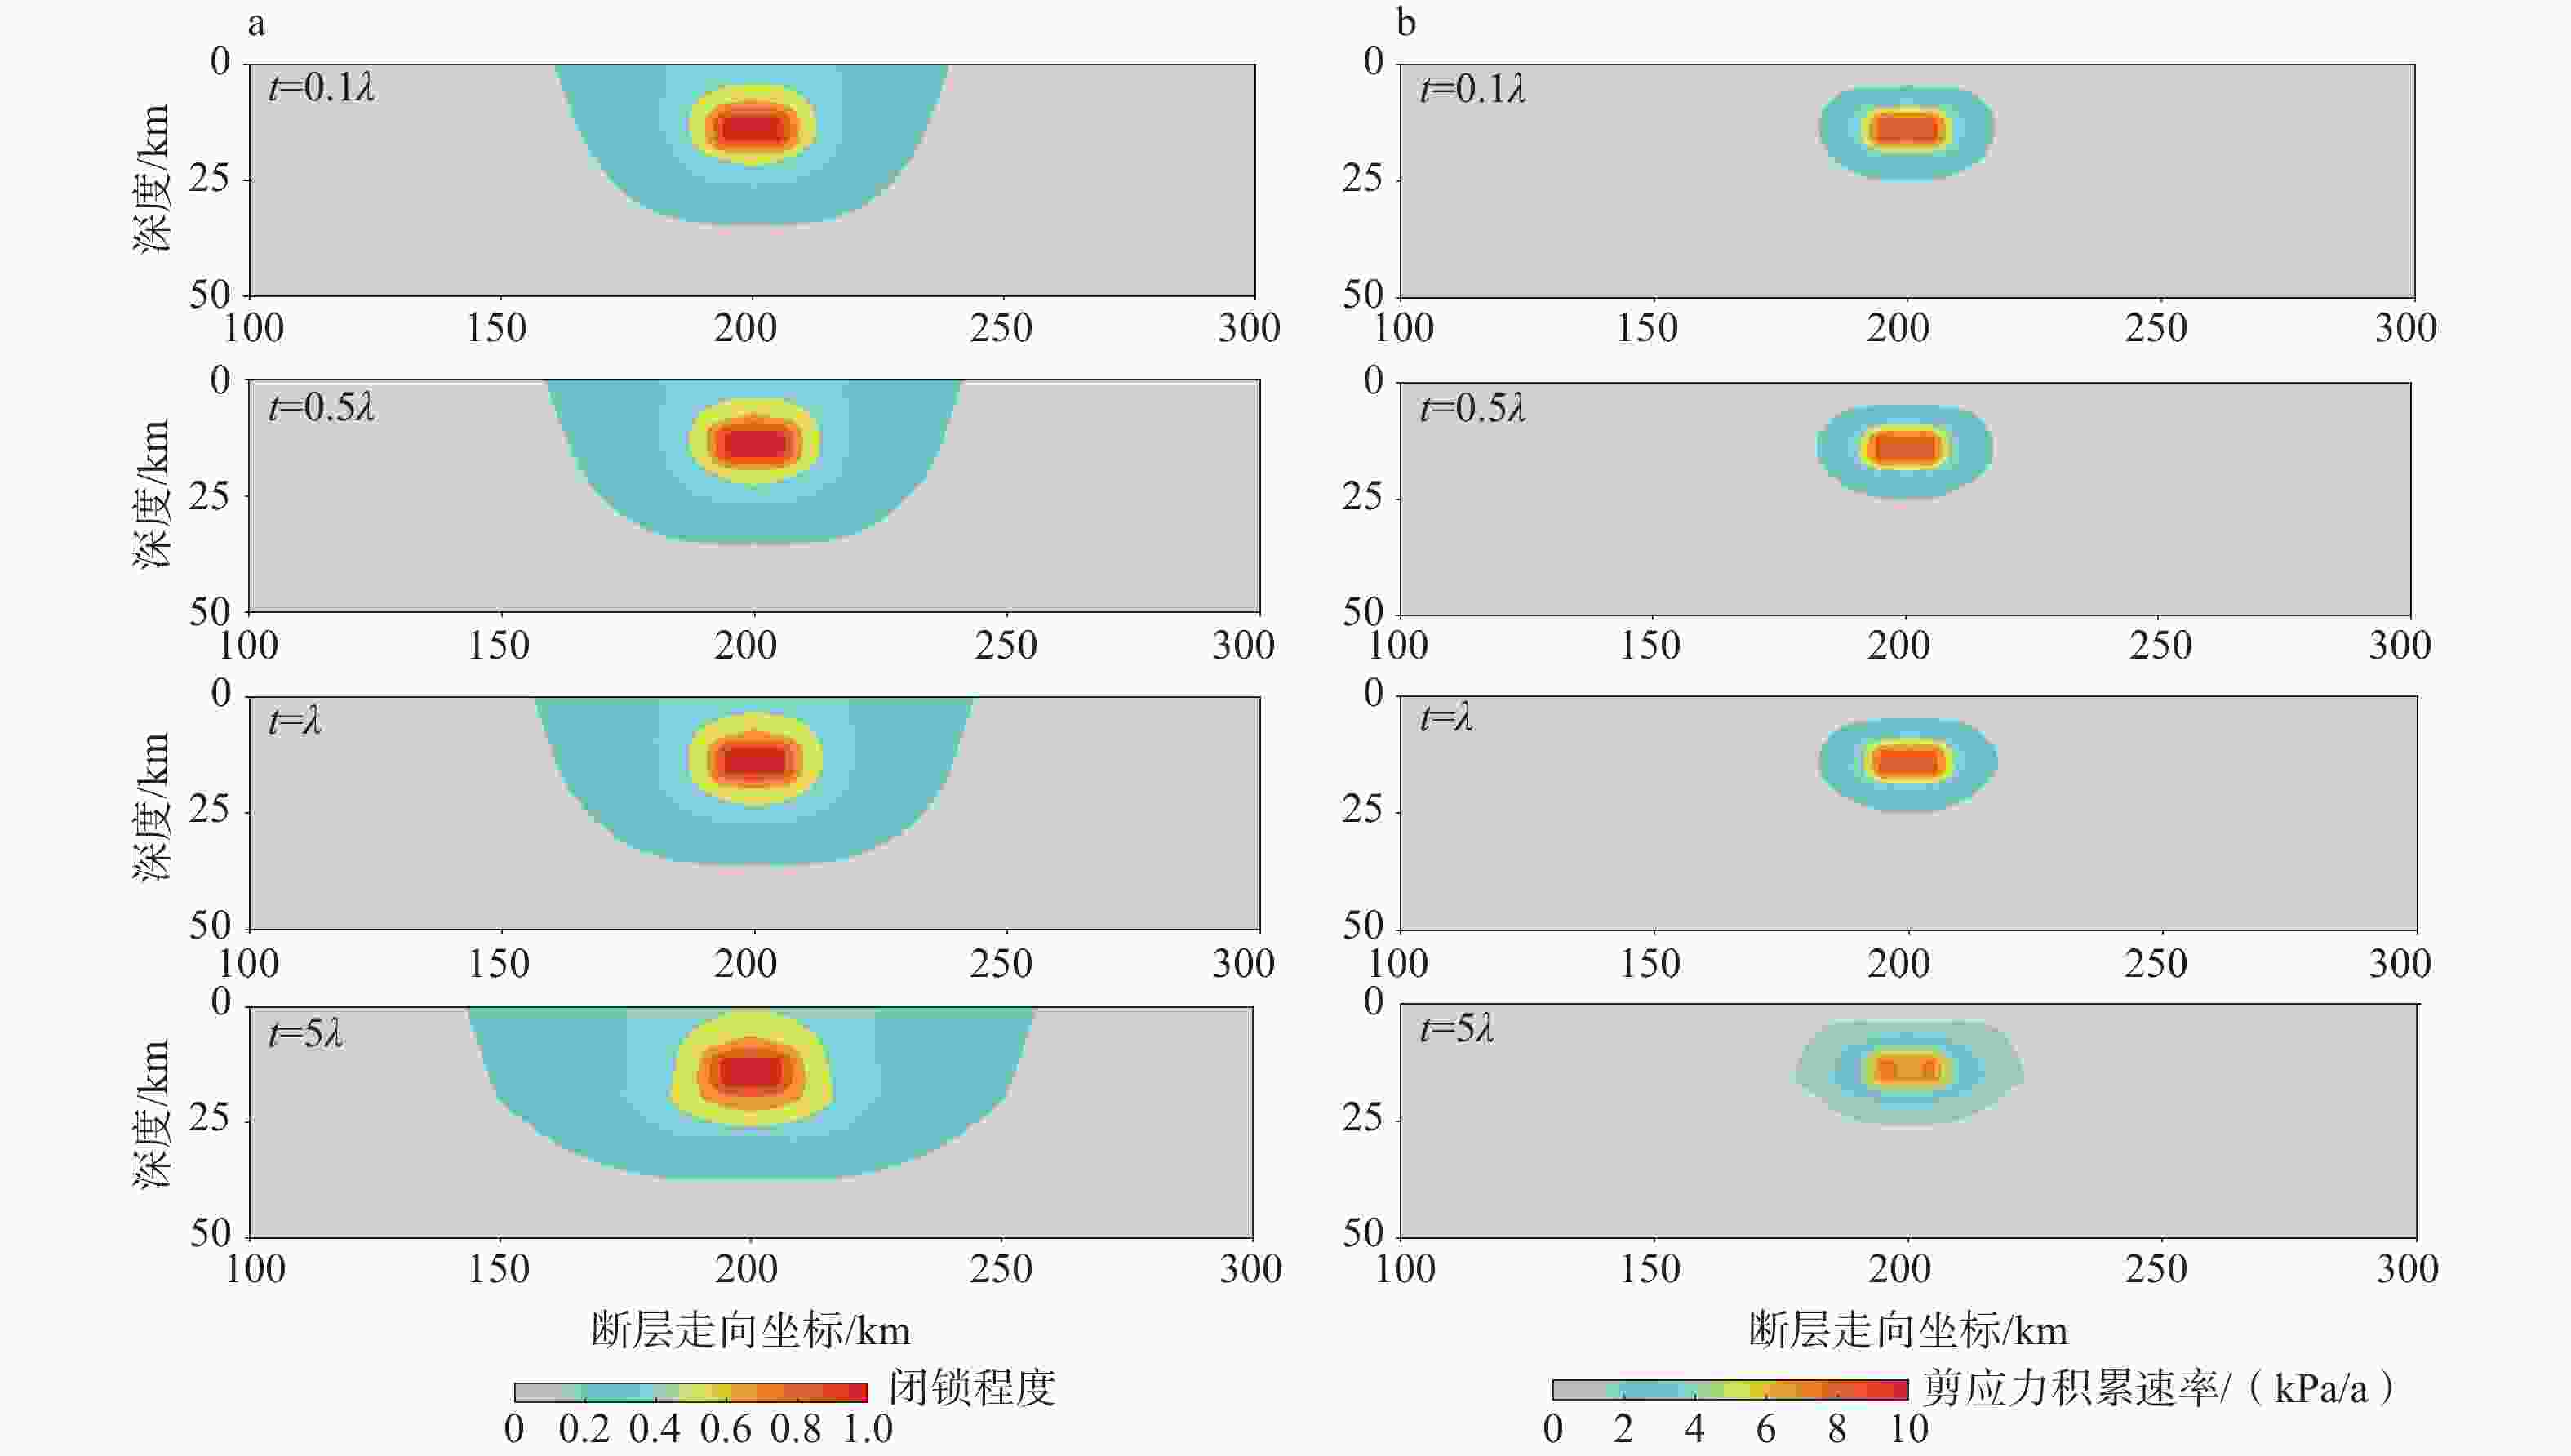
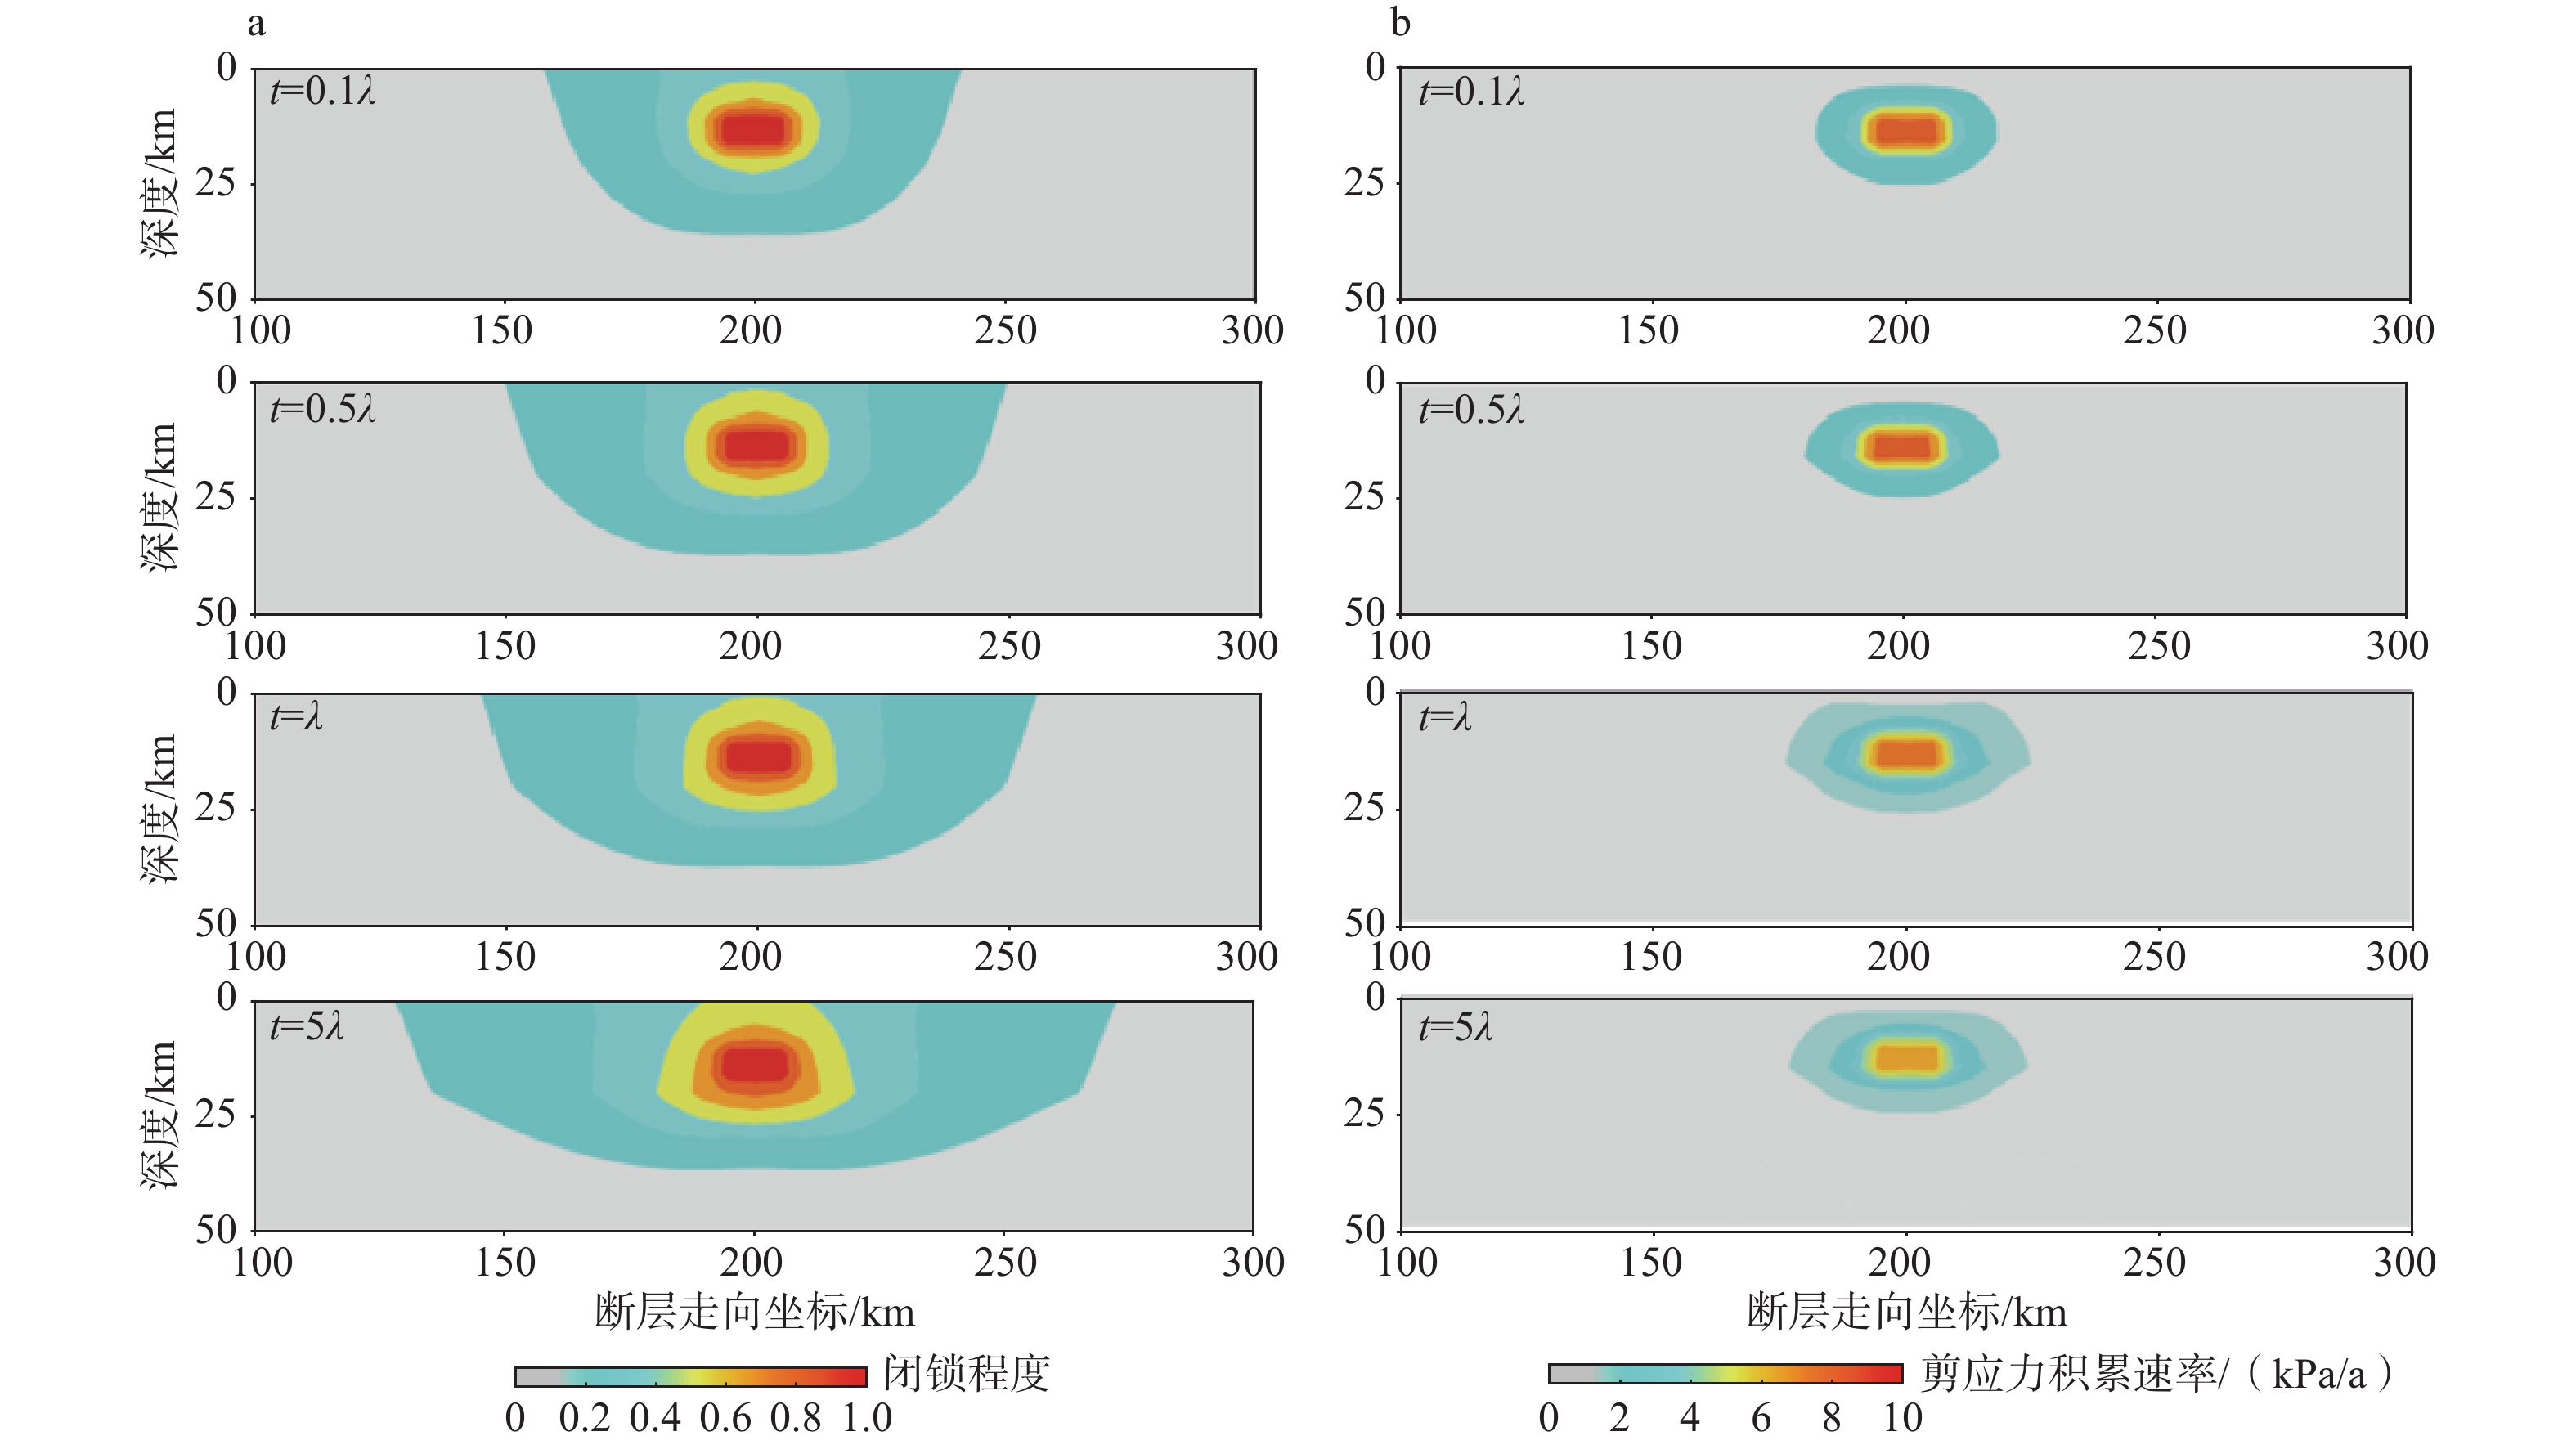
图 3 均匀黏弹性模型计算的闭锁程度和剪应力积累速率的时空演化特征
a—闭锁程度;b—剪应力积累速率
Figure 3. Spatiotemporal evolution of the ISC and shear stress accumulation rates derived from the homogeneous viscoelastic model
(a) Interseismic coupling (ISC); (b) Shear stress accumulation rates
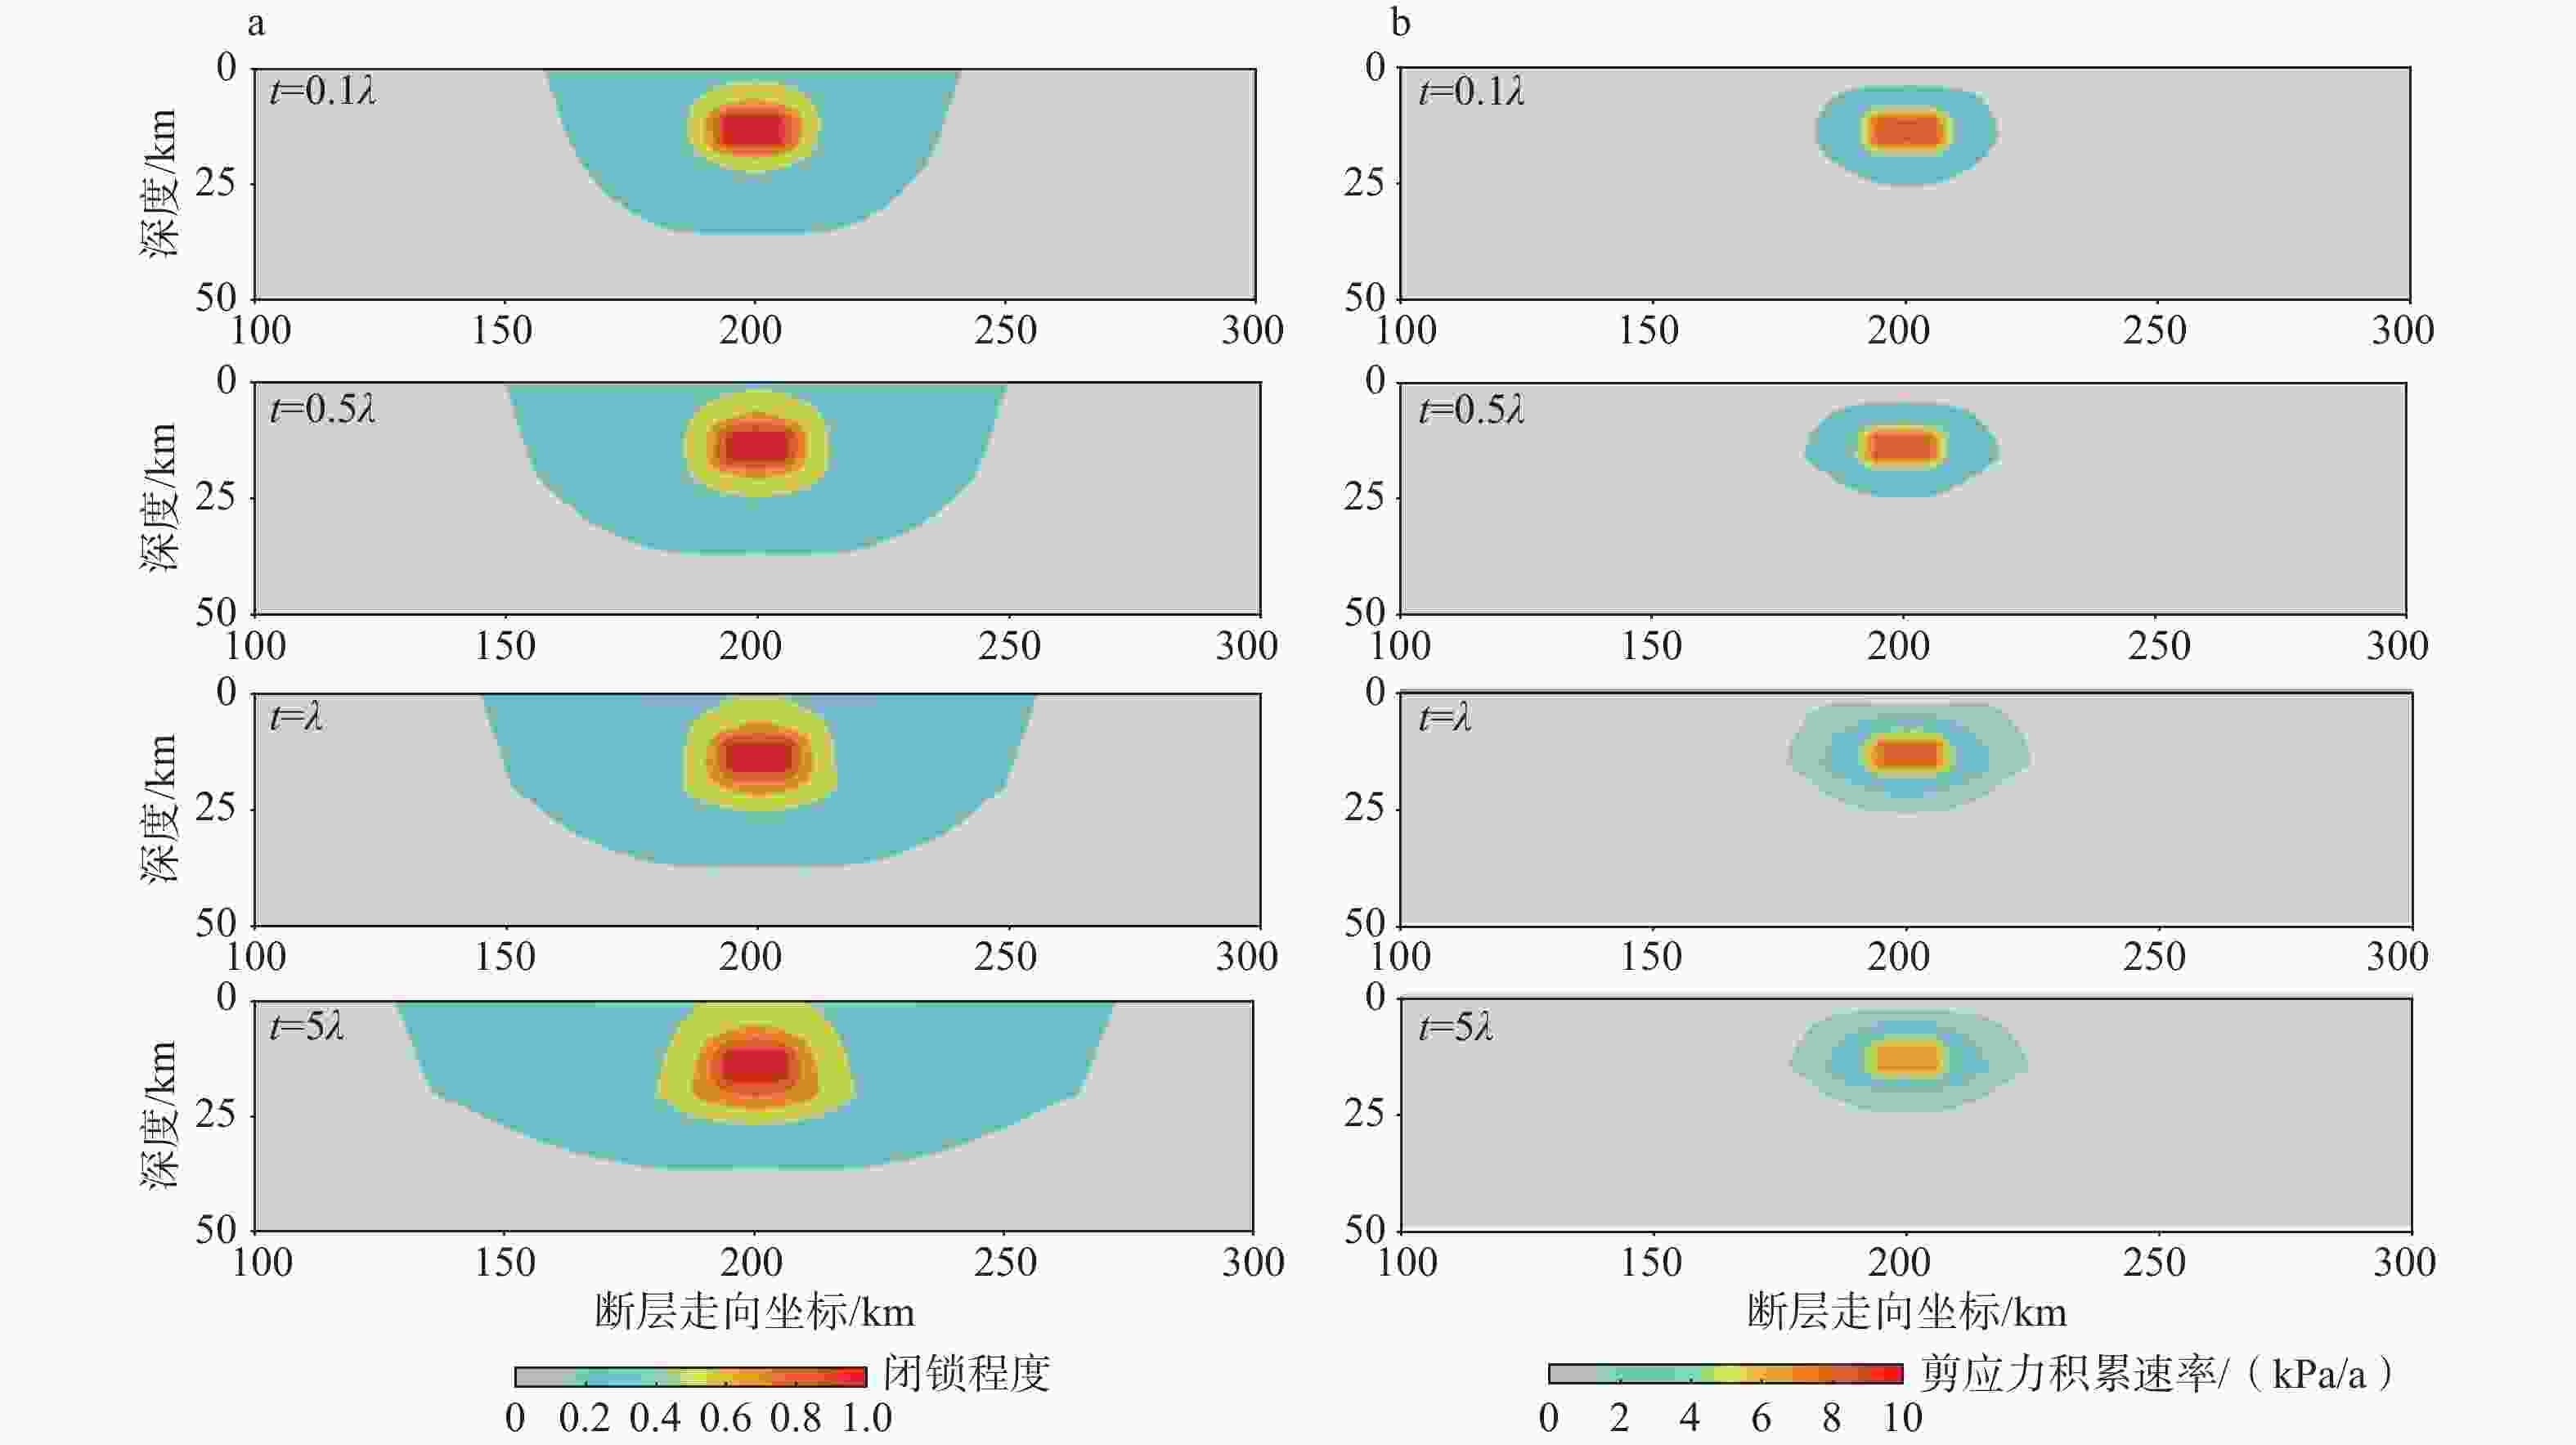
图 4 横向非均匀黏度模型计算的闭锁程度和剪应力积累速率的时空演化特征
a—闭锁程度;b—剪应力积累速率
Figure 4. Spatiotemporal evolution of the ISC and shear stress accumulation rates derived from the heterogeneous model
(a) Interseismic coupling (ISC); (b) Shear stress accumulation rates
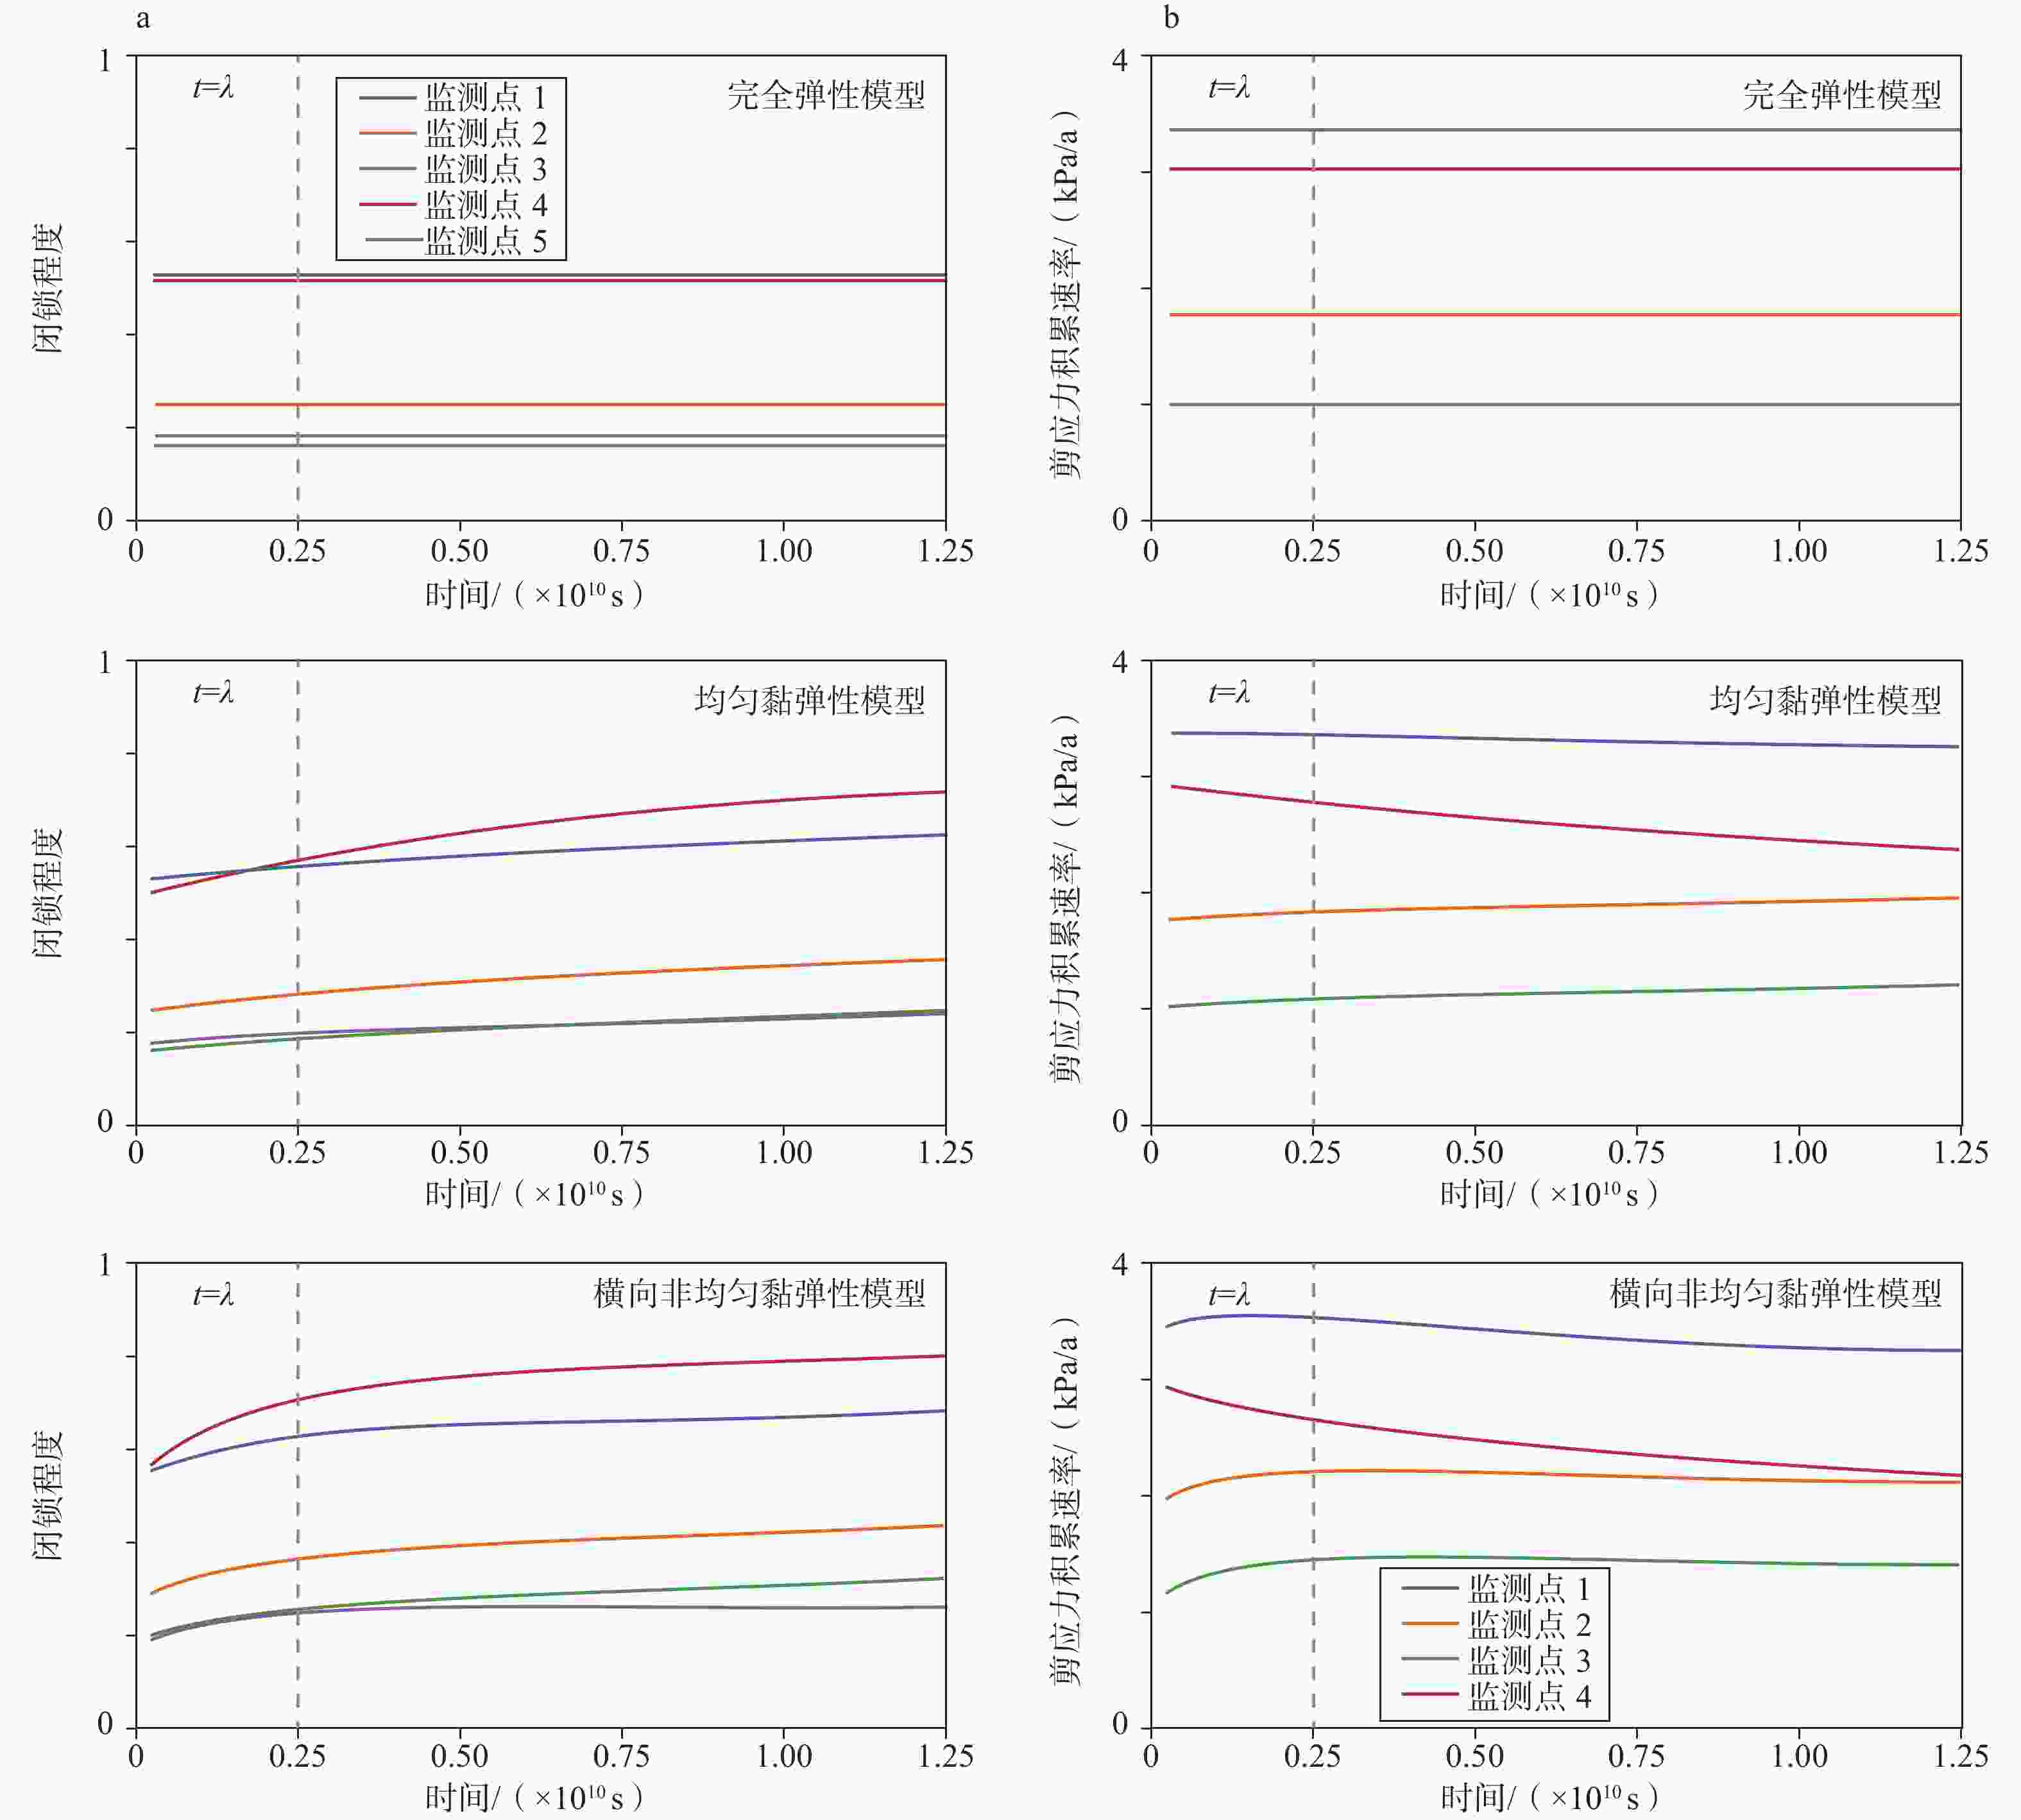
图 5 监测点闭锁程度及剪应力积累速率随时间的变化
a—闭锁程度;b—剪应力积累速率
Figure 5. Temporal evolution of the ISC and shear stress accumulation rates at the monitoring points
(a) Interseismic coupling (ISC); (b) Shear stress accumulation rates
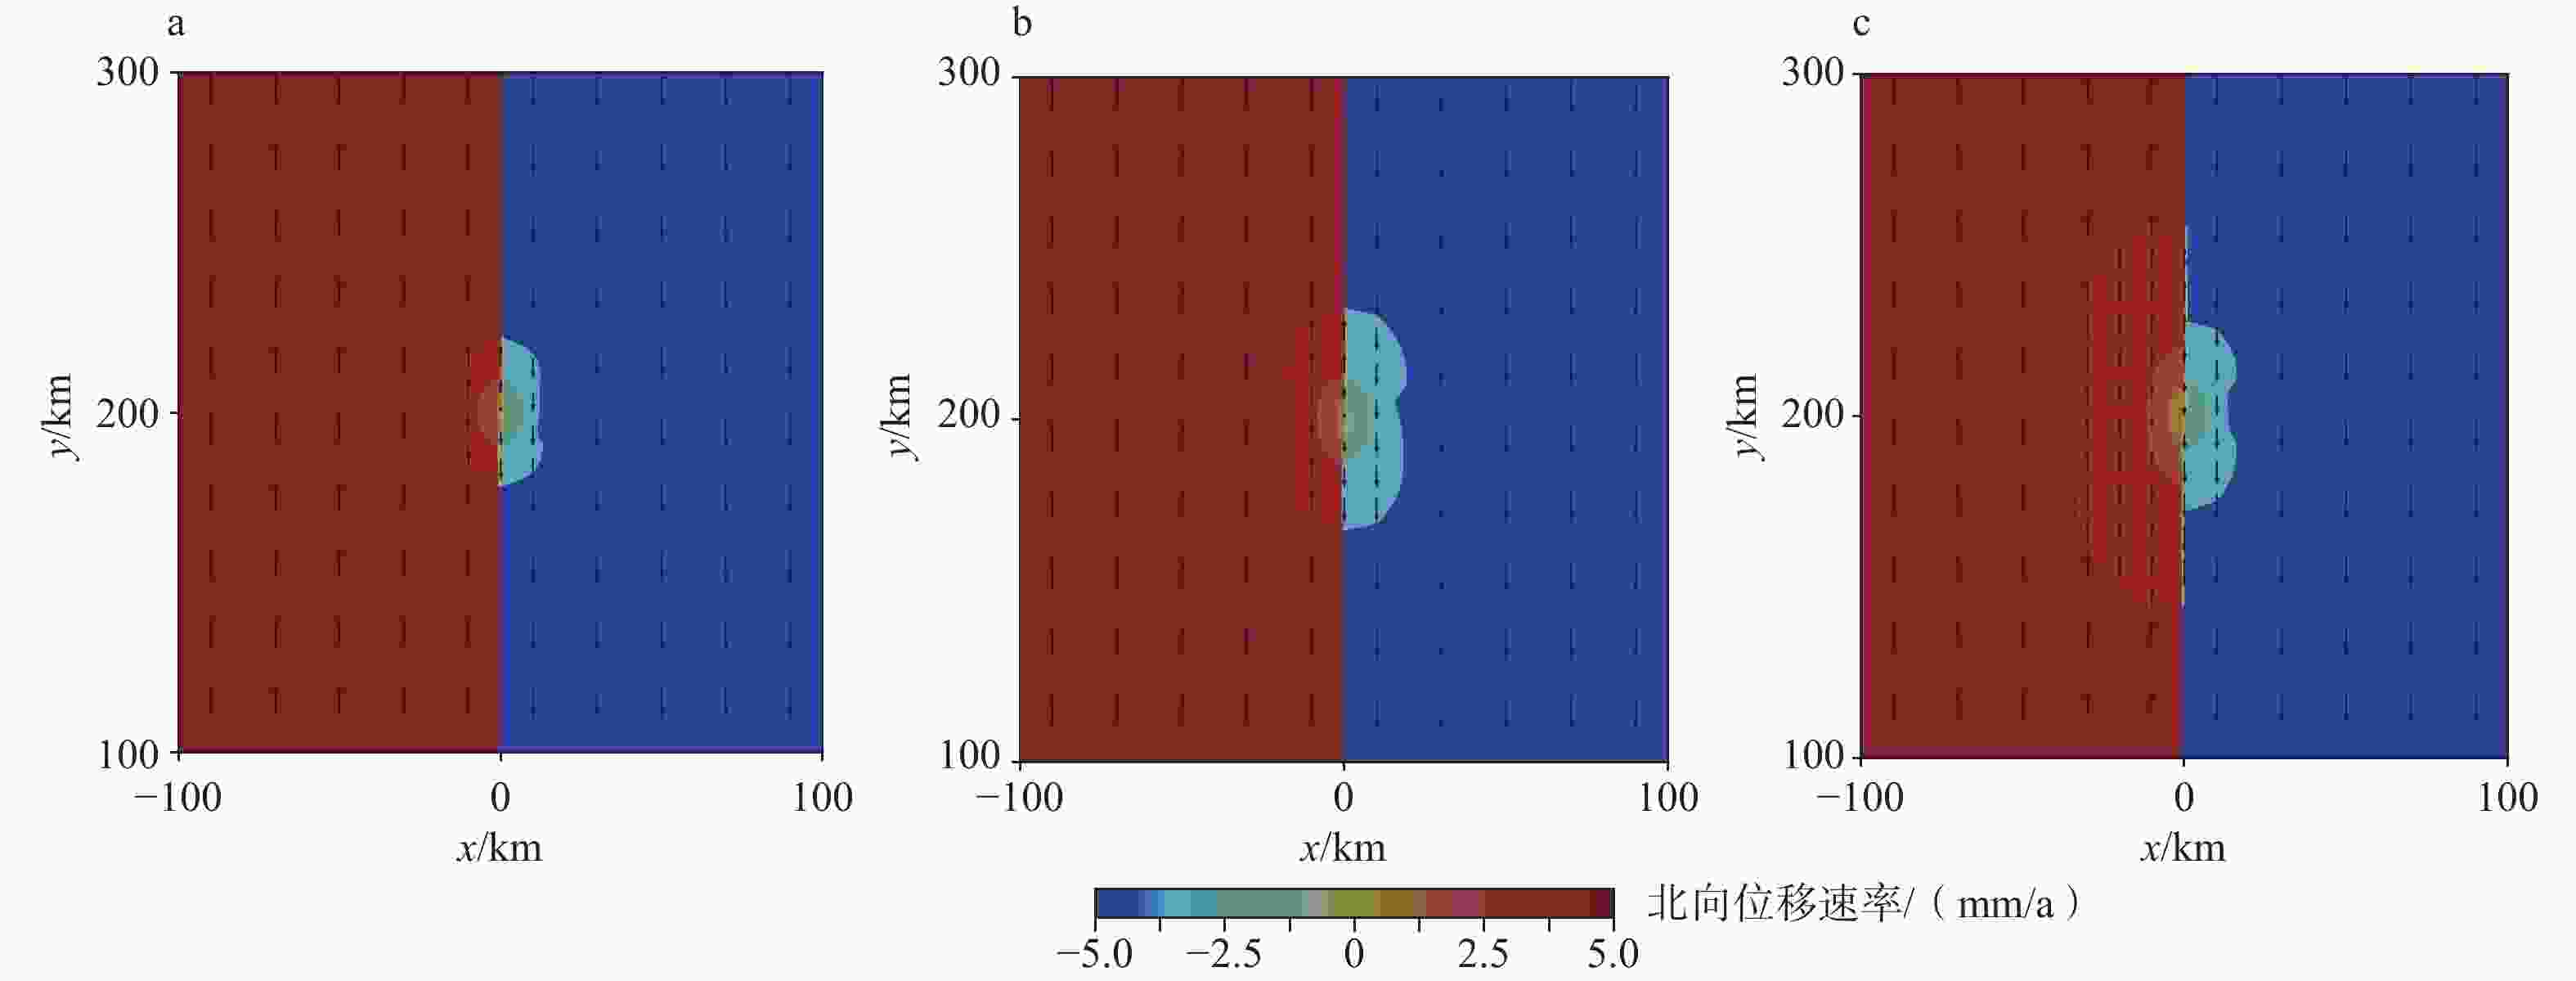
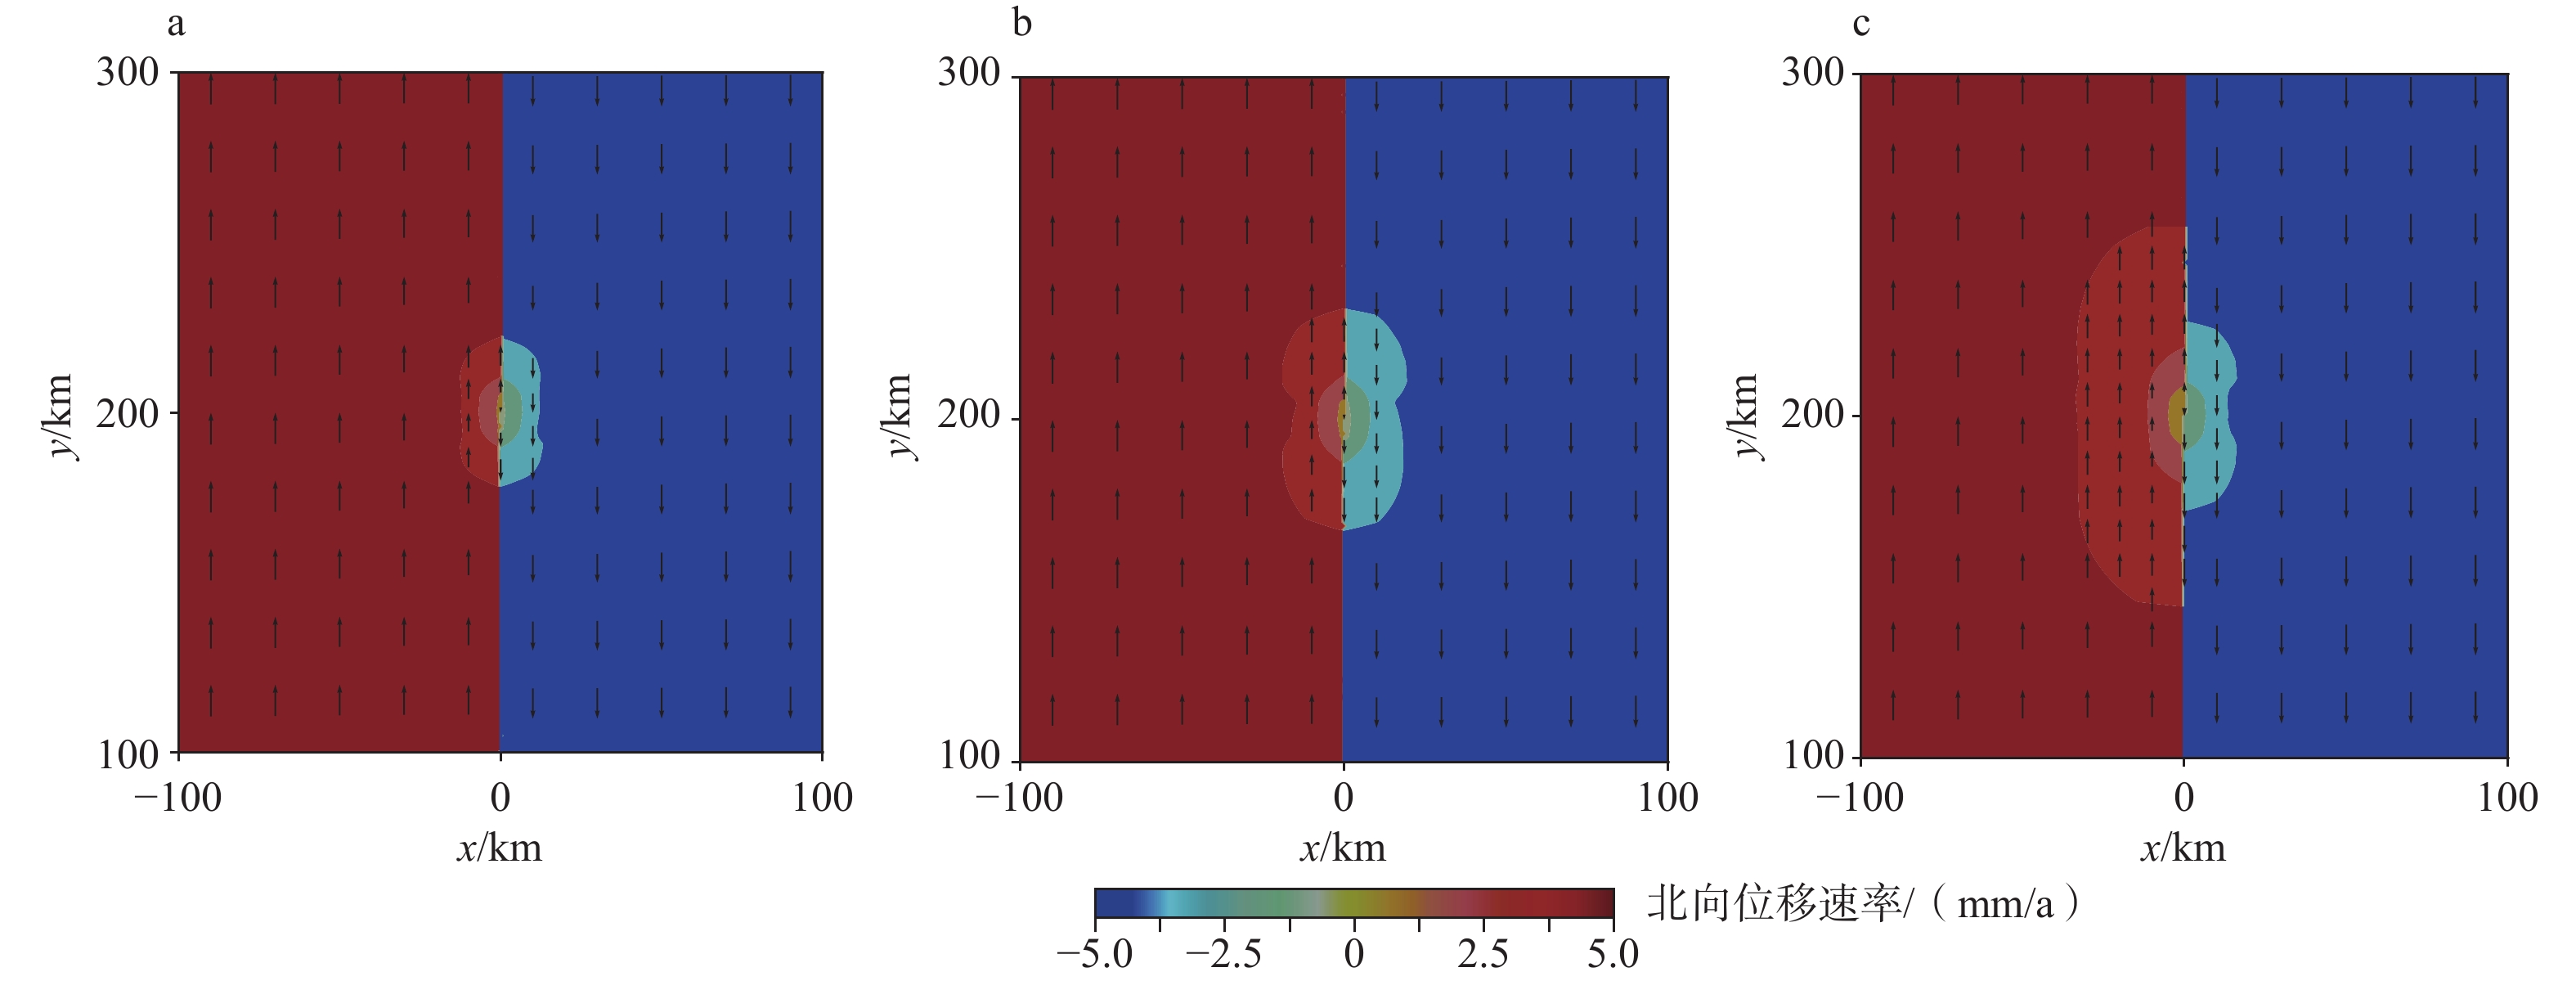
图 6 北向位移速率云图
a—完全弹性模型;b—横向均匀黏弹性模型(时间为5 λ,即1.25×10¹⁰ s);c—横向非均匀黏弹性模型(时间为5 λ,即1.25×10¹⁰ s)
Figure 6. Contour map of the northward displacement rate
(a) Elastic model; (b) Homogeneous viscoelastic model; (c) Heterogeneous viscoelastic modelThe observed depth is 8 km for all panels. The snapshots in panels (b) and (c) represent a time of 5 λ (1.25 × 10¹⁰ s).
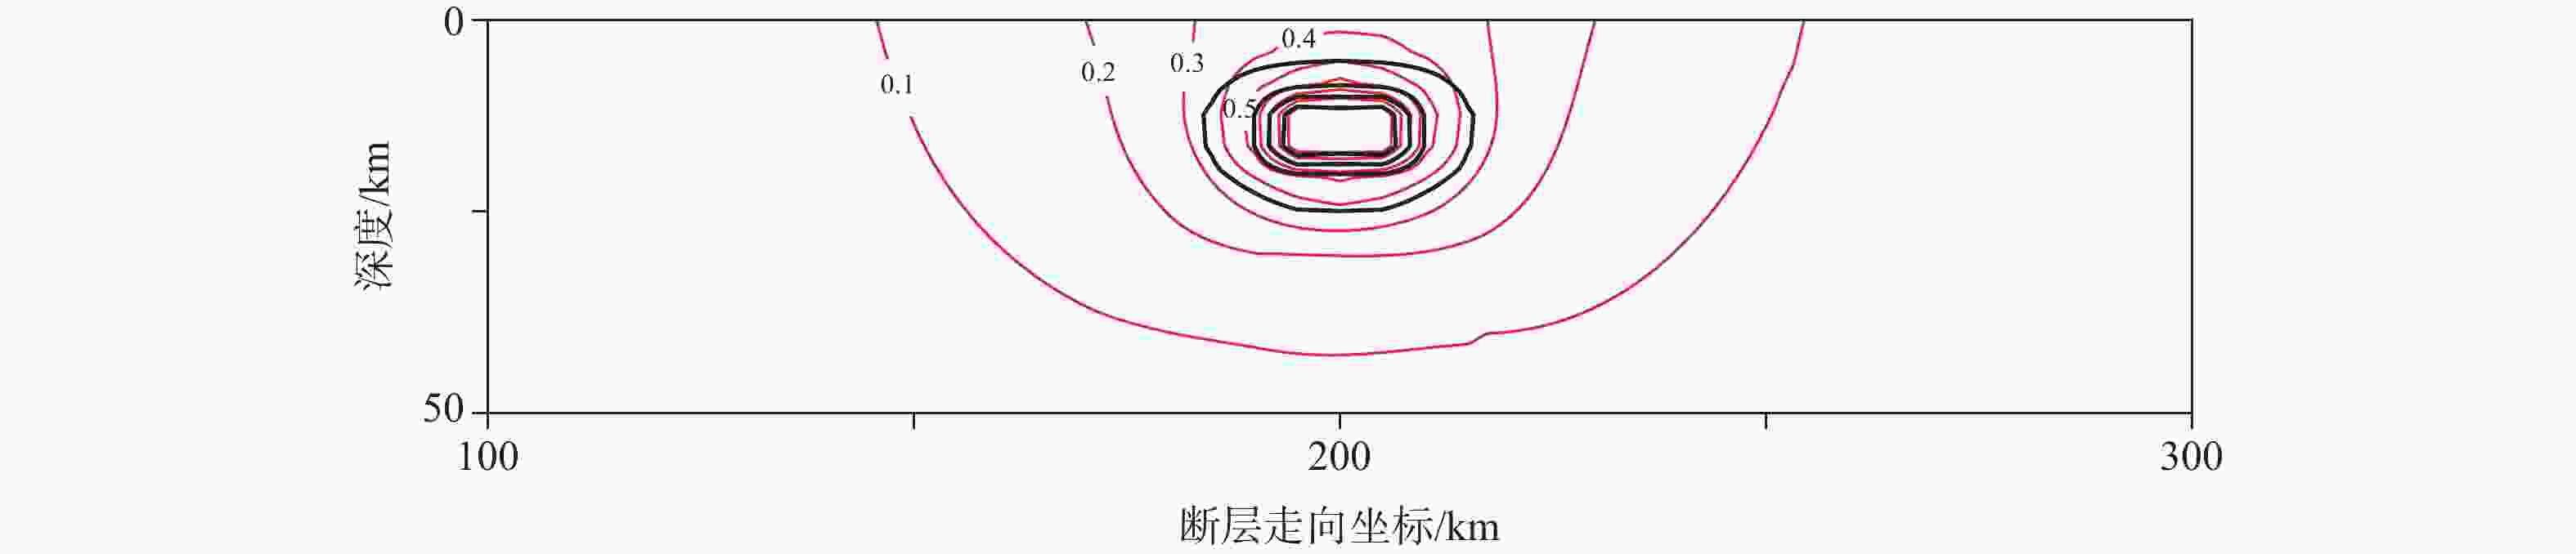
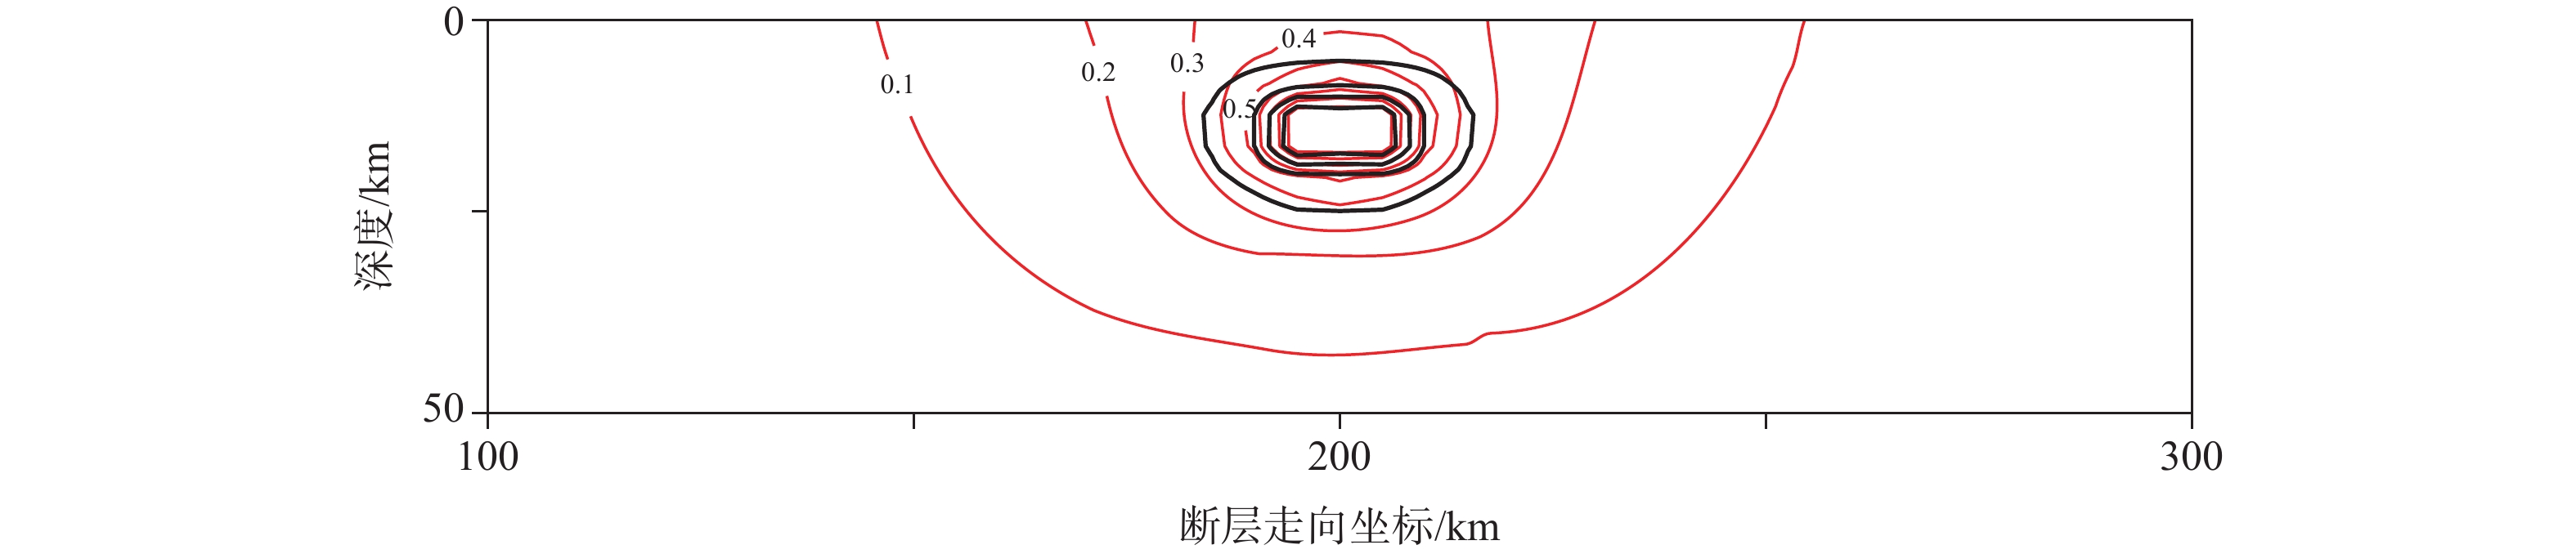
图 7 由弹性模型得出的凹凸体附近闭锁程度和剪应力归一化因子等值线
红线表示ISC等值线;黑线表示Φτ等值线,等值线间隔为0.2,由凹凸体向外扩展的4根黑线分别为Φτ=0.8、0.6、0.4、0.2
Figure 7. Contour map of the ISC and shear stress normalization factor near an asperity derived from the elastic model
Red lines represent the ISC contour lines at an interval of 0.1. Black lines represent the Φτ contour lines at an interval of 0.2. The four black lines extending outward from the asperity were 0.8, 0.6, 0.4 and 0.2.
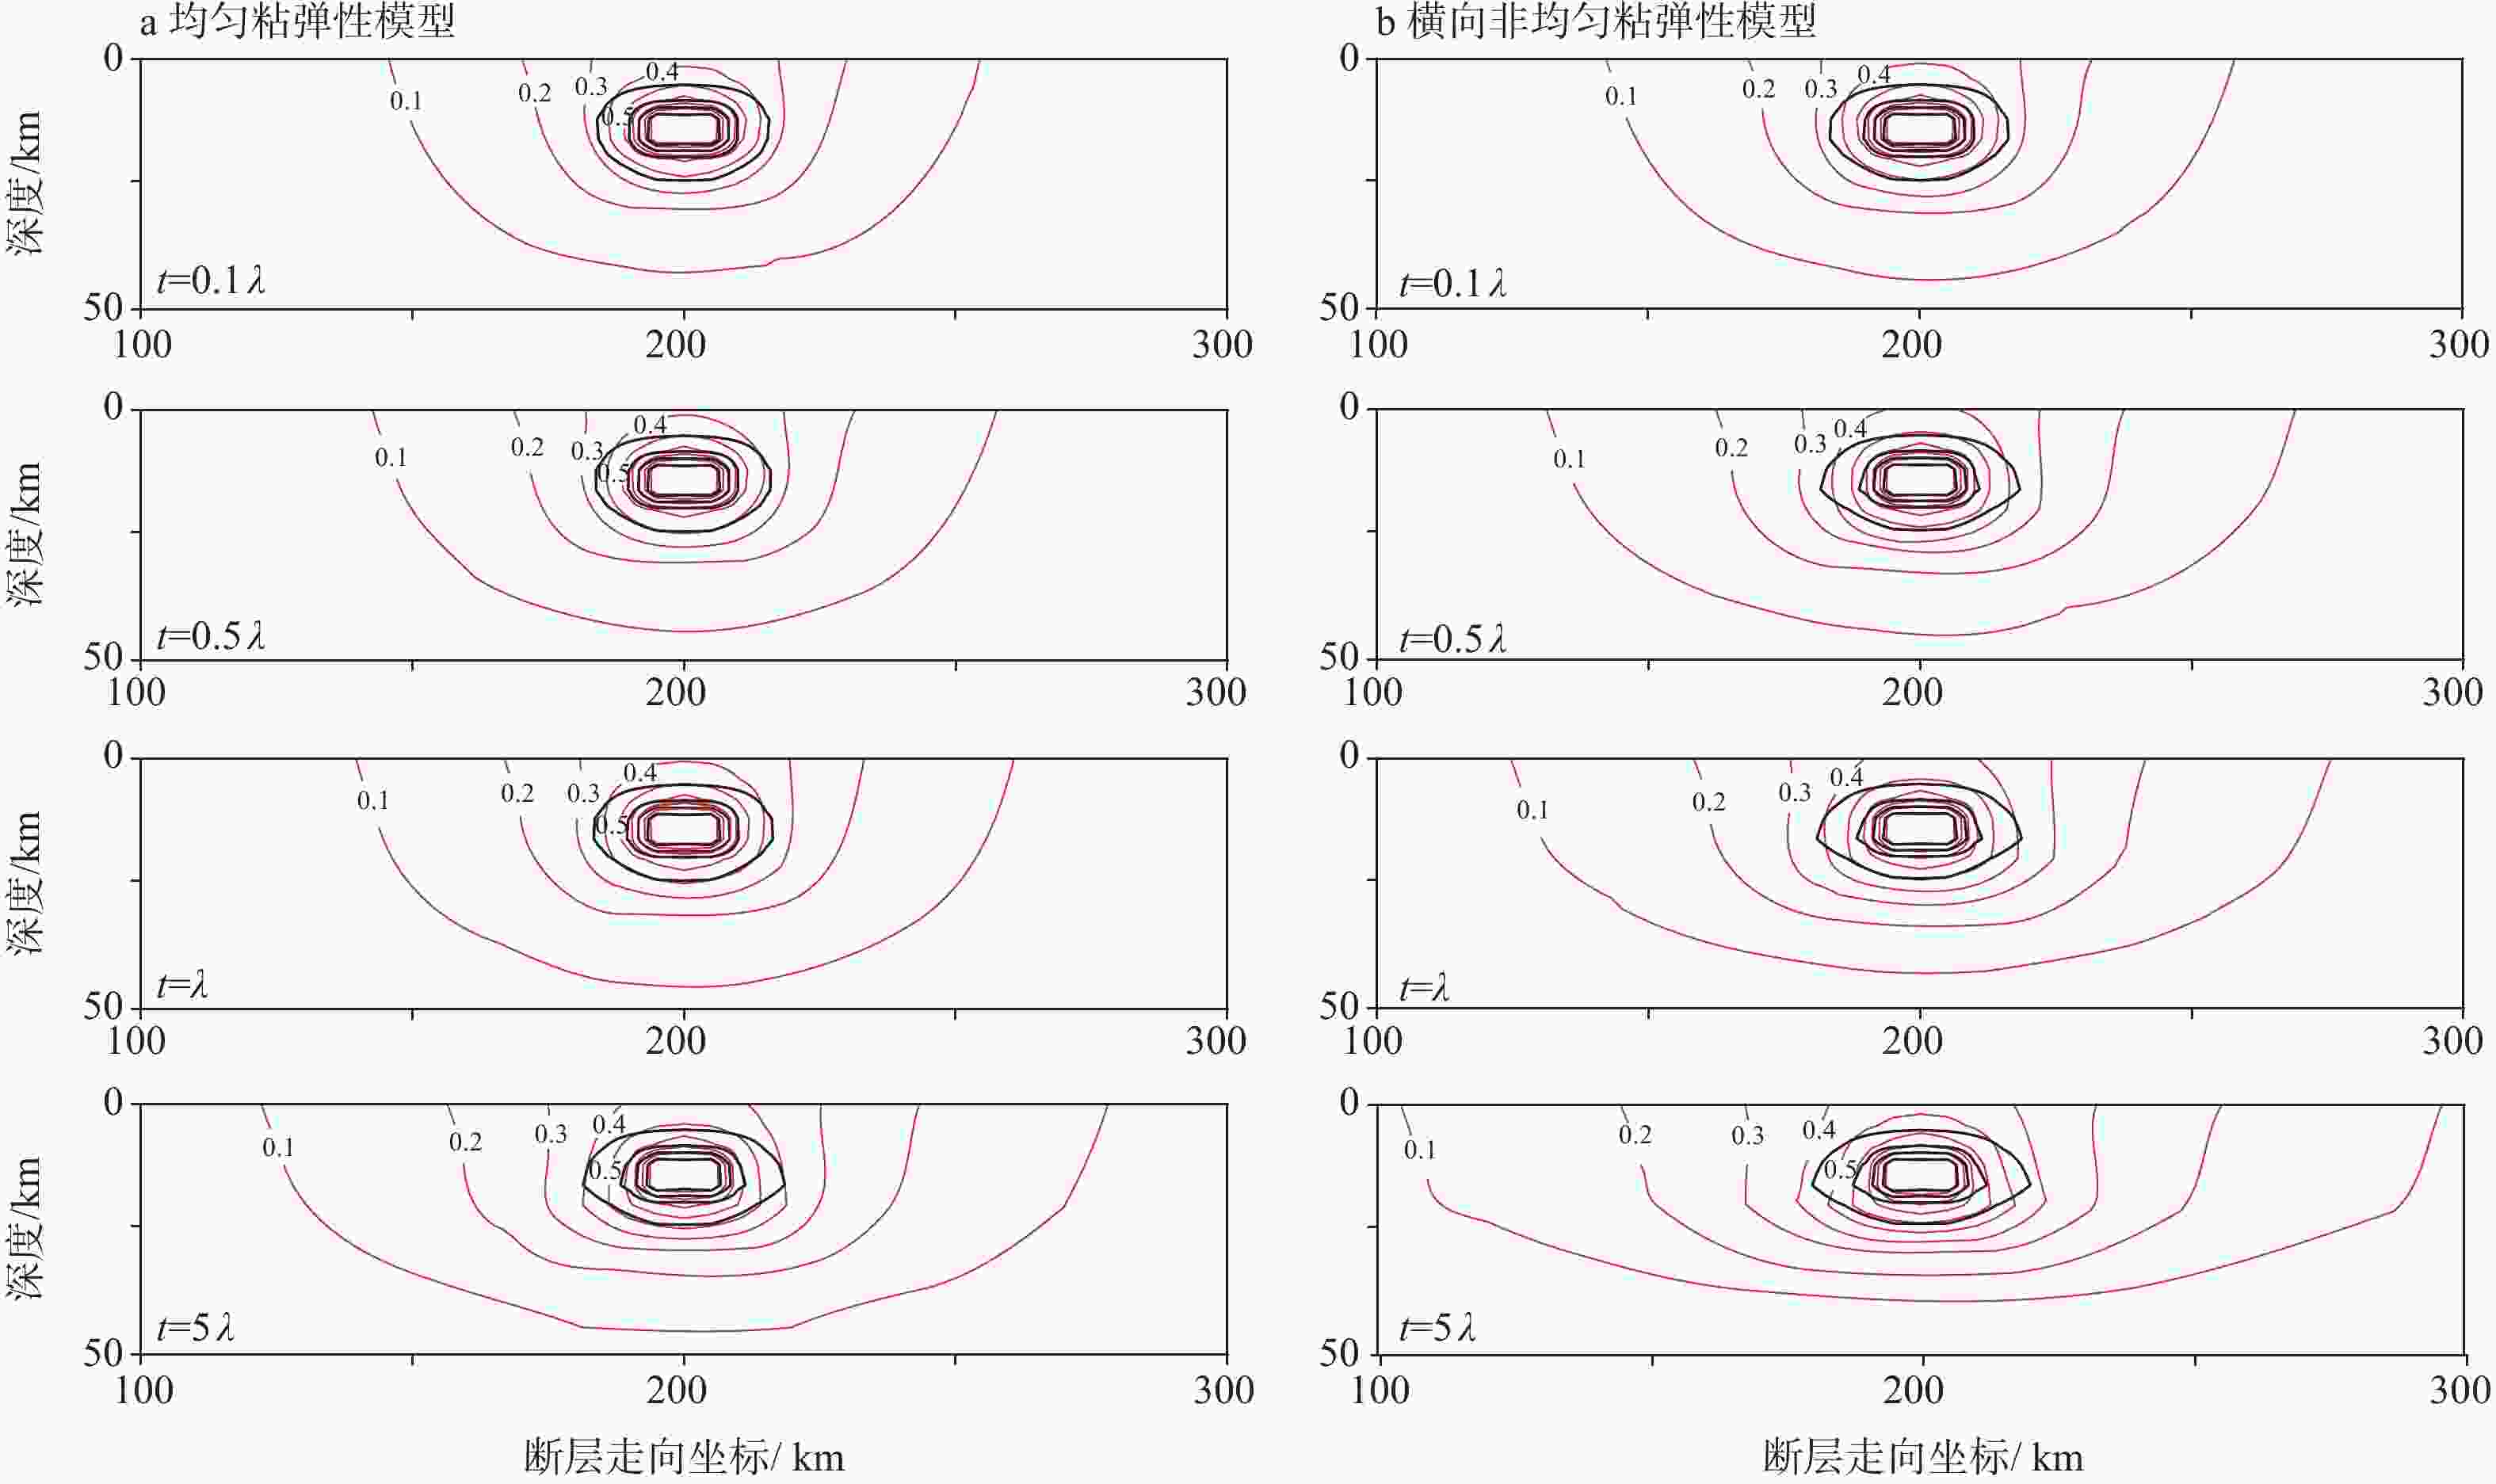
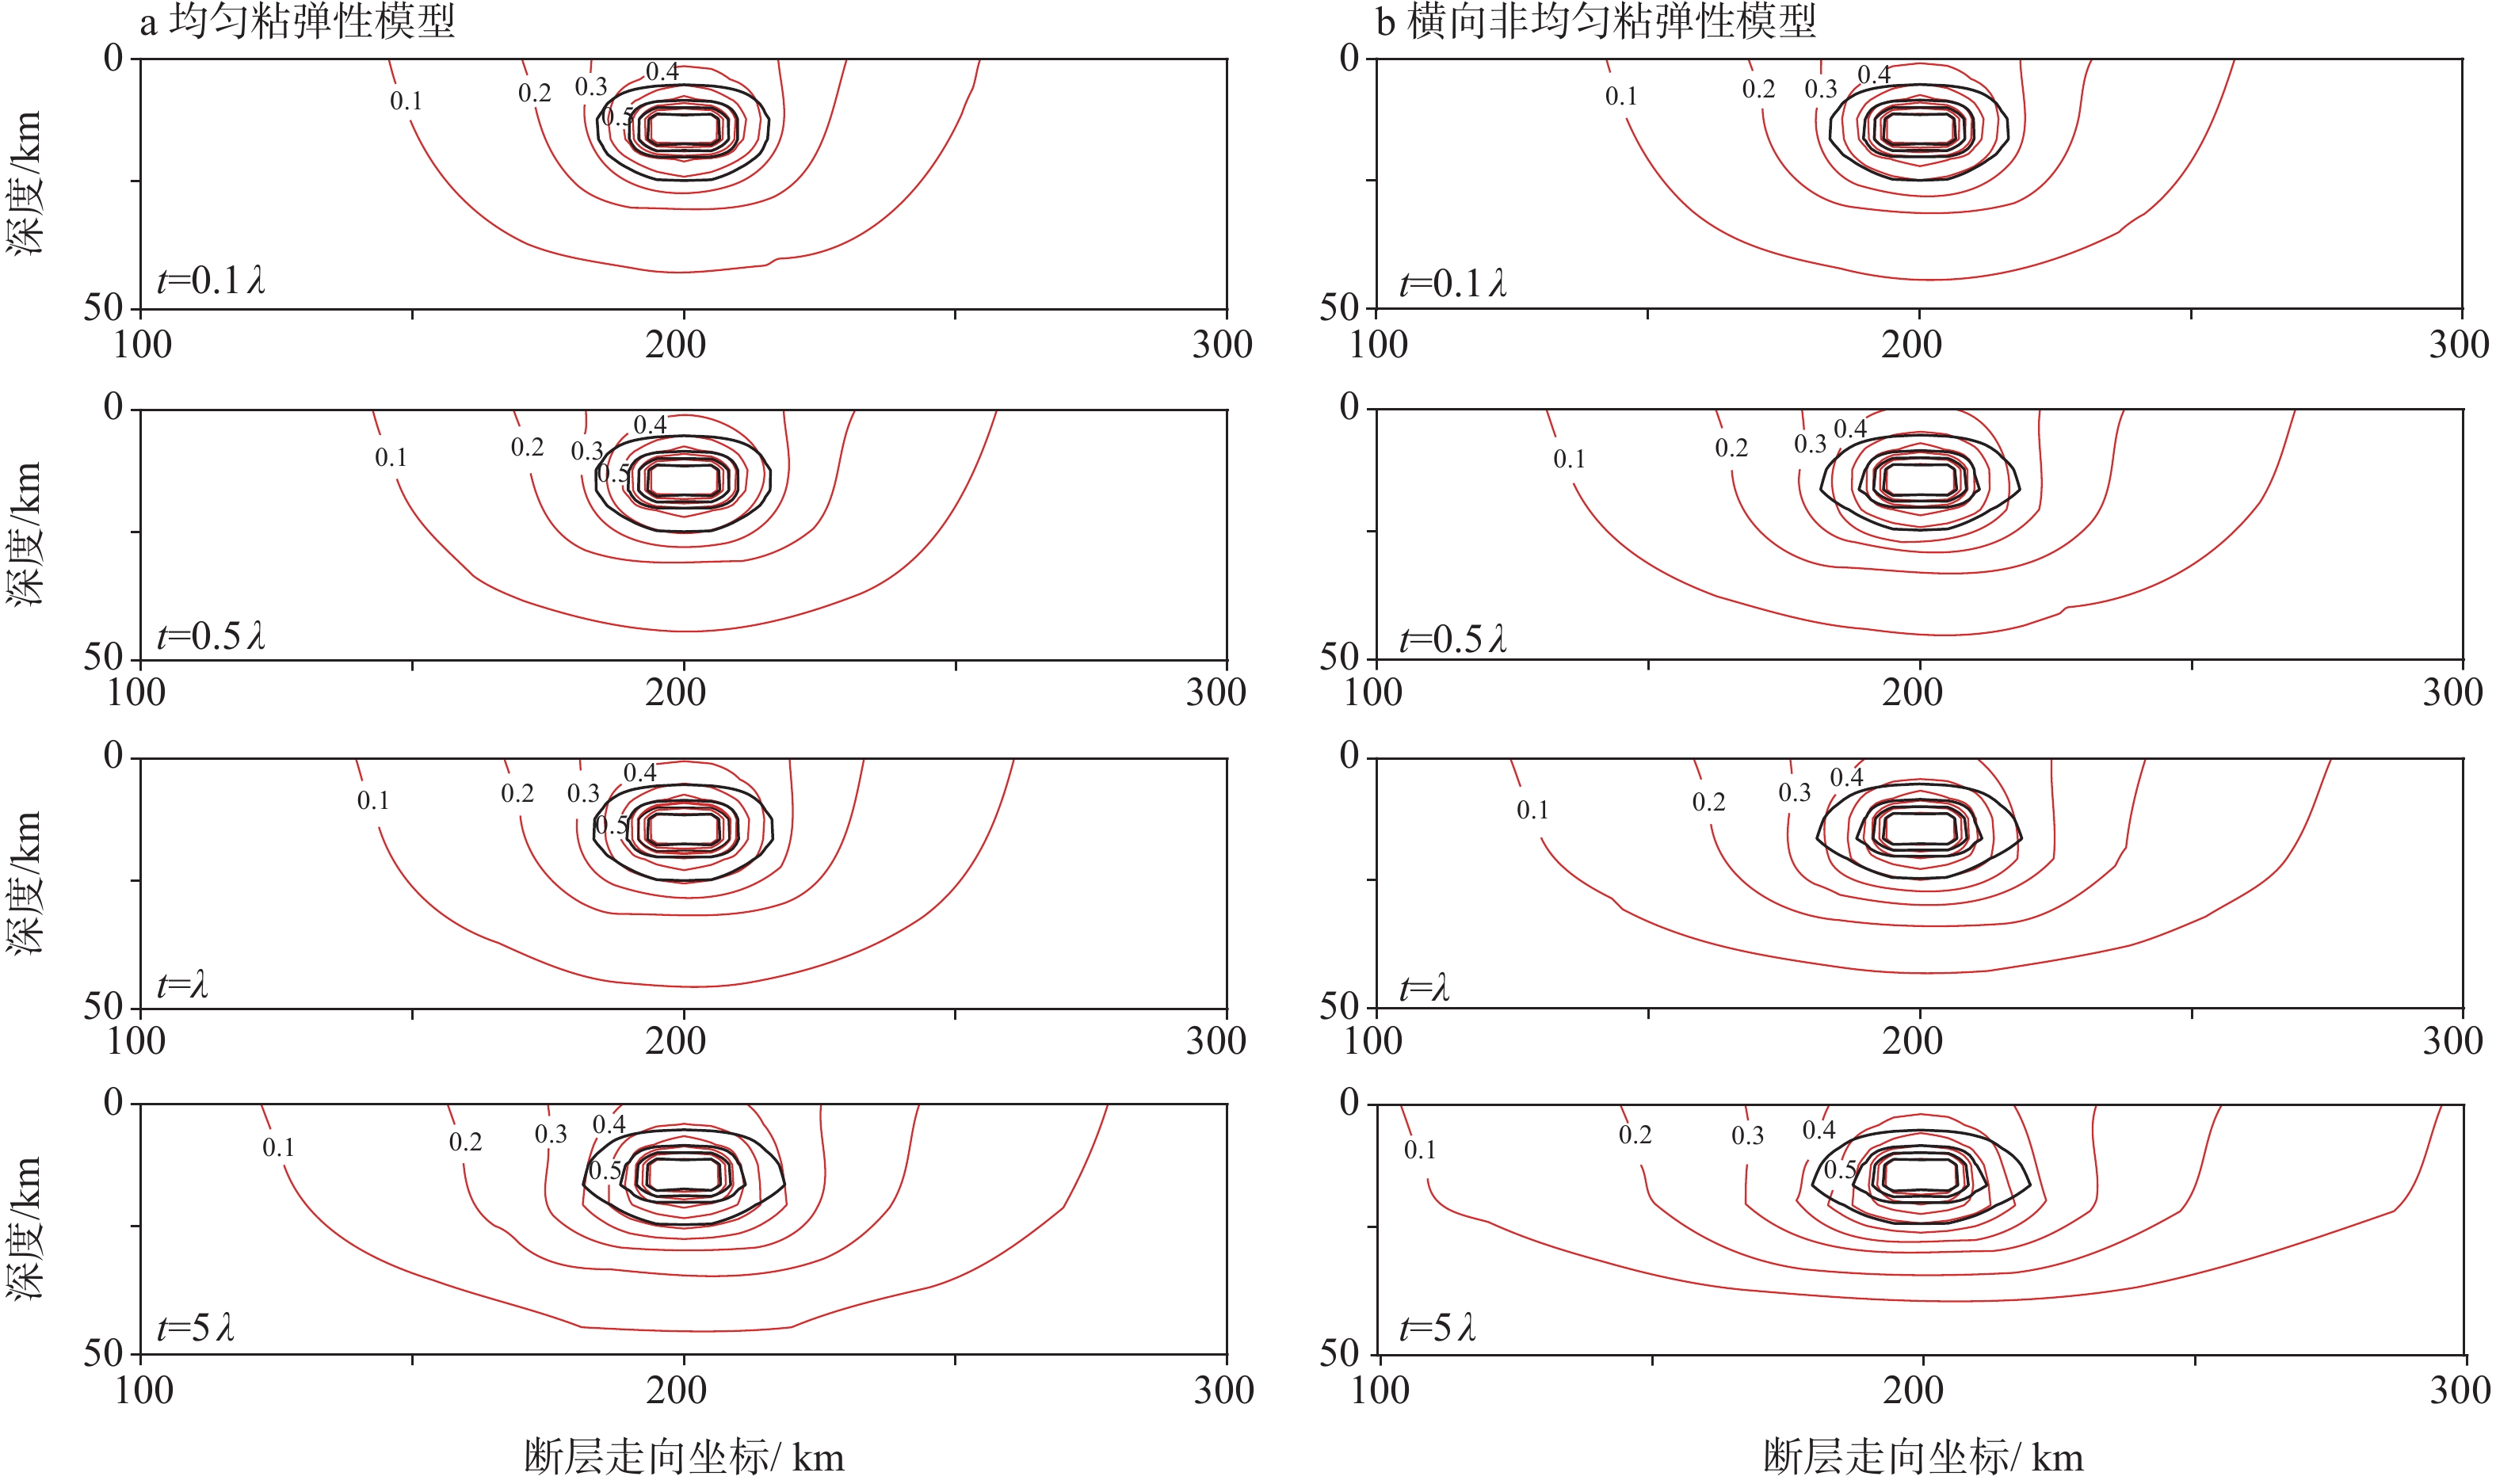
图 8 由黏弹性模型给出的凹凸体附近闭锁程度和剪应力归一化因子的时空演化特征
a—均匀黏弹性模型;b—非均匀黏弹性模型红线表示ISC等值线;黑线表示Φτ等值线,由凹凸体向外扩展的4根黑线分别为Φτ=0.8、0.6、0.4、0.2
Figure 8. Spatiotemporal evolution of the ISC and shear stress normalization factor near an asperity derived from the viscoelastic model
(a) Homogeneous viscoelastic model; (b) Heterogeneous viscoelastic model Red lines represent the ISC contour lines at an interval of 0.1 Black lines represent the Φτ contour lines at an interval of 0.2. The four black lines extending outward from the asperity were 0.8, 0.6, 0.4 and 0.2.
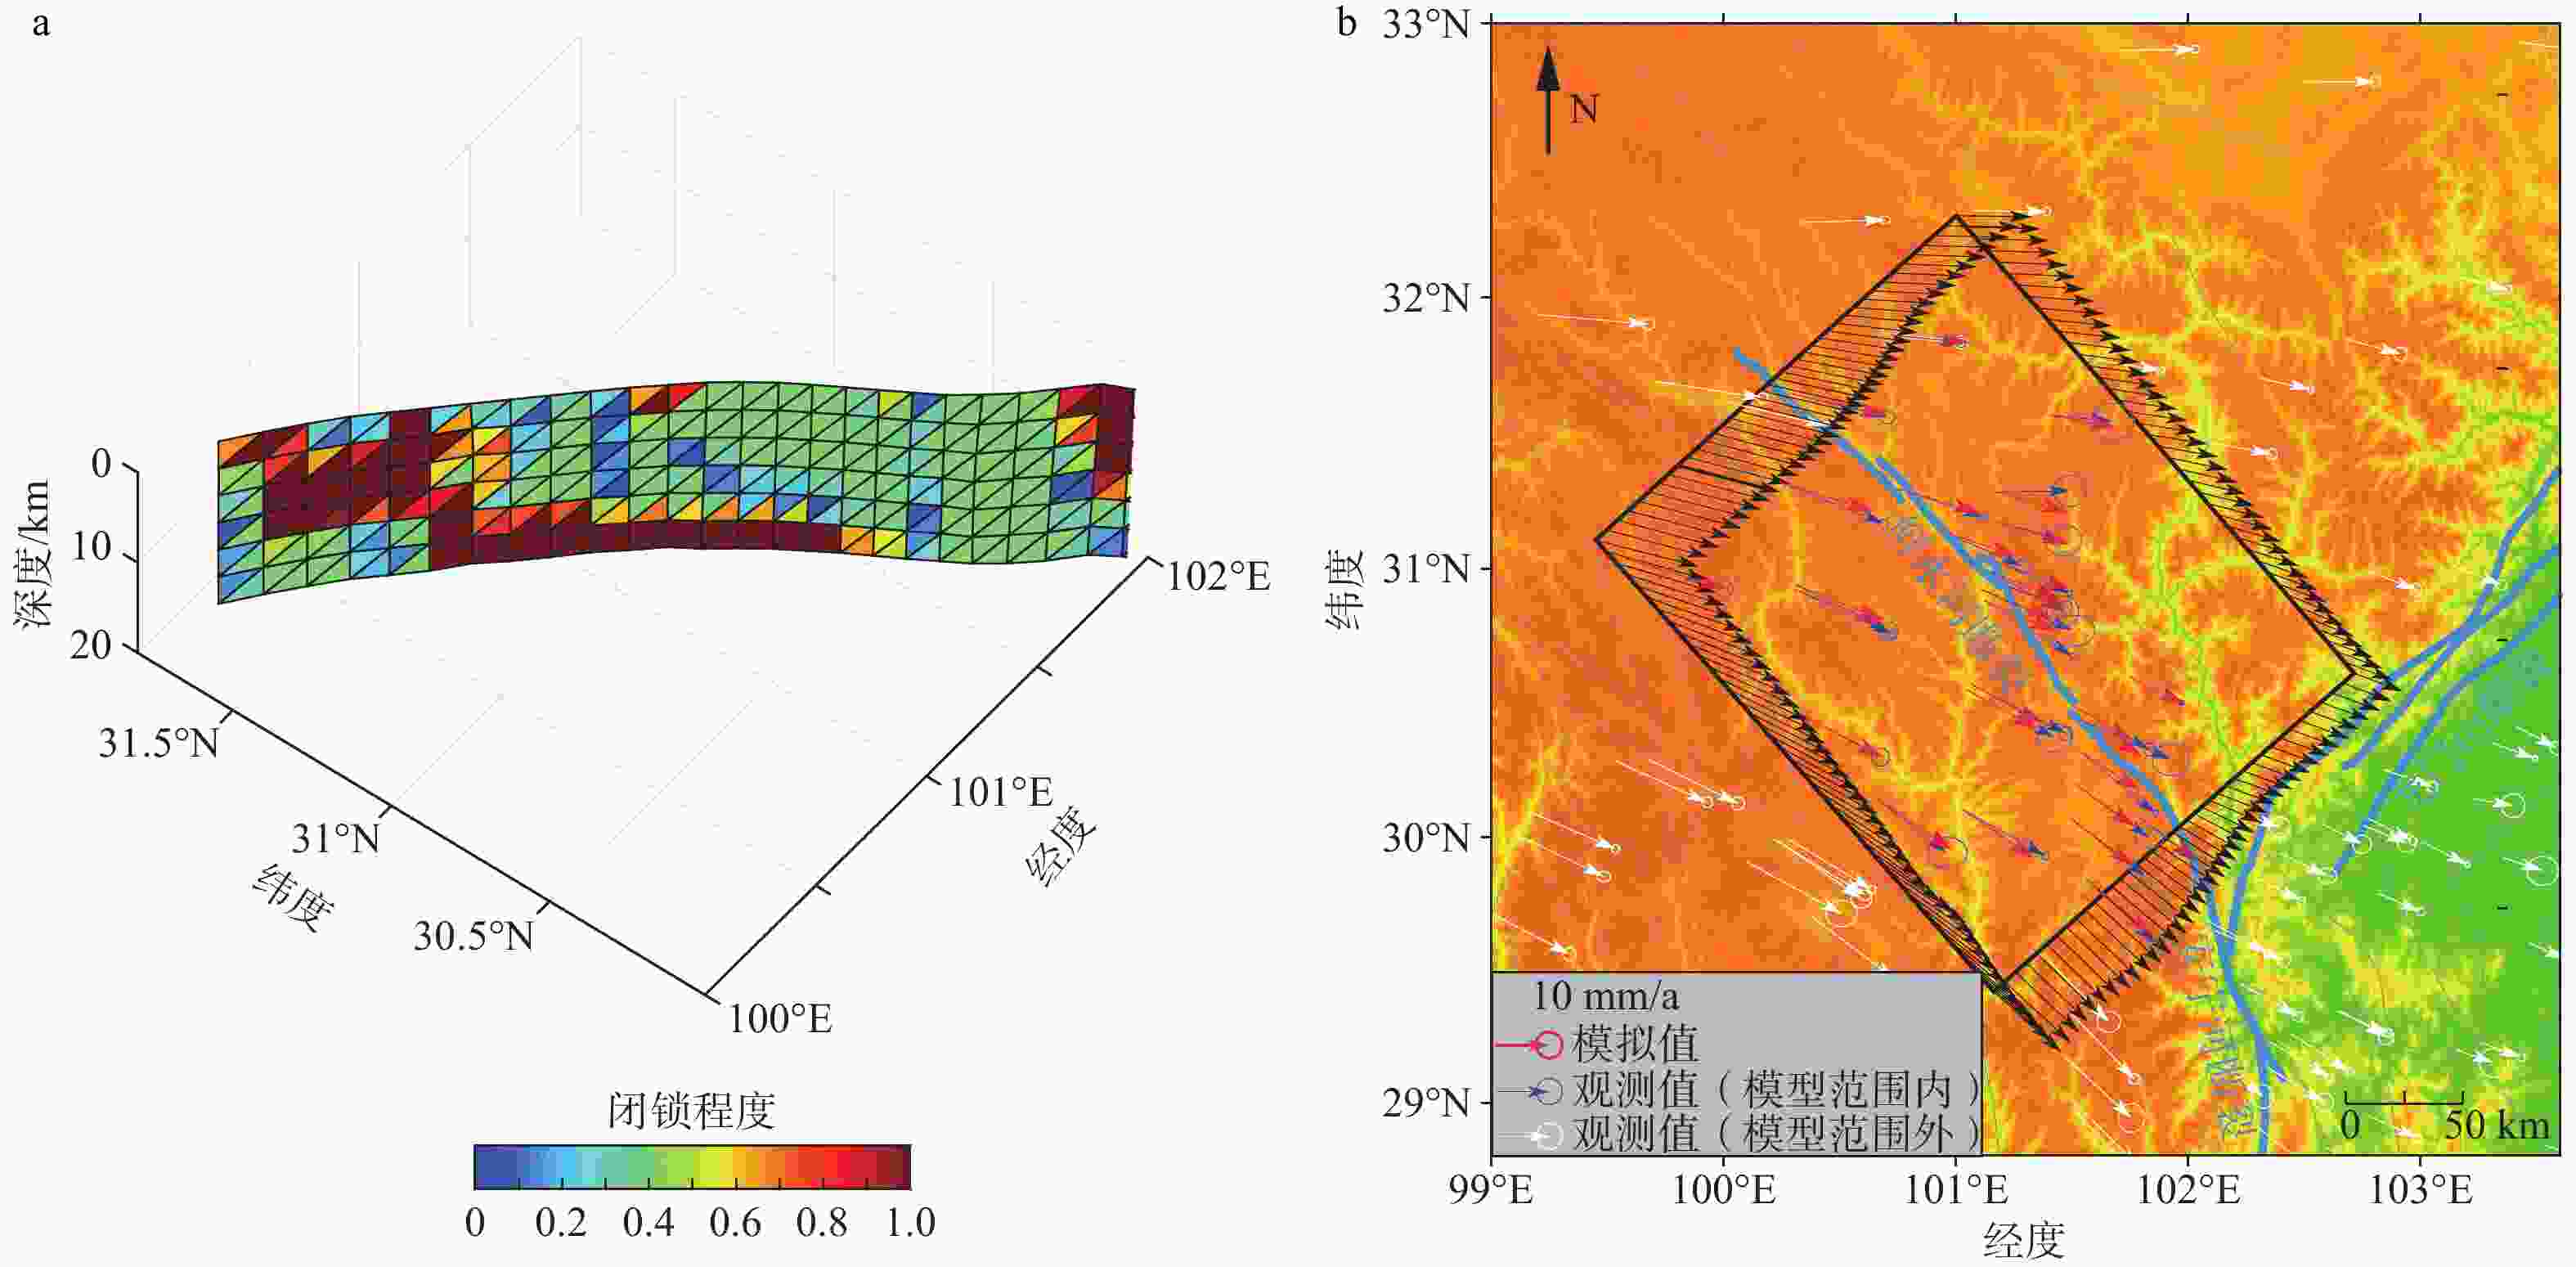
图 9 鲜水河断裂带邻区的震间变形
a—鲜水河断裂带闭锁程度分布图(Jiang et al., 2015;黑色划线区域为此次模型中设置的凹凸体的位置);b—地表速度模拟值和GPS速度的比较(带误差椭圆的红色箭头表示模拟的地表地震间速度,带误差椭圆的蓝色箭头表示模型内部的GPS速度观测值,带误差椭圆的白色箭头表示模型外的GPS速度观测值)
Figure 9. Interseismic deformation near the Xianshuihe fault
(a) Map of the locking degree of the Xianshuihe fault (Jiang et al., 2015; The area outlined by the black line represents the asperities used in this model.) (b) Comparison of simulated surface and GPS velocities (The red arrow with an error ellipse represents the simulated interseismic velocity, blue arrow with an error ellipse represents the GPS velocity, and white arrow with an error ellipse represents the GPS velocity outside the model domain.)
表 1 数值模拟中使用的弹性参数
Table 1. Elastic parameters used in the numerical simulation
分层 弹性模量/Pa 泊松比 密度/(kg/m3) 上地壳 8×10¹⁰ 0.25 2700 下地壳 1×10¹¹ 0.25 3000 岩石圈地幔 1.5×10¹¹ 0.28 3300  下载: 导出CSV
表 2 模型中使用的黏度参数
Table 2. Viscosity parameters used in the model
上地壳块体1 上地壳块体2 下地壳块体1/Pa s 下地壳块体2/Pa s 上地幔块体1/Pa s 上地幔块体2/Pa s 模型1 − − − − − − 模型2 − − 1×10²⁰ 1×10²⁰ 1×10²⁰ 1×10²⁰ 模型3 − − 1×10¹⁹ 1×10²⁰ 1×10¹⁹ 1×10²⁰
下载: 导出CSV
表 3 鲜水河断裂带数值模拟中使用的参数
Table 3. Parameters used in the numerical simulation of the Xianshuihe fault zone
分层 深度/km 弹性模量/Pa 泊松比 密度/(kg/m3) 黏度/(Pa s) 上地壳 18 8× 10¹⁰ 0.25 2700 下地壳 18 1× 10¹¹ 0.25 3000 1×10²⁰ 岩石圈地幔 64 1.5× 10¹¹ 0.28 3300 1×10²⁰
下载: 导出CSV
-
[1] ALMEIDA R, LINDSEY E O, BRADLEY K, et al., 2018. Can the updip limit of frictional locking on megathrusts be detected geodetically? Quantifying the effect of stress shadows on near-trench coupling[J]. Geophysical Research Letters, 45(10): 4754-4763. doi: 10.1029/2018GL077785 [2] BAI Y J, NI H Y, GE H, 2019. Advances in research on the geohazard effect of active faults on the southeastern margin of the Tibetan Plateau[J]. Journal of Geomechanics, 25(6): 1116-1128. (in Chinese with English abstract [3] BRACE W F, BYERLEE J D, 1966. Stick-slip as a mechanism for earthquakes[J]. Science, 153(3739): 990-992. doi: 10.1126/science.153.3739.990 [4] BYRNE D E, DAVIS D M, SYKES L R, 1988. Loci and maximum size of thrust earthquakes and the mechanics of the shallow region of subduction zones[J]. Tectonics, 7(4): 833-857. doi: 10.1029/TC007i004p00833 [5] CAMERON W E, NISBET E G, DIETRICH V J, 1979. Boninites, komatiites and ophiolitic basalts[J]. Nature, 280(5723): 550-553. doi: 10.1038/280550a0 [6] CARTER N L, FRIEDMAN M, LOGAN J M, et al. , 1981. Mechanical behavior of crustal rocks: the handin volume[M]. Washington DC: American Geophysical Union. [7] CHLIEH M, AVOUAC J P, SIEH K, et al., 2008. Heterogeneous coupling of the Sumatran megathrust constrained by geodetic and paleogeodetic measurements[J]. Journal of Geophysical Research: Solid Earth, 113(B5): B05305. [8] DENG J S, KENNETH H, MICHAEL G, et al., 1999. Stress loading from viscous flow in the lower crust and triggering of aftershocks following the 1994 Northridge, California, earthquake[J]. Geophysical Research Letters, 26(21): 3209-3212. doi: 10.1029/1999GL010496 [9] DIETERICH J H, 1979. Modeling of rock friction: 1. Experimental results and constitutive equations[J]. Journal of Geophysical Research: Solid Earth, 84(B5): 2161. doi: 10.1029/JB084iB05p02161 [10] DUNHAM E M, BELANGER D, CONG L, et al., 2011. Earthquake ruptures with strongly rate-weakening friction and off-fault plasticity, Part 2: nonplanar faults[J]. Bulletin of the Seismological Society of America, 101(5): 2308-2322. doi: 10.1785/0120100076 [11] FENG C J, QI B S, ZHANG P, et al., 2018. Crustal stress field and its tectonic significance near the Longmenshan Fault Belt, after the Wenchuan Ms8.0 earthquake[J]. Journal of Geomechanics, 24(4): 439-451. (in Chinese with English abstract [12] FREED A M, LIN J, 1998. Time-dependent changes in failure stress following thrust earthquakes[J]. Journal of Geophysical Research: Solid Earth, 103(B10): 24393-24409. doi: 10.1029/98JB01764 [13] GE W P, SHEN Z K, MOLNAR P, et al., 2022. GPS determined asymmetric deformation across central Altyn Tagh fault reveals rheological structure of Northern Tibet[J]. Journal of Geophysical Research: Solid Earth, 127(9): e2022JB024216. doi: 10.1029/2022JB024216 [14] HERMAN M W, GOVERS R, 2020. Locating fully locked asperities along the South America subduction megathrust: a new physical interseismic inversion approach in a Bayesian framework[J]. Geochemistry, Geophysics, Geosystems, 21(8): e2020GC009063. doi: 10.1029/2020GC009063 [15] HOULIÉ N, ROMANOWICZ B, 2011. Asymmetric deformation across the San Francisco Bay Area faults from GPS observations in Northern California[J]. Physics of the Earth and Planetary Interiors, 184(3-4): 143-153. doi: 10.1016/j.pepi.2010.11.003 [16] HUANG L Y, ZHANG B, SHI Y L, 2020. Def3D, a FEM simulation tool for computing deformation near active faults and volcanic centers[J]. Physics of the Earth and Planetary Interiors, 309: 106601. doi: 10.1016/j.pepi.2020.106601 [17] HUANG L Y, ZHANG B, SHI Y L, 2021. Stress transfer at the northeastern end of the Bayan Har Block and its implications for seismic hazards: Insights from numerical simulations[J]. Earth and Space Science, 8(12): e2021EA001947. doi: 10.1029/2021EA001947 [18] JIANG G Y, XU X W, CHEN G H, et al., 2015. Geodetic imaging of potential seismogenic asperities on the Xianshuihe-Anninghe-Zemuhe fault system, southwest China, with a new 3-D viscoelastic interseismic coupling model[J]. Journal of Geophysical Research: Solid Earth, 120(3): 1855-1873. doi: 10.1002/2014JB011492 [19] KANEKO Y, AVOUAC J P, LAPUSTA N, 2010. Towards inferring earthquake patterns from geodetic observations of interseismic coupling[J]. Nature Geoscience, 3(5): 363-369. doi: 10.1038/ngeo843 [20] KONG W L, HUANG L Y, YAO R, et al., 2022. Contemporary kinematics along the Xianshuihe-Xiaojiang fault system: insights from numerical simulation[J]. Tectonophysics, 839: 229545. doi: 10.1016/j.tecto.2022.229545 [21] LACHENBRUCH A H, 1980. Frictional heating, fluid pressure, and the resistance to fault motion[J]. Journal of Geophysical Research: Solid Earth, 85(B11): 6097-6112. doi: 10.1029/JB085iB11p06097 [22] LI S Y, MORENO M, BEDFORD J, et al., 2015. Revisiting viscoelastic effects on interseismic deformation and locking degree: a case study of the Peru‐North Chile subduction zone[J]. Journal of Geophysical Research: Solid Earth, 120(6): 4522-4538. doi: 10.1002/2015JB011903 [23] LI S Y, WANG K L, WANG Y Z, et al., 2018a. Geodetically inferred locking state of the cascadia megathrust based on a viscoelastic earth model[J]. Journal of Geophysical Research: Solid Earth, 123(9): 8056-8072. doi: 10.1029/2018JB015620 [24] LI Y C, ZHANG G H, SHAN X J, et al., 2018b. GPS-derived fault coupling of the Longmenshan fault associated with the 2008 mw Wenchuan 7.9 earthquake and its tectonic implications[J]. Remote Sensing, 10(5): 753. doi: 10.3390/rs10050753 [25] LI Y C, SHAN X J, GAO Z Y, et al., 2023. Interseismic coupling, asperity distribution, and earthquake potential on major faults in Southeastern Tibet[J]. Geophysical Research Letters, 50(8): e2022GL101209. doi: 10.1029/2022GL101209 [26] LINDSEY E O, MALLICK R, HUBBARD J A, et al., 2021. Slip rate deficit and earthquake potential on shallow megathrusts[J]. Nature Geoscience, 14(5): 321-326. doi: 10.1038/s41561-021-00736-x [27] LOVELESS J P, MEADE B J, 2011. Spatial correlation of interseismic coupling and coseismic rupture extent of the 2011 MW = 9.0 Tohoku‐oki earthquake[J]. Geophysical Research Letters, 38(17): L17306. [28] LUO G, LIU M, 2018. Stressing rates and seismicity on the major faults in eastern Tibetan Plateau[J]. Journal of Geophysical Research: Solid Earth, 123(12): 10968-10986. [29] LYONS S N, BOCK Y, SANDWELL D T, 2002. Creep along the Imperial Fault, southern California, from GPS measurements[J]. Journal of Geophysical Research: Solid Earth, 107(B10): 2249. [30] MALSERVISI R, FURLONG K P, DIXON T H, 2001. Influence of the earthquake cycle and lithospheric rheology on the dynamics of the Eastern California Shear Zone[J]. Geophysical Research Letters, 28(14): 2731-2734. doi: 10.1029/2001GL013311 [31] MELNICK D, MORENO M, QUINTEROS J, et al., 2017. The super‐interseismic phase of the megathrust earthquake cycle in Chile[J]. Geophysical Research Letters, 44(2): 784-791. doi: 10.1002/2016GL071845 [32] MORENO M, MELNICK D, ROSENAU M, et al., 2012. Toward understanding tectonic control on the M w 8.8 2010 Maule Chile earthquake[J]. Earth and Planetary Science Letters, 321-322: 152-165. doi: 10.1016/j.jpgl.2012.01.006 [33] MURAMOTO T, ITO Y, MIYAKAWA A, et al., 2023. Strain and stress accumulation in viscoelastic splay fault and subducting oceanic crust[J]. Geophysical Research Letters, 50(11): e2023GL103496. doi: 10.1029/2023GL103496 [34] OLESKEVICH D A, HYNDMAN R D, WANG K, 1999. The updip and downdip limits to great subduction earthquakes: thermal and structural models of Cascadia, south Alaska, SW Japan, and Chile[J]. Journal of Geophysical Research: Solid Earth, 104(B7): 14965-14991. doi: 10.1029/1999JB900060 [35] QIAO X, ZHOU Y, 2021. Geodetic imaging of shallow creep along the Xianshuihe fault and its frictional properties[J]. Earth and Planetary Science Letters, 567: 117001. doi: 10.1016/j.jpgl.2021.117001 [36] RIPPERGER J, AMPUERO J P, MAI P M, et al., 2007. Earthquake source characteristics from dynamic rupture with constrained stochastic fault stress[J]. Journal of Geophysical Research: Solid Earth, 112(B4): B04311. [37] RUINA A, 1983. Slip instability and state variable friction laws[J]. Journal of Geophysical Research: Solid Earth, 88(B12): 10359-10370. doi: 10.1029/JB088iB12p10359 [38] SAVAGE P E, GOPALAN S, MIZAN T I, et al., 1995. Reactions at supercritical conditions: applications and fundamentals[J]. AIChE Journal, 41(7): 1723-1778. doi: 10.1002/aic.690410712 [39] SHI Y L, CAO J L, 2008. Effective viscosity of China continental lithosphere[J]. Earth Science Frontiers, 15(3): 82-95. (in Chinese with English abstract doi: 10.1016/S1872-5791(08)60064-0 [40] SONE H, UCHIDE T, 2016. Spatiotemporal evolution of a fault shear stress patch due to viscoelastic interseismic fault zone rheology[J]. Tectonophysics, 684: 63-75. doi: 10.1016/j.tecto.2016.04.017 [41] TAKEUCHI M, SATO T, SHINBO T, 2008. Stress due to the interseismic back slip and its relation with the focal mechanisms of earthquakes occurring in the Kuril and northeastern Japan arcs[J]. Earth, Planets and Space, 60(6): 549-557. doi: 10.1186/BF03353117 [42] THATCHER W, RUNDLE J B, 1984. A viscoelastic coupling model for the cyclic deformation due to periodically repeated Earthquakes at subduction zones[J]. Journal of Geophysical Research: Solid Earth, 89(B9): 7631-7640. doi: 10.1029/JB089iB09p07631 [43] VROLIJK P, 1990. On the mechanical role of smectite in subduction zones[J]. Geology, 18(8): 703. doi: 10.1130/0091-7613(1990)018<0703:OTMROS>2.3.CO;2 [44] WANG K L, HU Y, HE J H, 2012. Deformation cycles of subduction earthquakes in a viscoelastic Earth[J]. Nature, 484(7394): 327-332. doi: 10.1038/nature11032 [45] WANG, M, SHEN Z K, 2020. Present‐day crustal deformation of continental China derived from GPS and its tectonic implications[J]. Journal of Geophysical Research: Solid Earth, 125(2): e2019JB018774. doi: 10.1029/2019JB018774 [46] WANG R J, LORENZO-MARTÍN F, ROTH F, 2006. PSGRN/PSCMP—a new code for calculating co- and post-seismic deformation, geoid and gravity changes based on the viscoelastic-gravitational dislocation theory[J]. Computers & Geosciences, 32(4): 527-541. [47] WEN X Z, MA S L, XU X W, et al., 2008. Historical pattern and behavior of earthquake ruptures along the eastern boundary of the Sichuan-Yunnan faulted-block, southwestern China[J]. Physics of the Earth and Planetary Interiors, 168(1-2): 16-36. doi: 10.1016/j.pepi.2008.04.013 [48] YAGI Y, KIKUCHI M, 2003. Partitioning between seismogenic and aseismic slip as highlighted from slow slip events in Hyuga-nada, Japan[J]. Geophysical Research Letters, 30(2): 1087. [49] YAO S L, YANG H F, 2022. Hypocentral dependent shallow slip distribution and rupture extents along a strike-slip fault[J]. Earth and Planetary Science Letters, 578: 117296. doi: 10.1016/j.jpgl.2021.117296 [50] ZHAO J, JIANG Z S, WU Y Q, et al., 2012. Study on fault locking and fault slip deficit of the Longmenshan fault zone before the Wenchuan earthquake[J]. Chinese Journal of Geophysics, 55(9): 2963-2972. (in Chinese with English abstract [51] ZHU S B, ZHANG P Z, 2013. FEM simulation of interseismic and coseismic deformation associated with the 2008 Wenchuan Earthquake[J]. Tectonophysics, 584: 64-80. doi: 10.1016/j.tecto.2012.06.024 [52] ZHU Y J, WANG K L, HE J H, 2020. Effects of earthquake recurrence on localization of interseismic deformation around locked strike‐slip faults[J]. Journal of Geophysical Research: Solid Earth, 125(8): e2020JB019817. doi: 10.1029/2020JB019817 [53] 白永健,倪化勇,葛华,2019. 青藏高原东南缘活动断裂地质灾害效应研究现状[J]. 地质力学学报,25(6):1116-1128. doi: 10.12090/j.issn.1006-6616.2019.25.06.095 [54] 丰成君,戚帮申,张鹏,等,2018. 汶川Ms8.0地震后龙门山断裂带地壳应力场及其构造意义[J]. 地质力学学报,24(4):439-451. doi: 10.12090/j.issn.1006-6616.2018.24.04.046 [55] 石耀霖,曹建玲,2008. 中国大陆岩石圈等效粘滞系数的计算和讨论[J]. 地学前缘,15(3):82-95. doi: 10.3321/j.issn:1005-2321.2008.03.006 [56] 赵静,江在森,武艳强,等,2012. 汶川地震前龙门山断裂带闭锁程度和滑动亏损分布研究[J]. 地球物理学报,55(9):2963-2972. doi: 10.6038/j.issn.0001-5733.2012.09.015 -

 下载:
下载:


计量
- 文章访问数: 1039
- HTML全文浏览量: 254
- PDF下载量: 112
- 被引次数: 0
