

Tectonic deformation and seismic mechanism of the 2021 Aksai MS 5.5 earthquake
-
摘要: 2021年8月26日甘肃阿克塞党河南山地区发生了MS 5.5地震,震中位于阿尔金走滑断裂与祁连山西段挤压逆冲断裂的构造转换区。明确此次地震的形变特征及发震机制,有助于认识边界走滑断裂与逆冲断裂系之间应变分配和构造转换的大陆动力学问题,同时对祁连山西段的地震危险性评价也具有重要意义。利用远近场地震波形联合反演(the generalized Cut-and-Paste joint, gCAPjoint)此次地震的震源机制解。通过对地震序列走时信息以及地震前后的合成孔径雷达(Synthetic Aperture Radar, SAR)影像数据进行处理,得到了此次地震序列的精确空间位置和同震形变场。结合震中附近活动构造和构造地貌实地调查,认为此次地震的发震构造为党河南山南缘断裂,断裂活动性质为逆冲型。该断裂走向为315°、倾角为41°、滑动角为81°,震源矩心深度为6.9 km。随着青藏高原向北东向的挤压扩展,柴达木地块北部地震活动显著增强,未来阿尔金断裂东段和祁连山西段的地震危险性应重点关注。
-
关键词:
- 甘肃阿克塞MS 5.5地震 /
- 震源机制解 /
- 发震构造 /
- 党河南山南缘断裂
Abstract:Objective On August 26, 2021, an Ms5.5 earthquake occurred in Aksai, Gansu Province. The epicenter is located along the southern piedmont of the Danghe Nan Shan. This event garnered significant attention because of its deformation characteristics and seismogenic mechanisms. Existing studies have mainly focused on emergency response and seismic activity analyses; however, there is a lack of research on tectonic deformation and seismic mechanisms. This study aimed to fill this gap by analyzing the deformation characteristics of the earthquake zone and revealing its seismogenic mechanism. Methods This study employed seismological methods combined with interferometric synthetic aperture radar (InSAR) technology to investigate the tectonic deformation and seismic mechanism of the 2021 Aksai Ms5.5 earthquake. Combining focal mechanism solutions, precise earthquake locations, and InSAR results, the seismogenic fault and its geometric and kinematic parameters were determined and validated through geological field surveys. Results This study applied joint inversion with both local and teleseismic waveforms (the generalized cut-and-paste joint, gCAPjoint) to source parameters. The fault solutions strike 315°, dip 41°, rake 81°, depth 6.9 km. We relocated the Aksai earthquake and its aftershocks using the hypoinverse and double-difference method (HypoDD), and accurate locations of 88 earthquakes were obtained. The 2021 Ms5.5 earthquake sequence in Aksai is distributed near the southern Danghe Nan Shan Fault, with a fault dip toward the NE. The co-seismic deformation field indicated by InSAR matched the macro-epicenter with the precise location results, confirming the reliability of the precise location. Both the ascending and descending orbit surface deformation fields showed uplift near the epicenter with similar magnitudes and signs in the line-of-sight direction, indicating that the earthquake rupture was mainly thrusting. Fault scarps near the epicenter along the southern piedmont of the Danghe Nan Shan were recognized in the field and satellite images. Combined data from focal mechanism solutions, precise earthquake locations, and InSAR coseismic deformation fields, along with field geological survey results, indicate that the seismogenic fault of this event was the southern Danghe Nan Shan Fault, with a strike of 315°, dip of 41°, and rake of 81°. Conclusion This study indicated that the seismogenic fault of this event was the southern Danghe Nan Shan Fault, which is a thrust fault. The fault solutions strike 315°, dip 41°, rake 81°, depth 6.9 km. Because of the northward extrusion thrust of the Qinghai-Xizang Block, the seismic activity in the northern part of the Qaidam Block has significantly increased. The future seismic risk of the eastern section of the Altyn Tagh Fault and western Qilian Shan should be emphasized. [ Significance ] This study provides new insights and methods for researching active tectonics. It holds significant scientific importance and innovation in understanding seismogenic mechanisms and structural transformation, as it helps to understand the mode and magnitude of slip transfer between the strike-slipping of the Altyn Tagh Fault and the shortening of the Qilian Shan and also contributes to a better evaluation of the seismic risk in this region. -

图 1 震中台站分布图和文中使用的地壳速度模型
F1—党河南山南缘断裂;F2—党河南山北缘断裂;F3—阿尔金南缘断裂;F4—阿尔金断裂;F5—野马河−大雪山断裂;F6—疏勒南山断裂;F7—中祁连北缘断裂;F8—昌马断裂;F9—肃南−祁连断裂;F10—红崖子−佛洞庙断裂;F11—柴达木北缘断裂a—近震波形台站分布;b—远震波形台站分布;c—研究区地壳速度模型(Vp 为P波速度,VS为S波速度)
Figure 1. Epicenter and station distribution, and crustal velocity model used in this study
(a) Distribution of local station and active faults; (b) Distribution of teleseismic station; (c) The crustal velocity model for this study (the dashed line represents the S-wave and the solid line represents the P-wave, Vp is the P-wave velocity, and VS is the S-wave velocity) F1— Southern Danghe Nan Shan Fault; F2— Northern Danghe Nan Shan Fault; F3 and F4 are the south and north strands of the Altyn Tagh Fault; F5—Yemahe–Daxue shan Fault; F6—Shule Nan Shan Fault; F7—North Central Qilian Fault; F8— Changma Fault; F9— Sunan–Qilian Fault; F10—Hongyazi–Fodongmiao Fault; F11—North Qaidam Fault
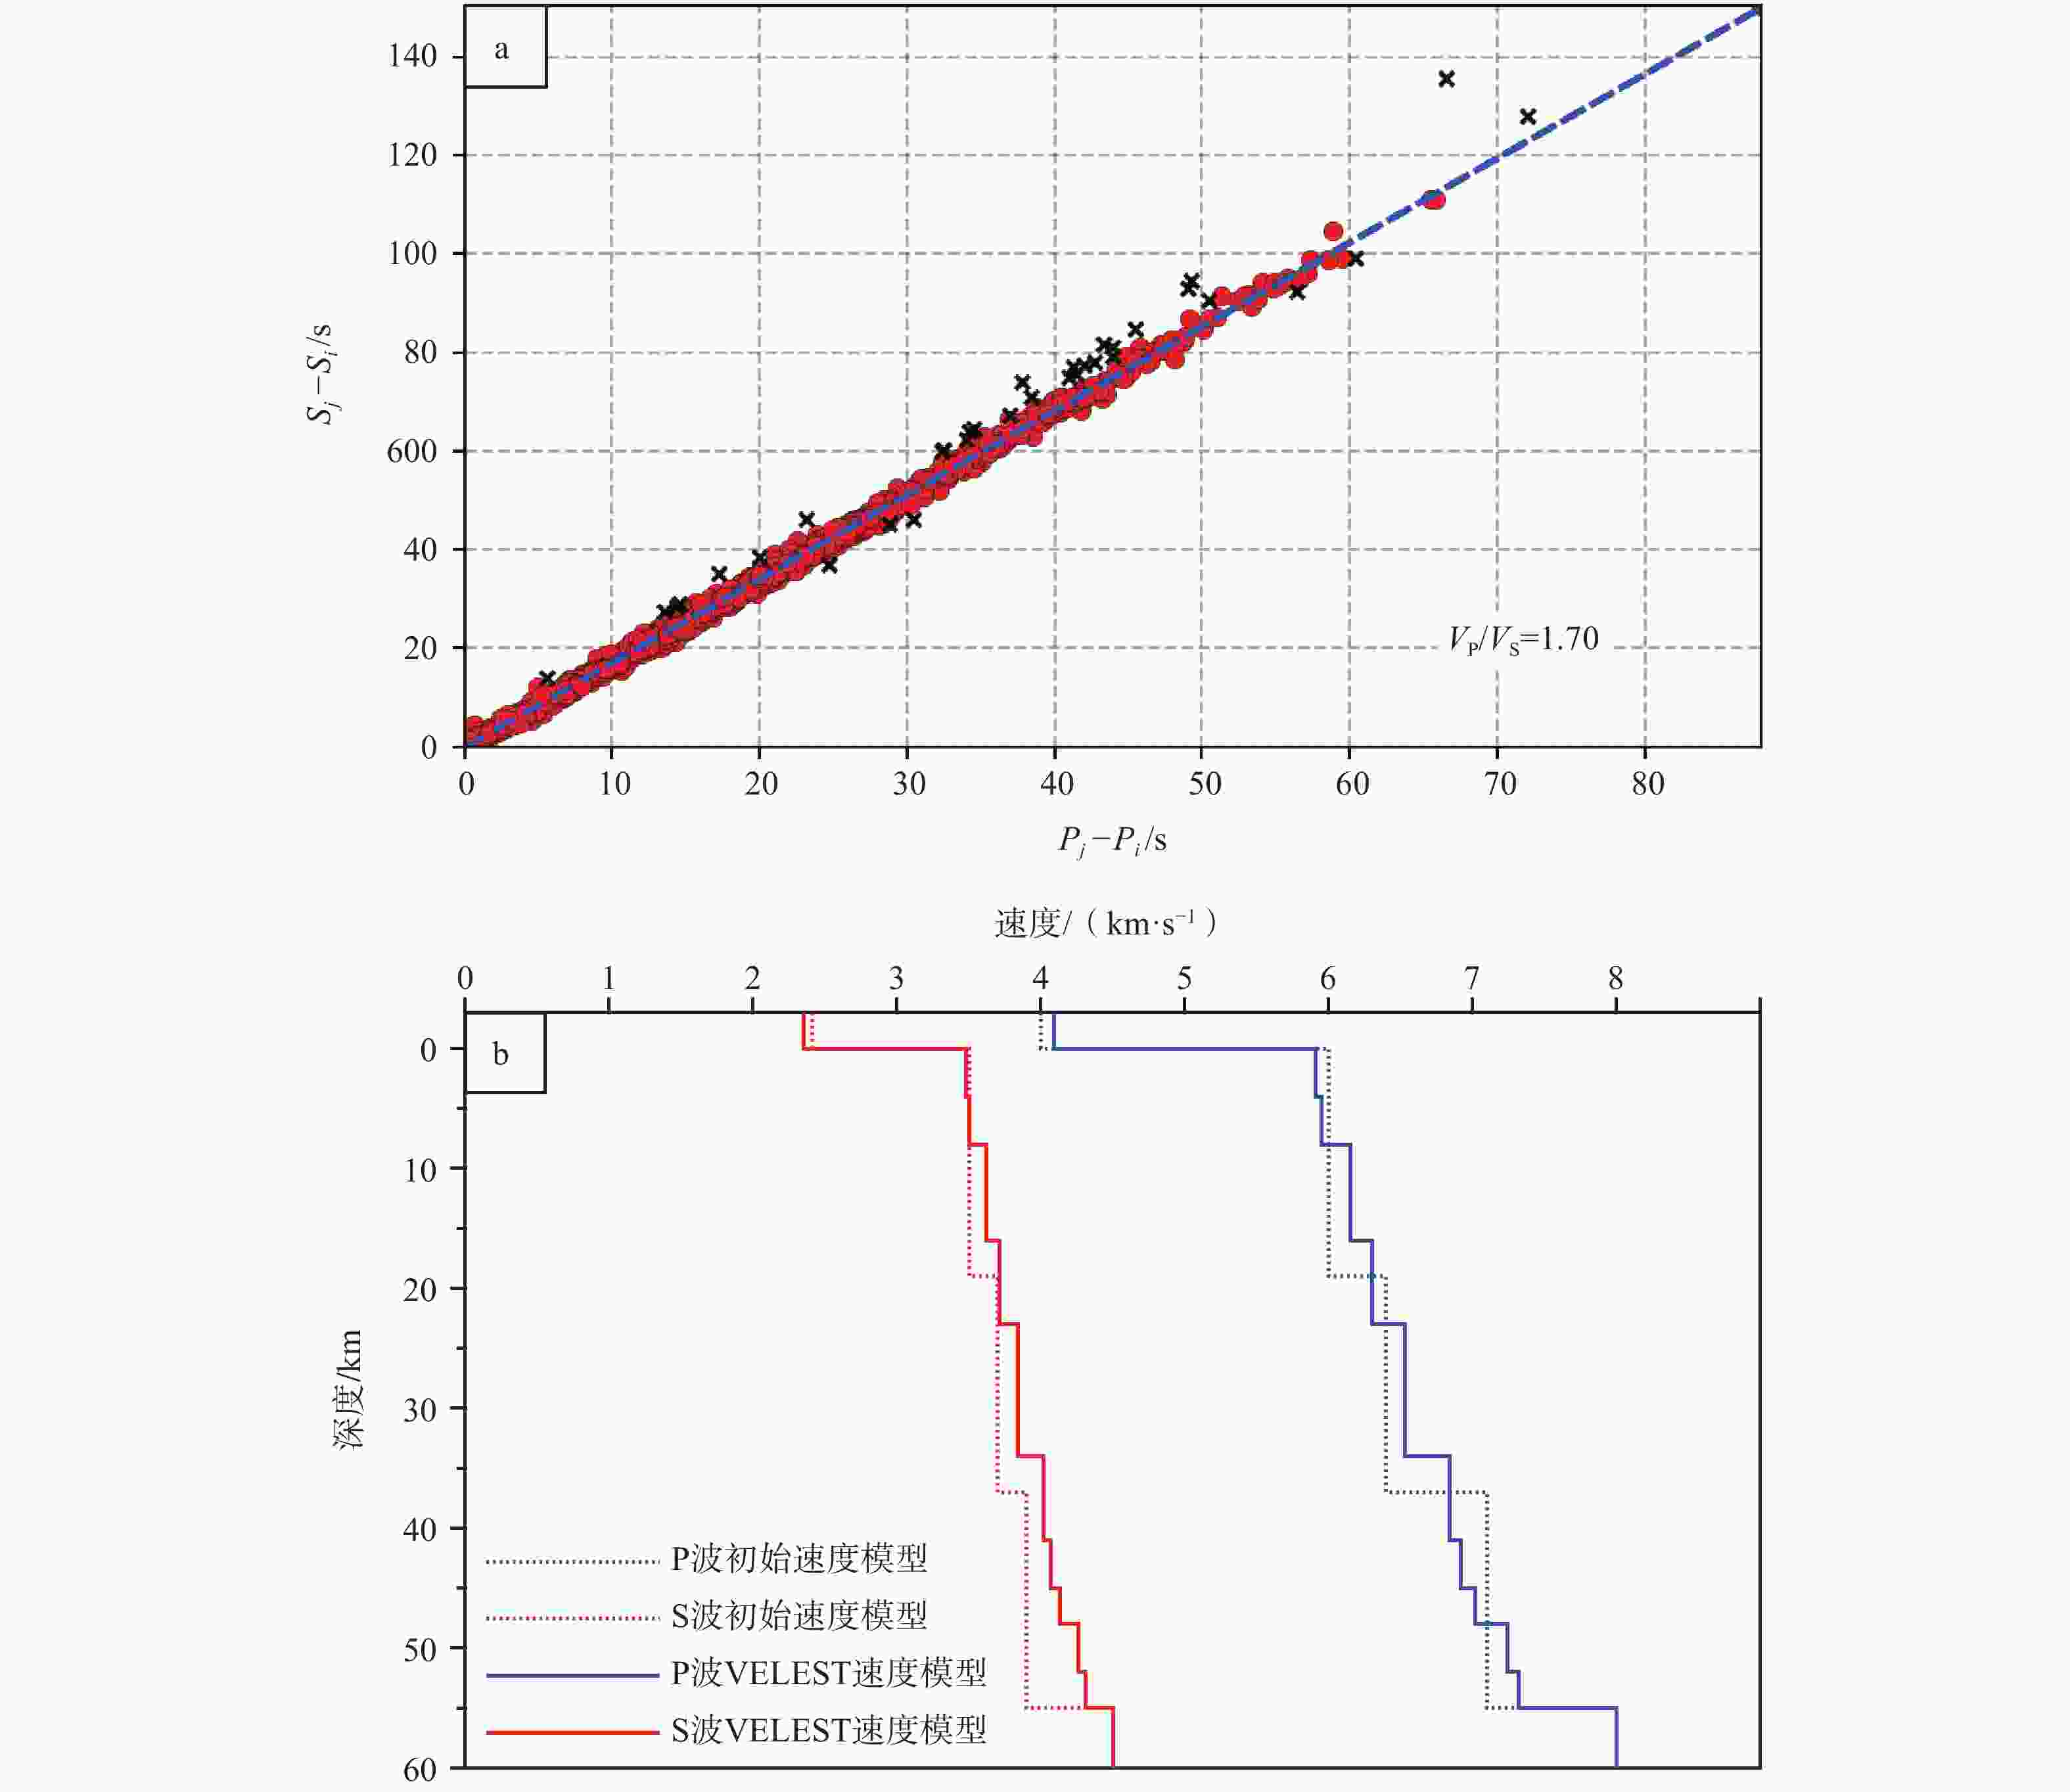
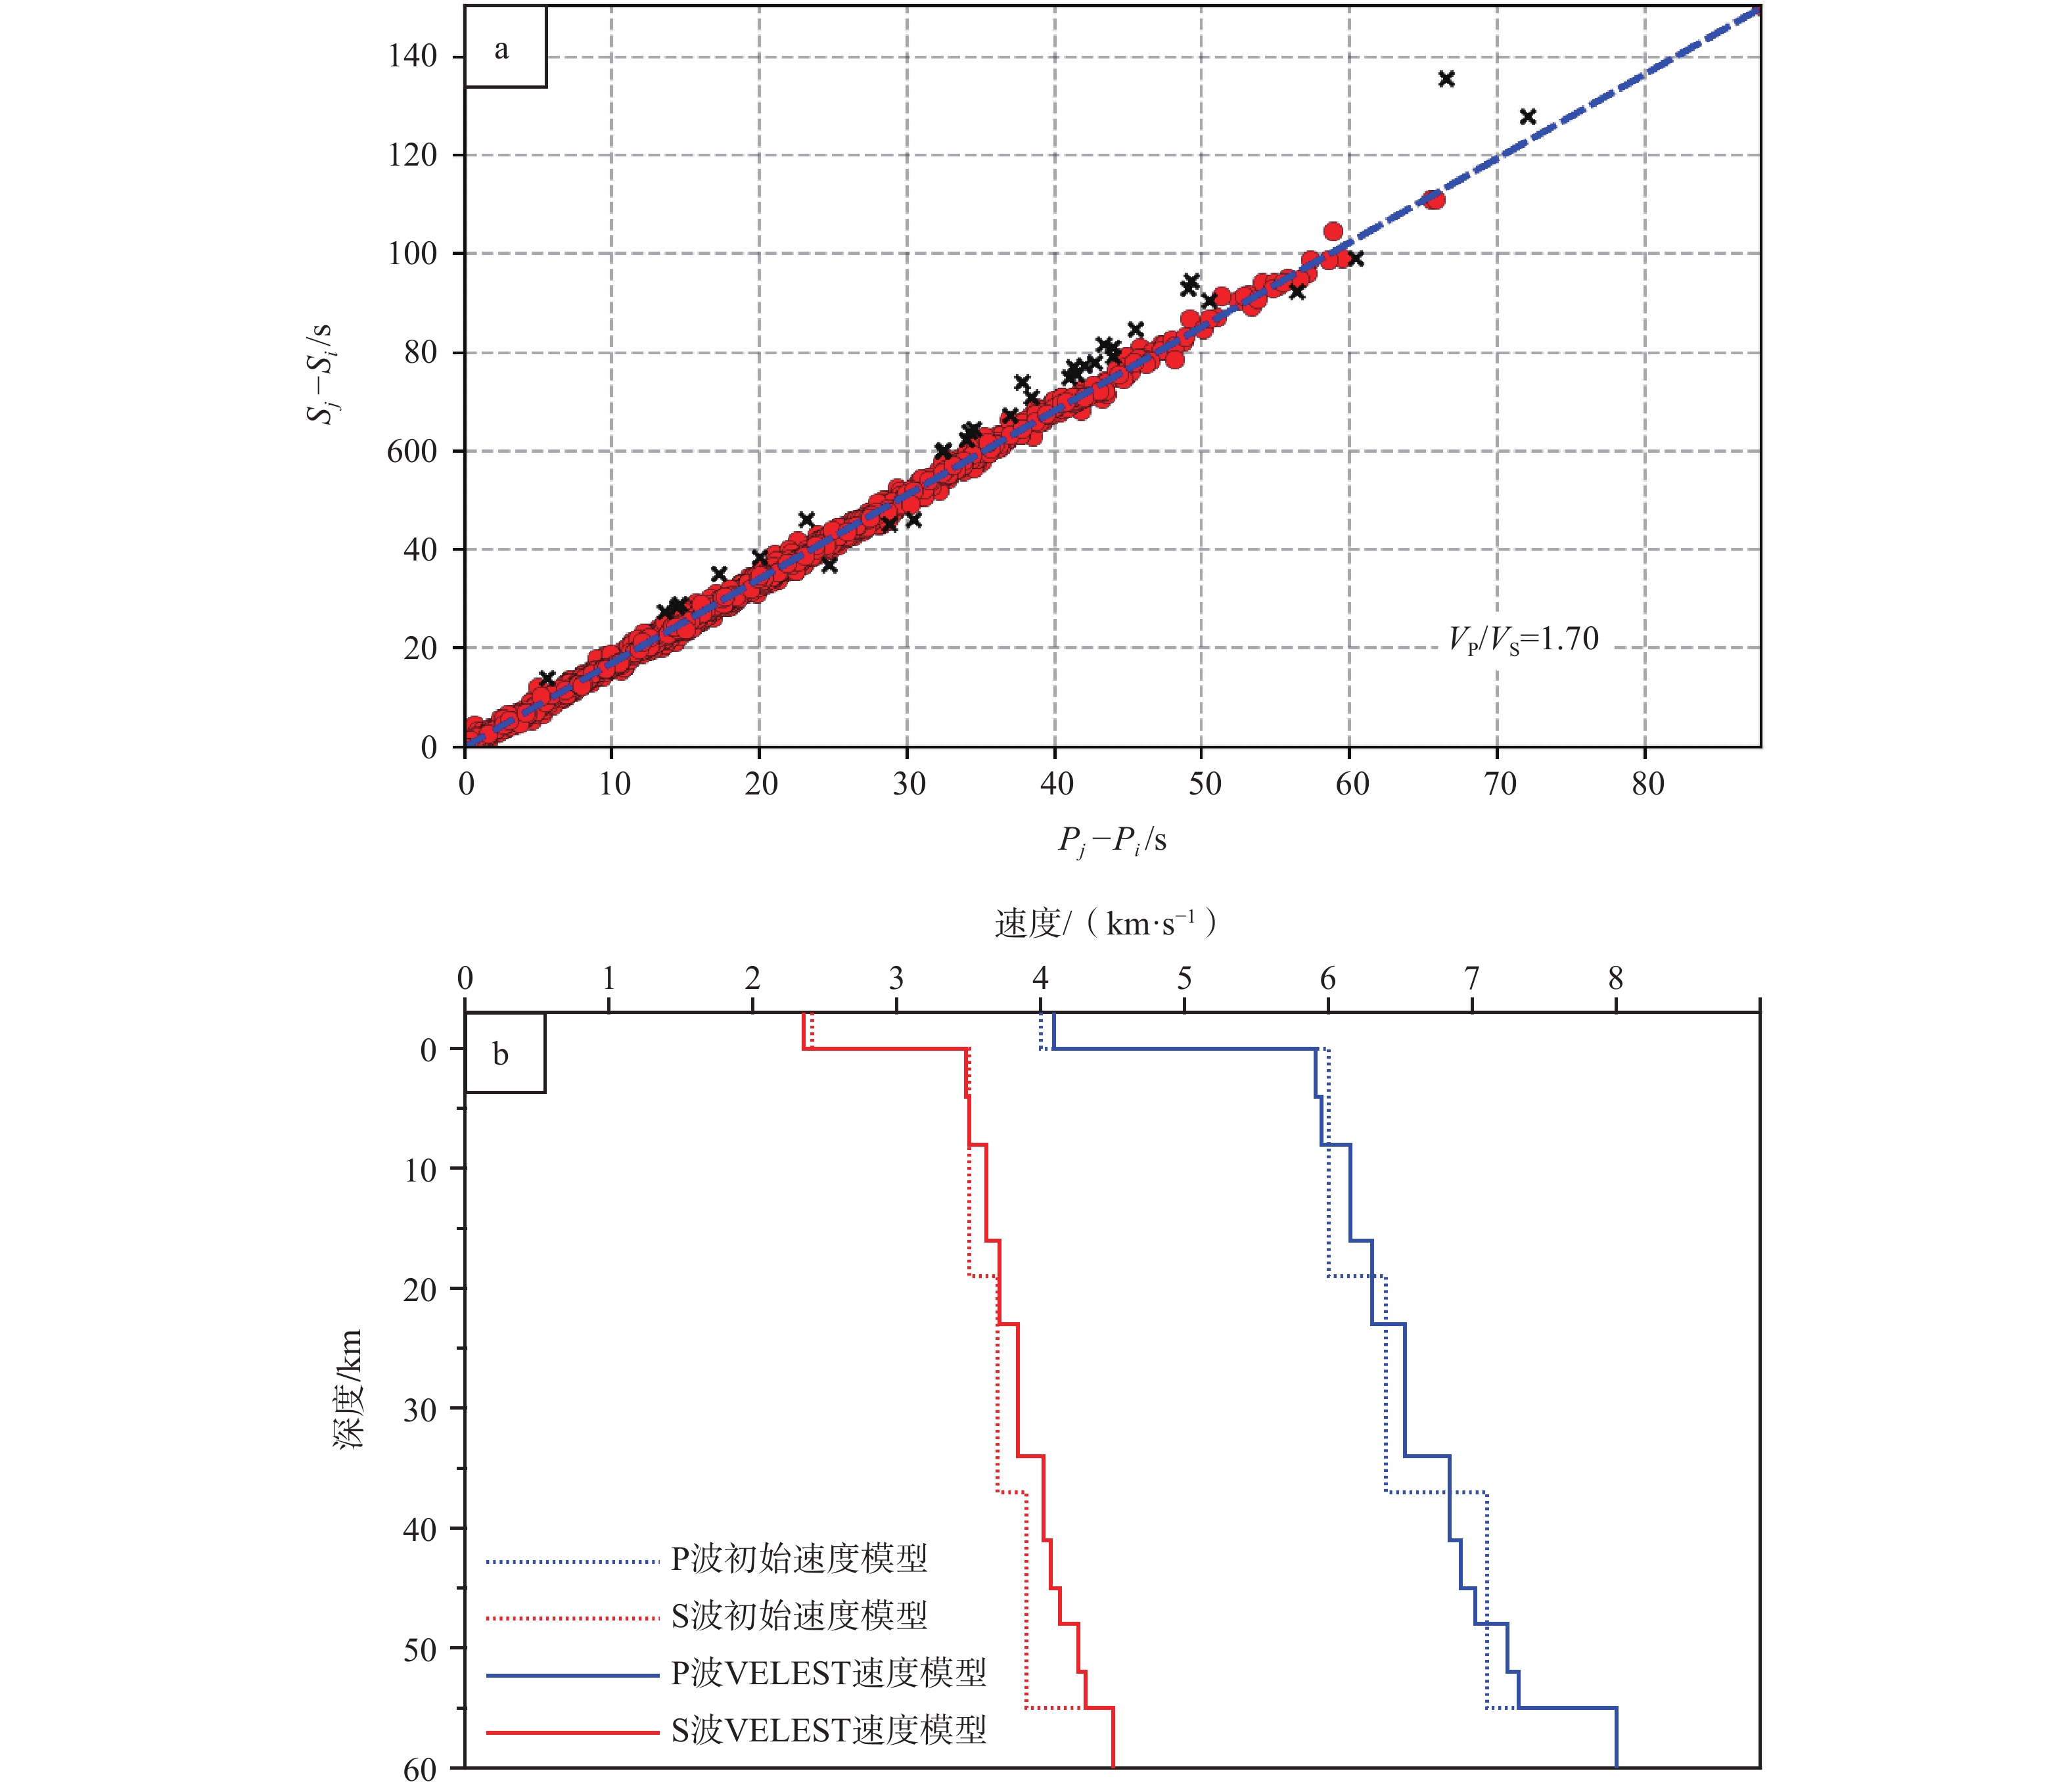
图 2 波速比和地壳速度模型
a—波速比(横坐标为P波走时(Pj)与最小P波走时(Pi)的差,纵坐标为对应S波走时(Sj)与最小S波走时(Si)的差;其中黑色×为波速比拟合数据中的离群点,不参与拟合;红色实心圆为参与波速比拟合的数据点;蓝色虚线为波速比拟合线);b—文中所使用的地壳速度模型
Figure 2. Wave velocity ratio and velocity model used in this study
(a) Wave velocity ratio (The horizontal axis represents the difference between P-wave travel time (Pj) and the minimum P-wave travel time (Pi), while the vertical axis represents the difference between corresponding S-wave travel time (Sj) and the minimum S-wave travel time (Si). The black "×" marks indicate outliers in the velocity ratio fitting data and are not included in the fitting process. The blue dashed line represents the fitted velocity ratio line.); (b) Velocity model (The dashed line is the initial velocity model and the solid line is the VELEST velocity model; the red line represents the S-wave, and the blue line represents the P-wave.)
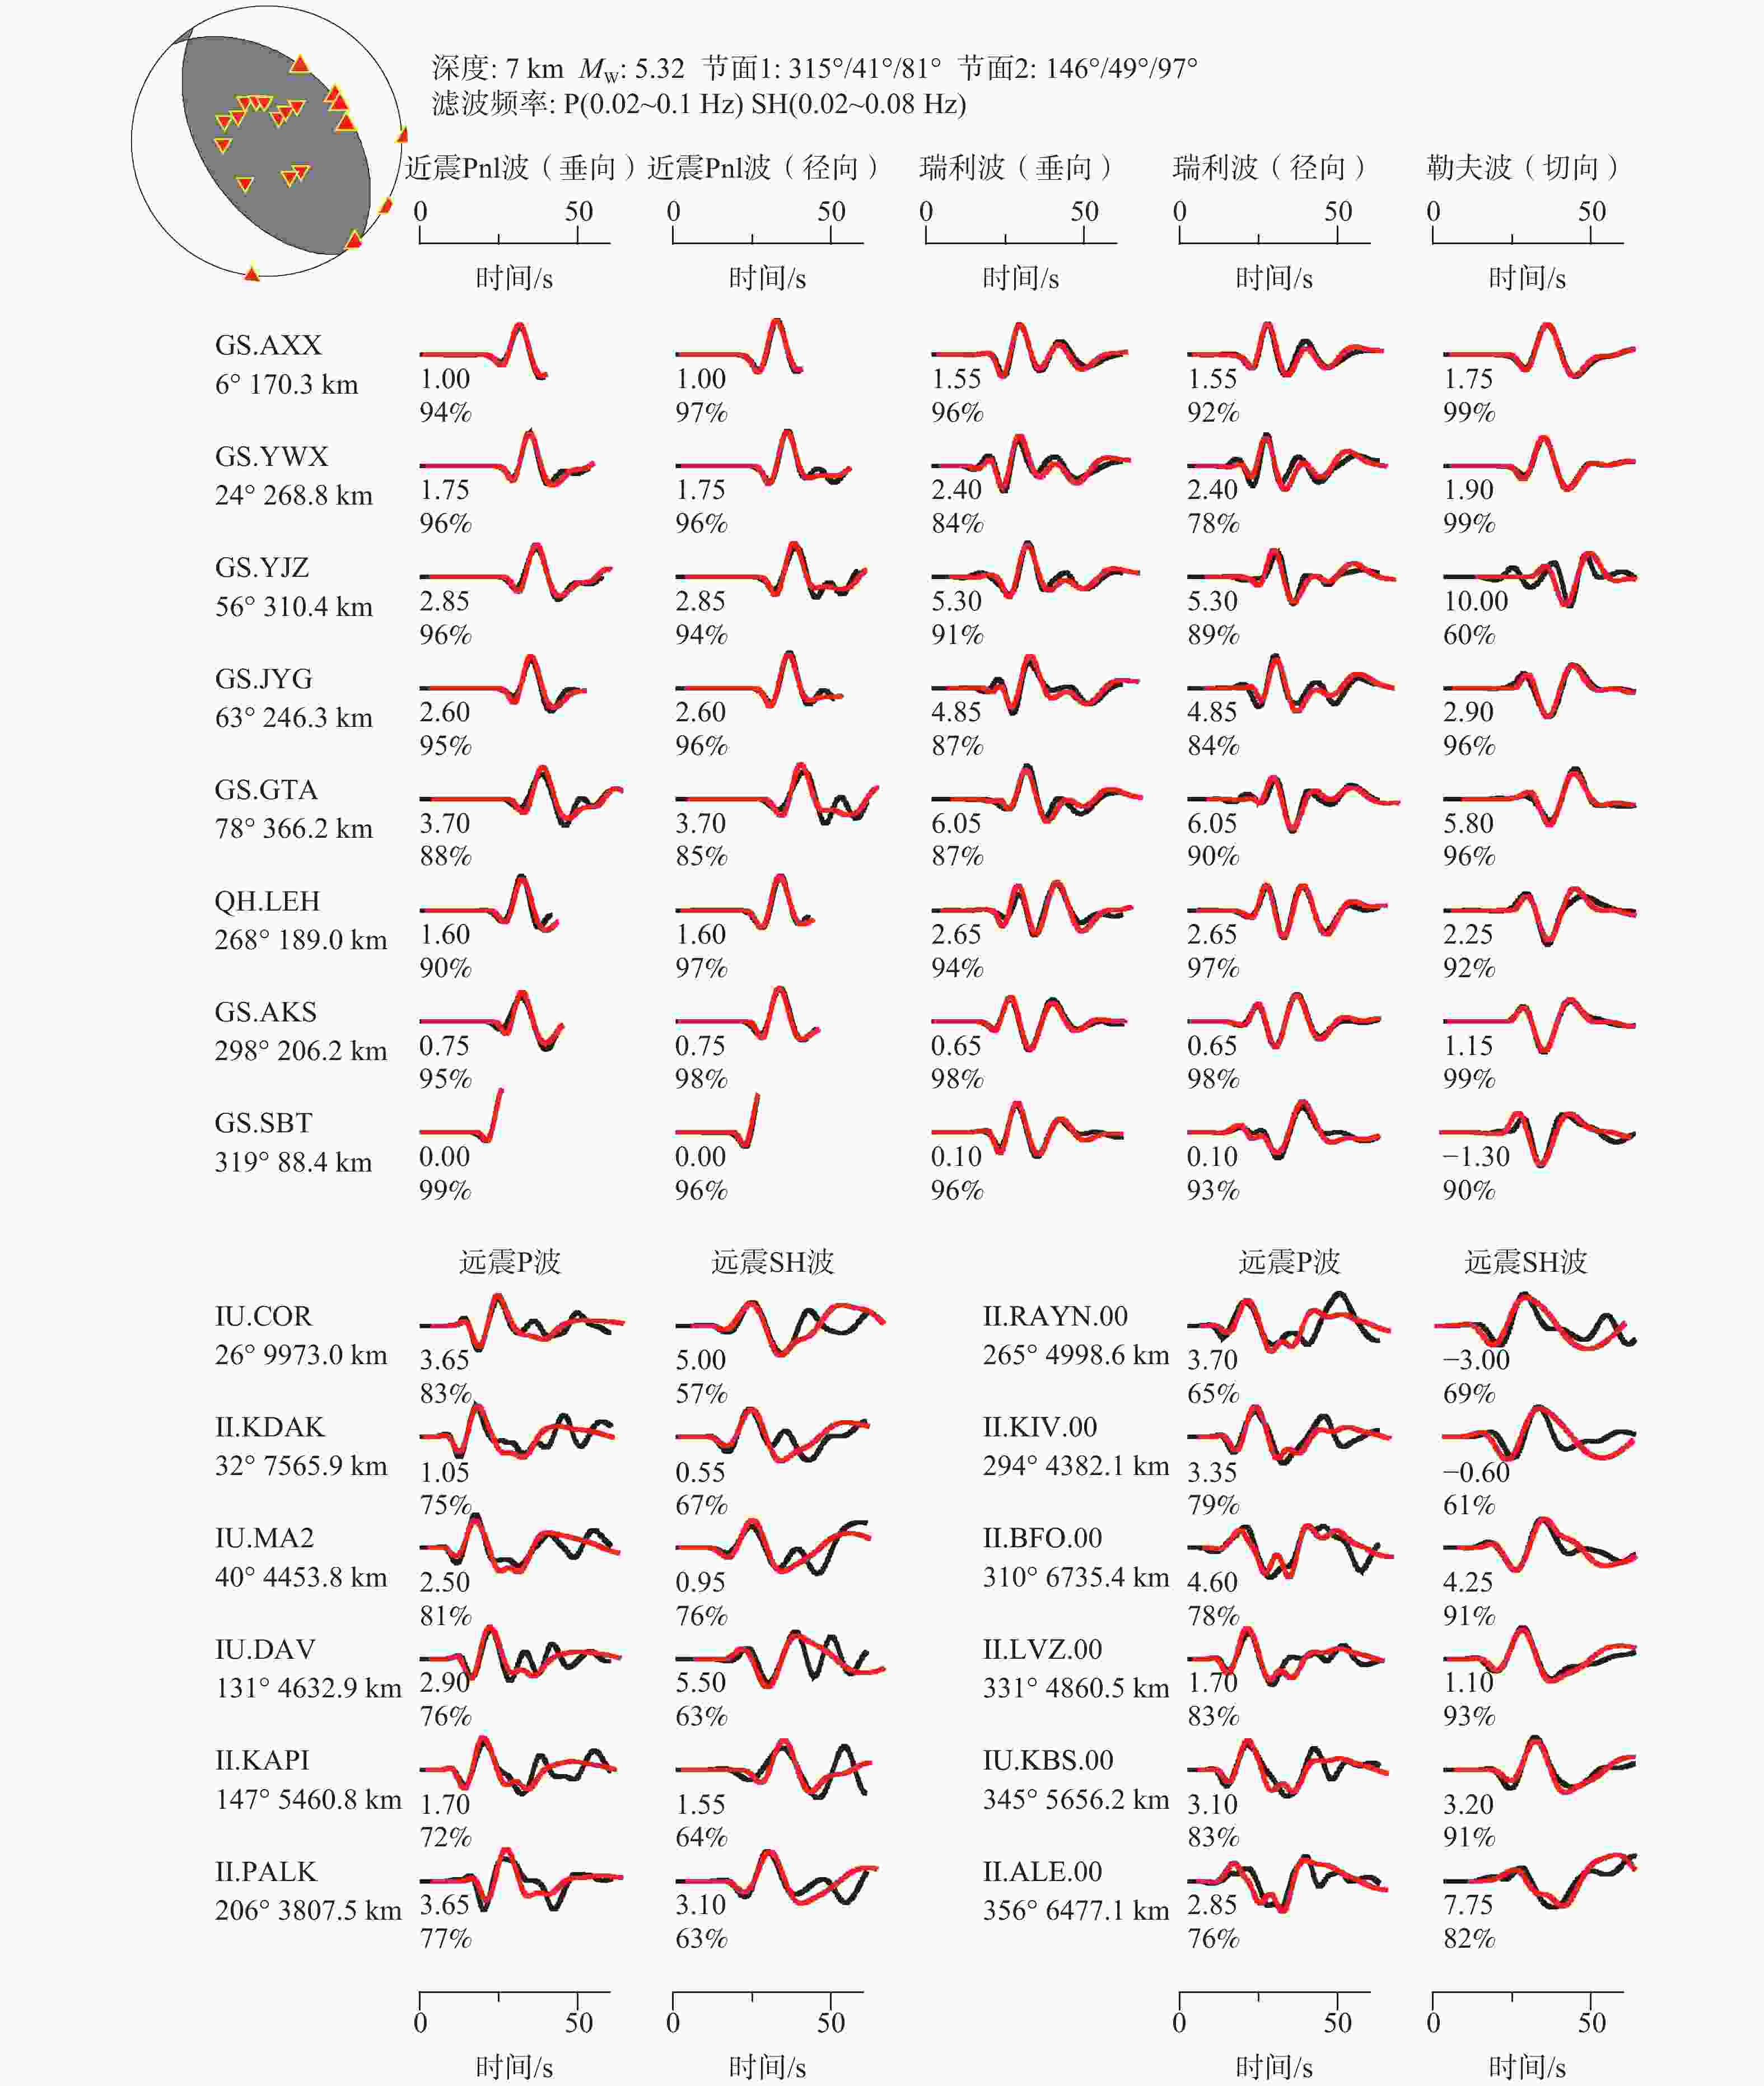
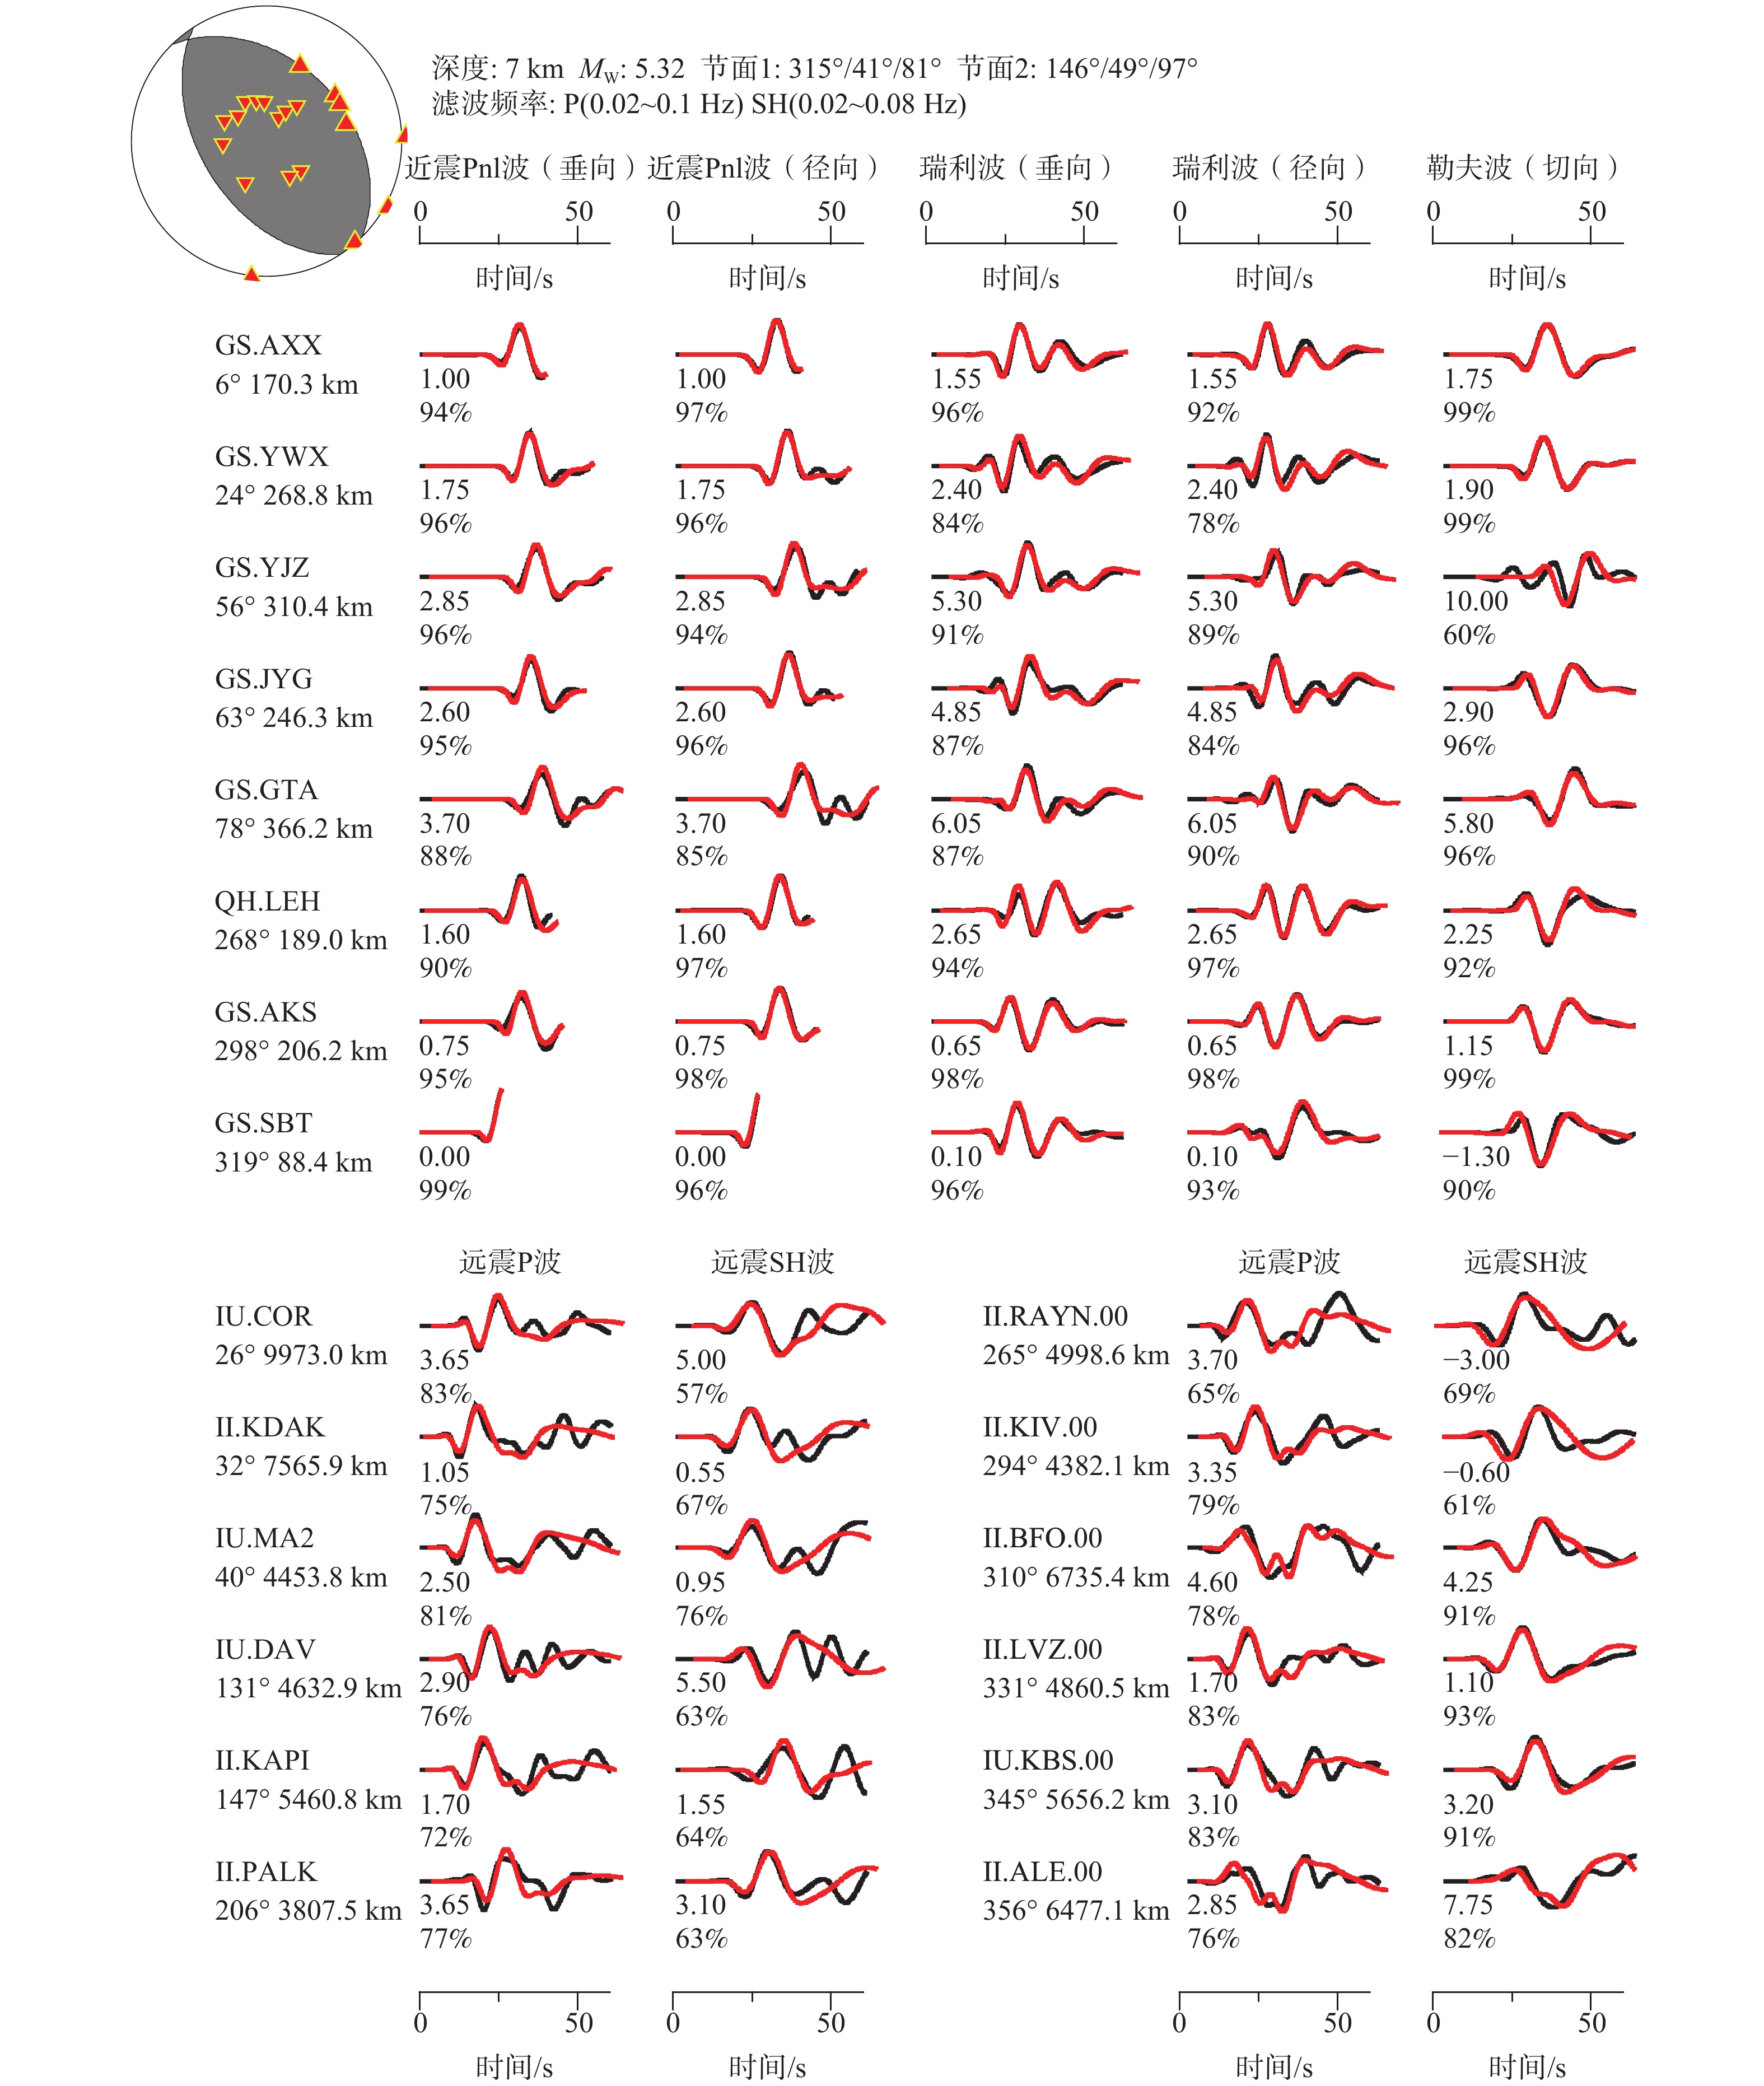
图 3 2021年阿克塞地震震源机制反演结果
注:红线和黑线分别代表合成波形和观测波形;波形下方数字代表波形相对时移和互相关系数;波形左侧为台站名称;台站名下方为方位角和震中距;震源球上三角形为P波的离源角投影,正三角为近震Pnl,倒三角为远震P波
Figure 3. The focal mechanism solution of 2021 Aksai mainshock
The red and black lines represent the synthesized and observed waveforms, respectively. The numbers below the waveforms are the time shifts (in seconds) and the maximum cross-correlation coefficients. The station codes are shown on the left, and the azimuth and epicentral distances are shown below the station codes. The triangles on the beach ball are the off-source angle projections of the P-wave, the positive triangles represent the local Pnl, and the inverted triangles represent the teleseismic P-wave.
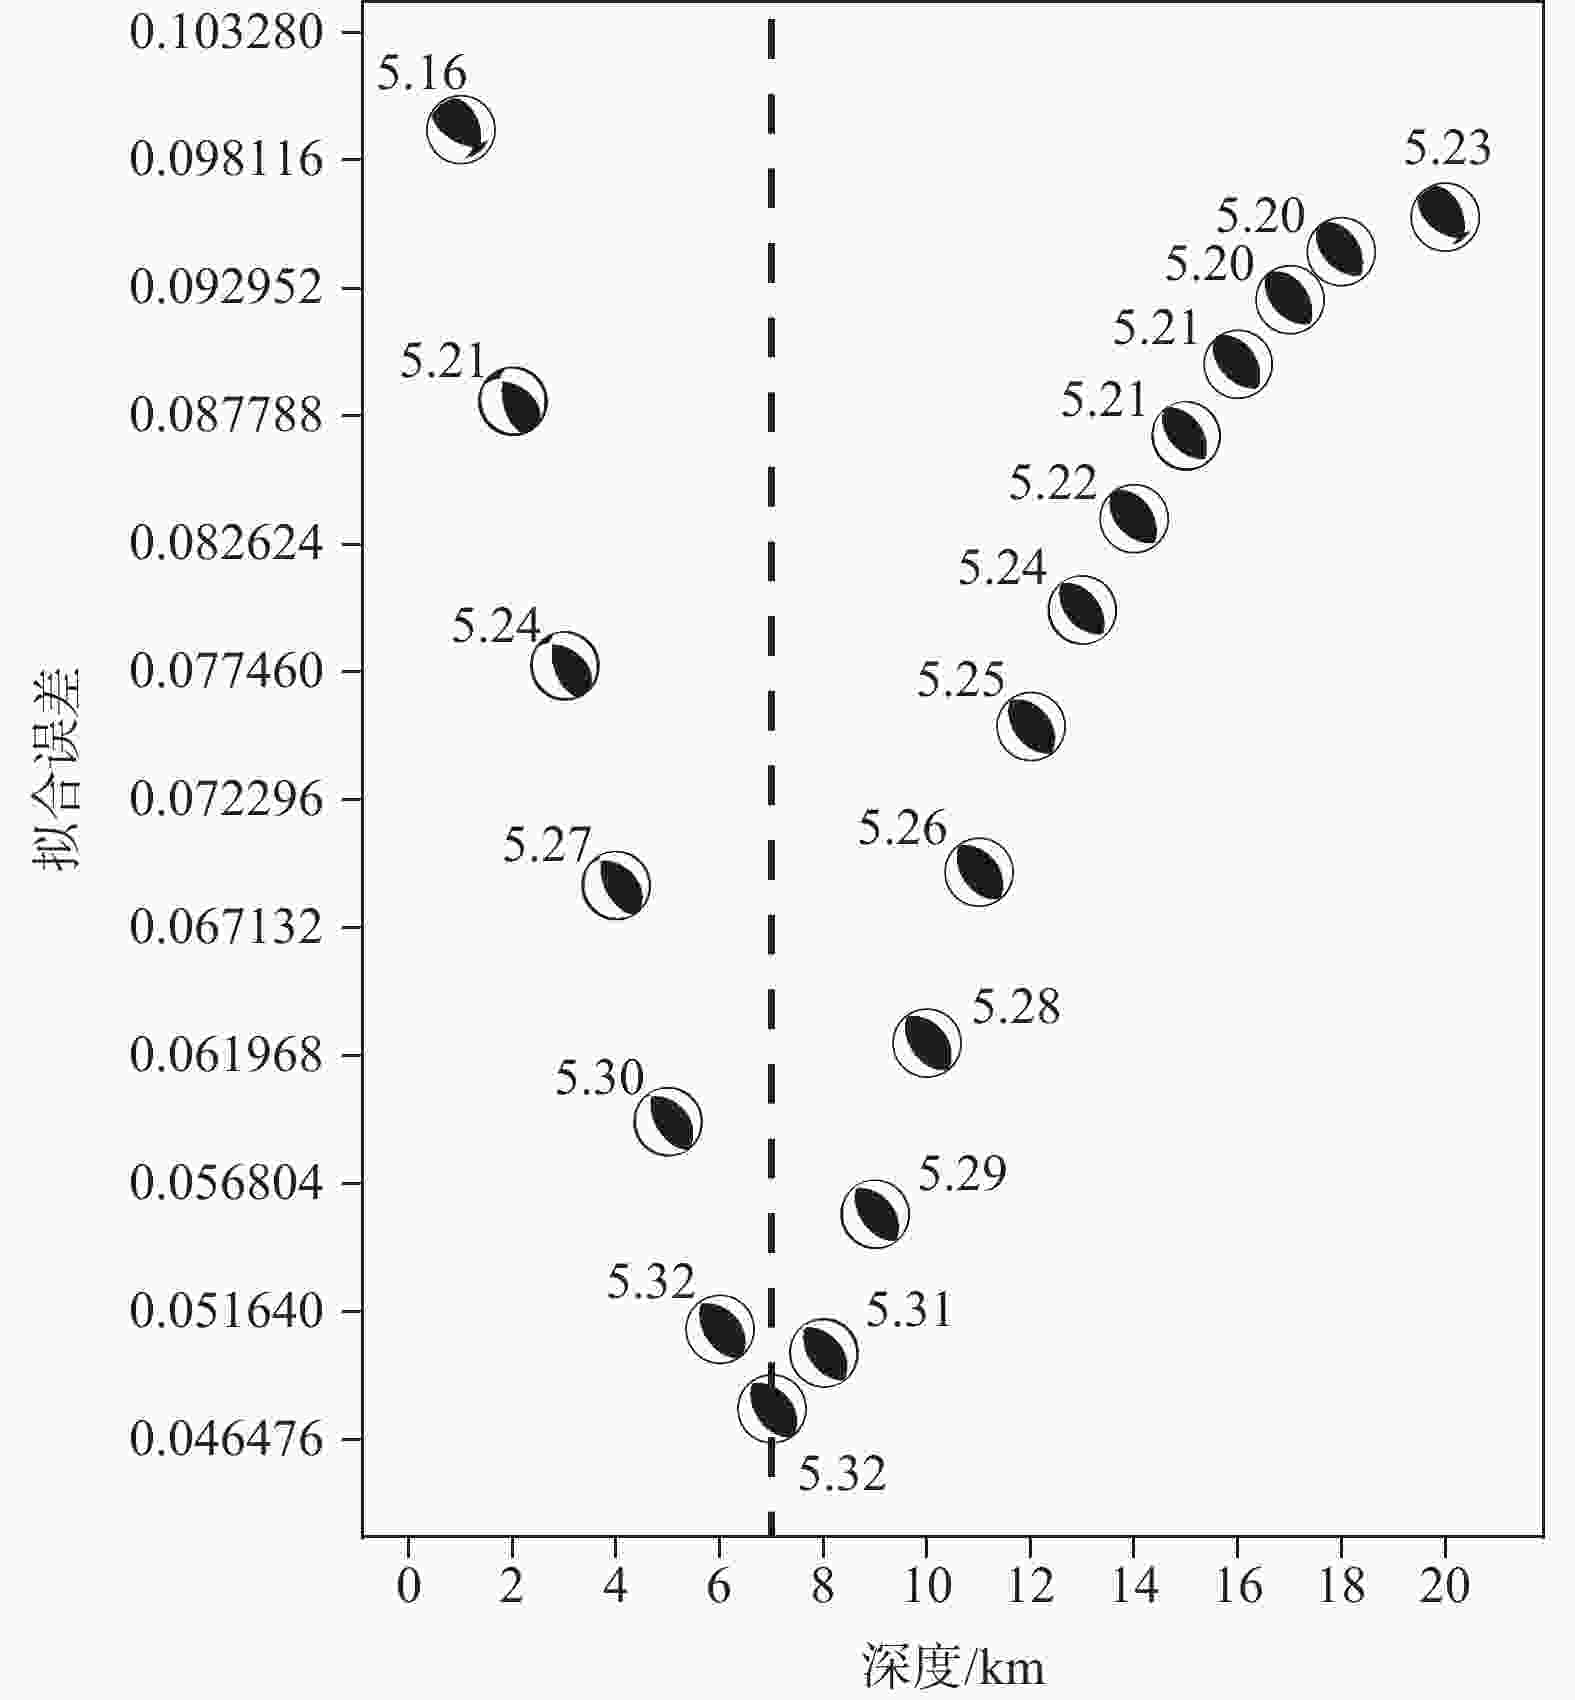
图 4 反演拟合误差随深度变化图
注:震源球上的数字代表反演所得的矩震级
Figure 4. The inversion residuals vary with depth
Number above the beach ball represents the corresponding moment magnitude.
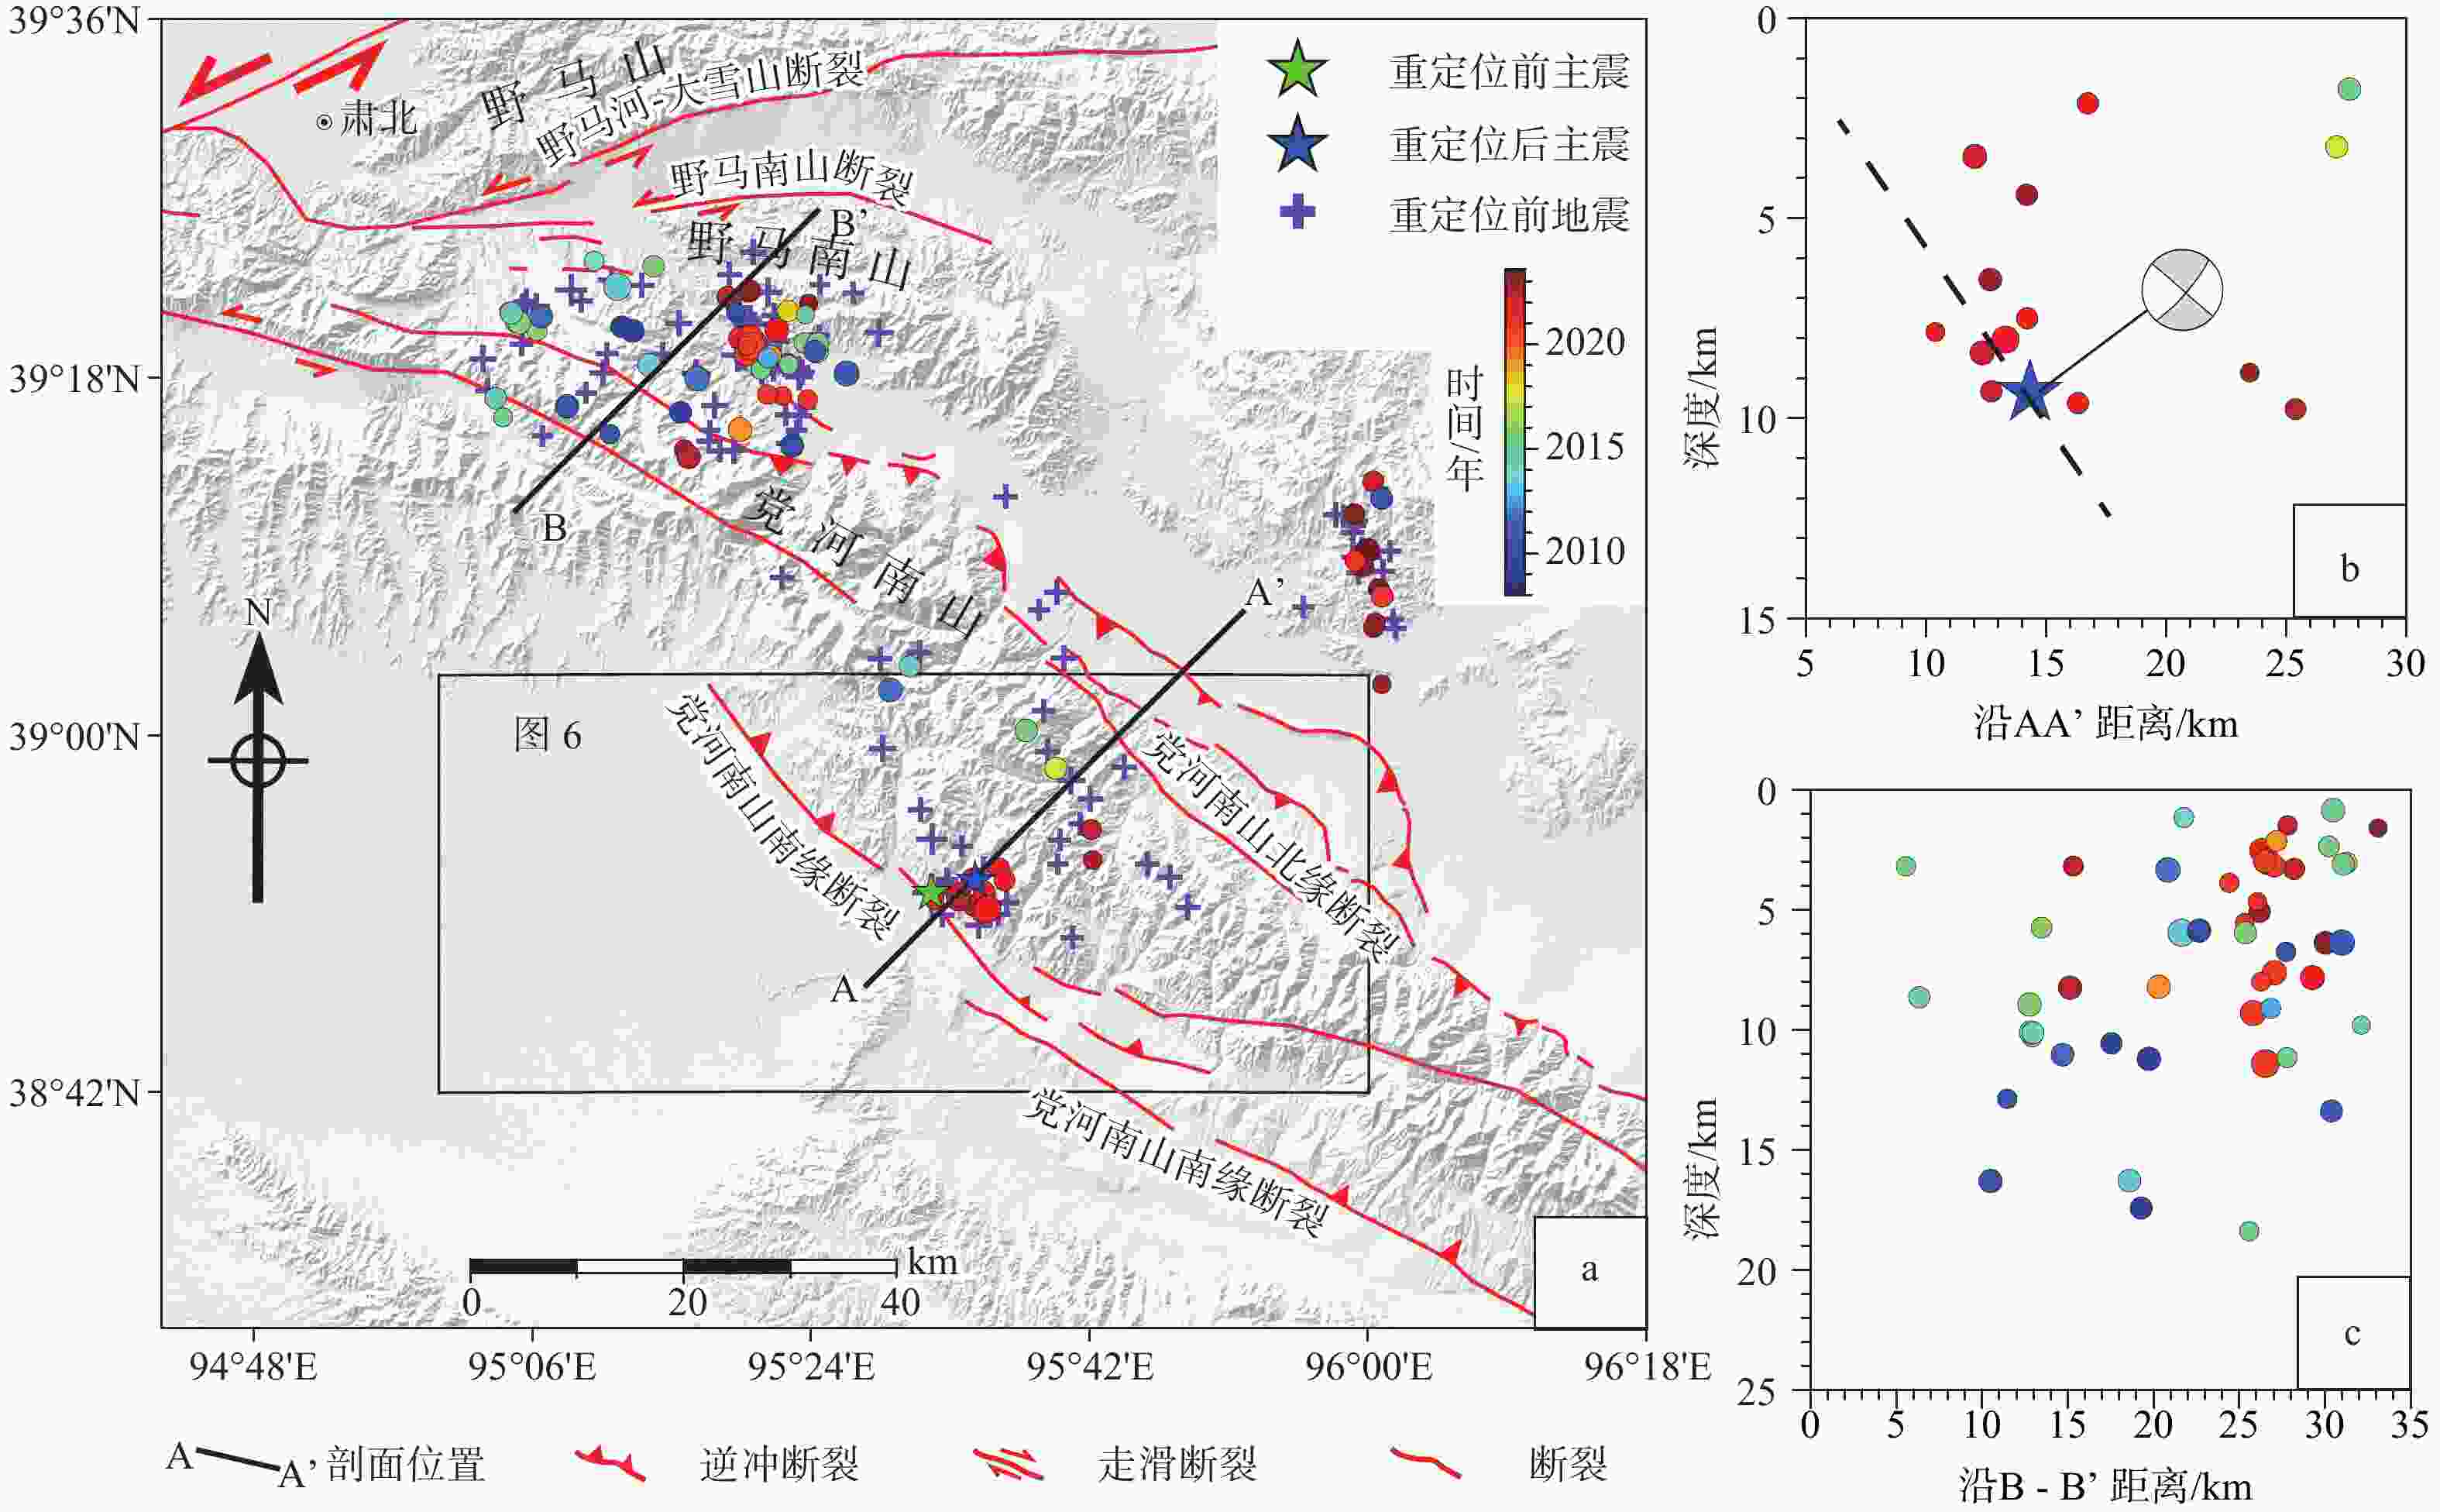
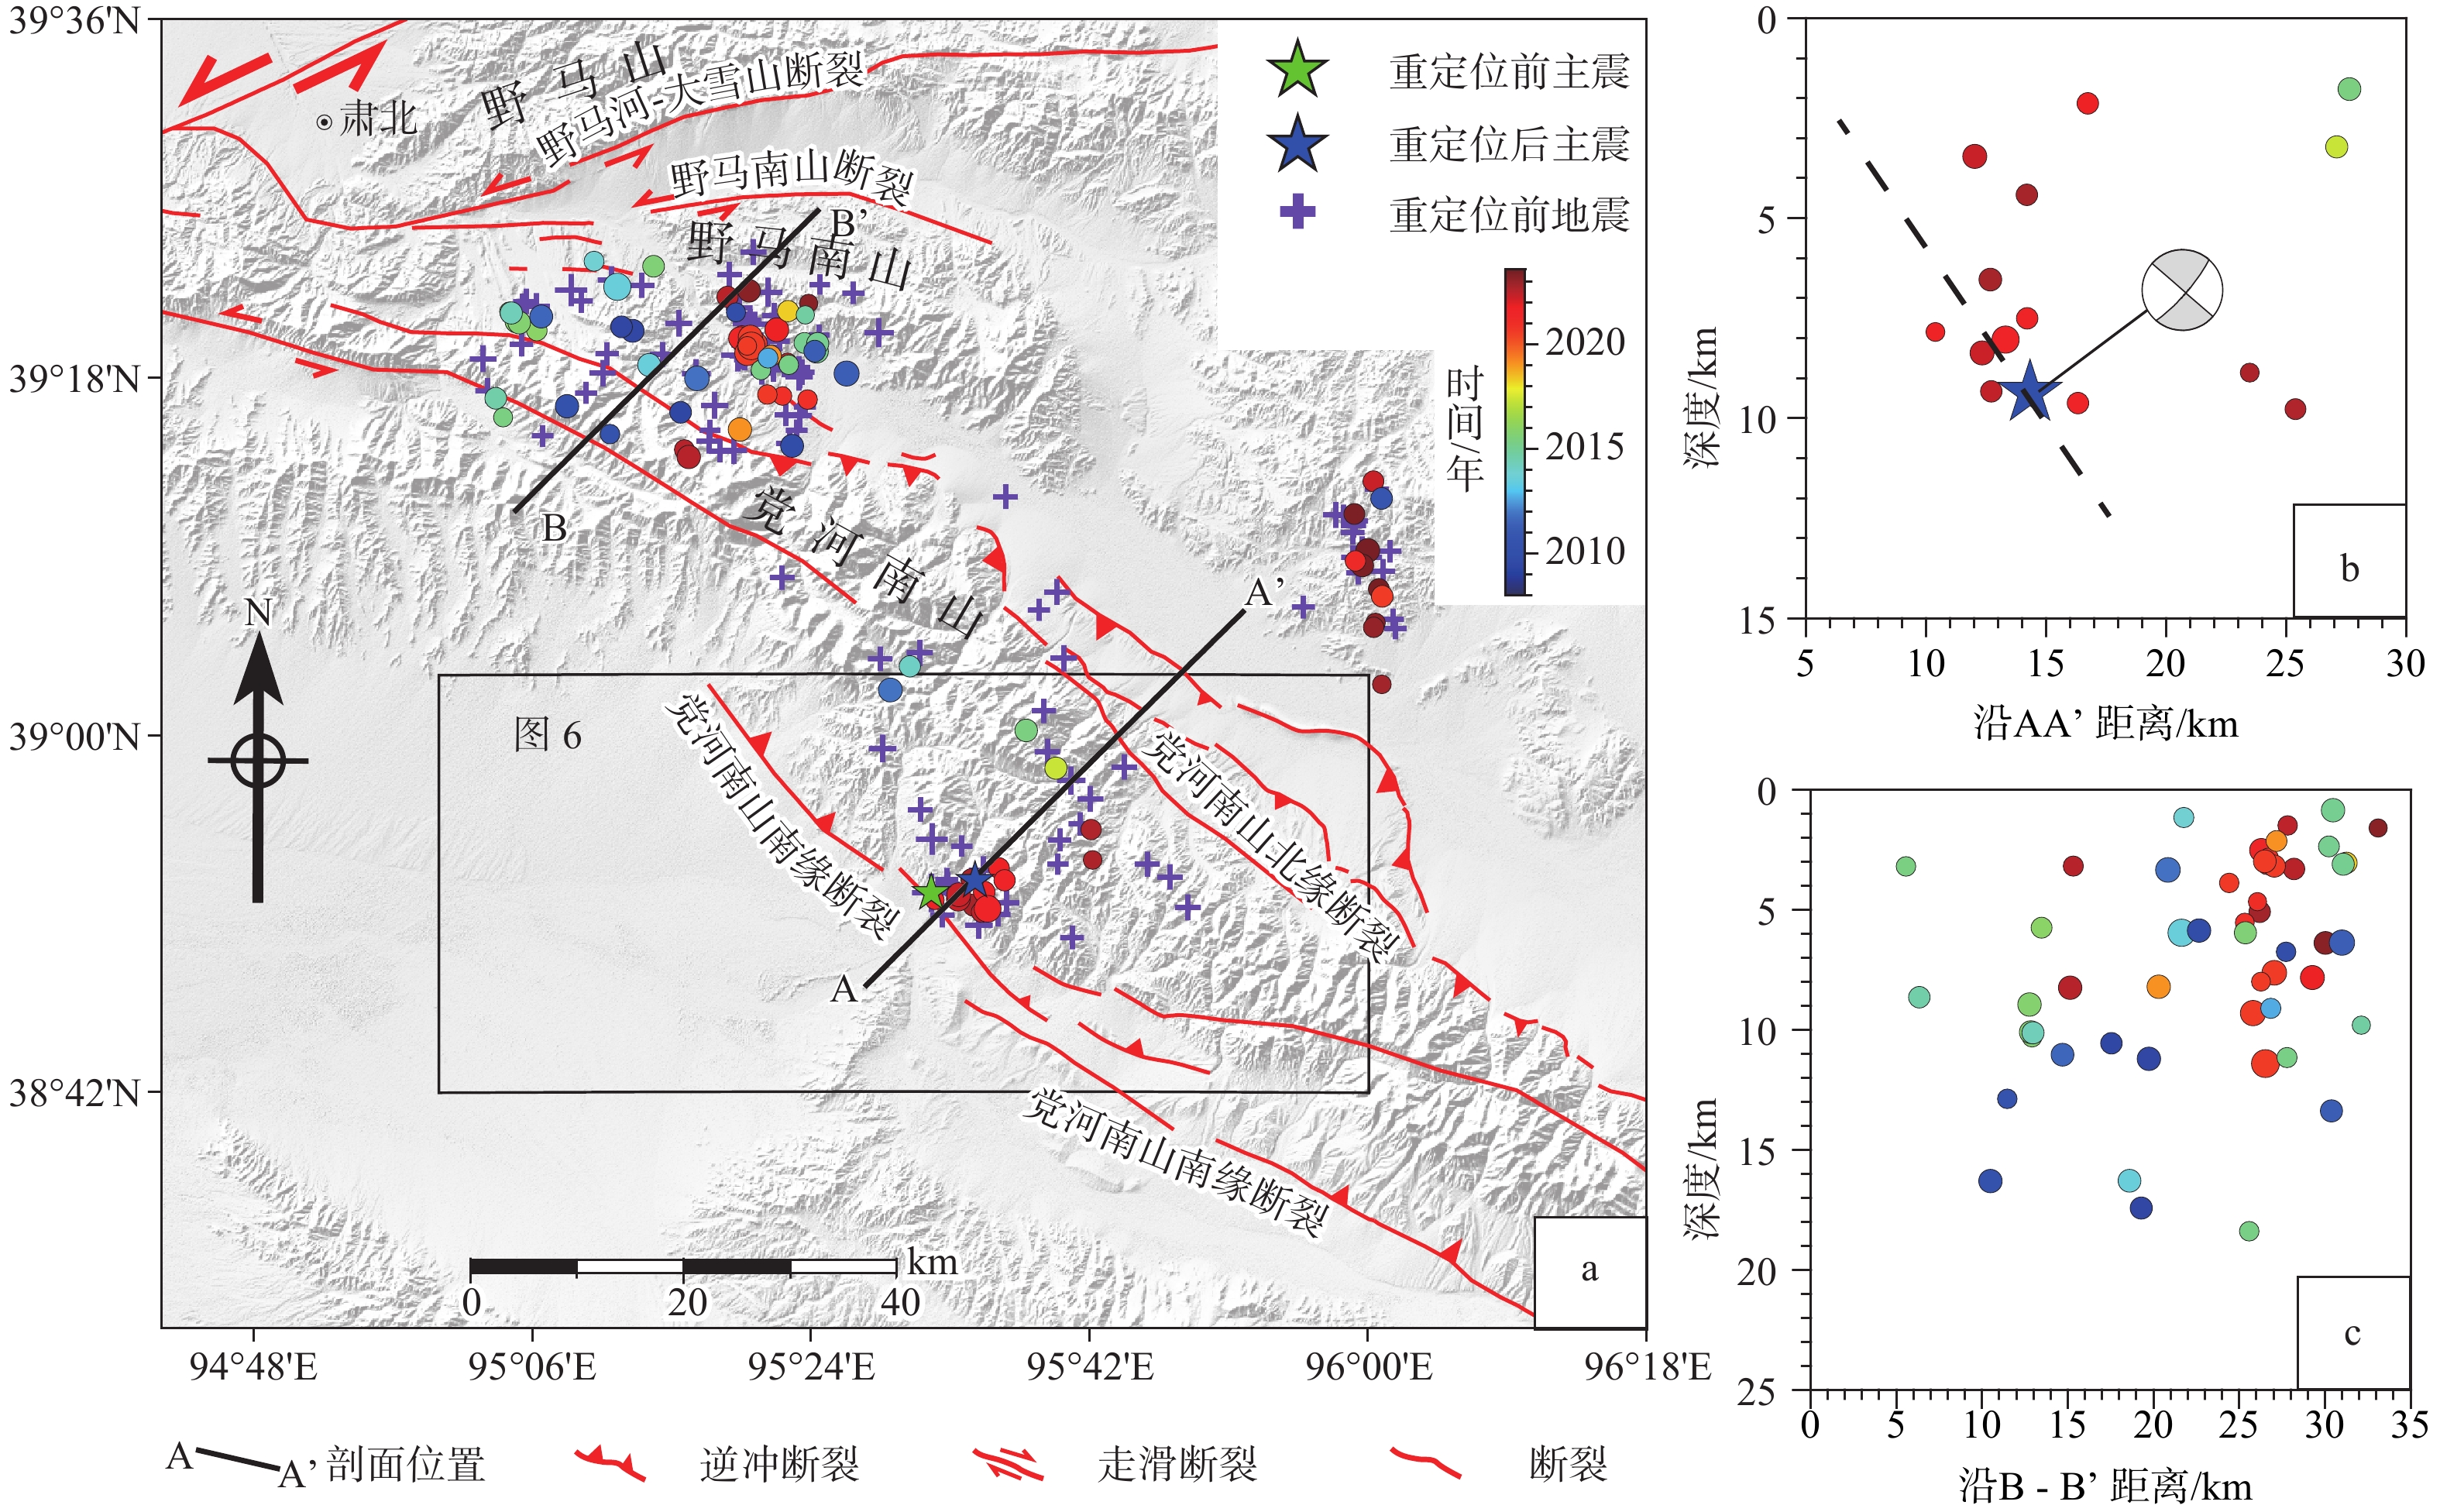
图 5 地震震中重新定位分布图及剖面两侧各7 km范围内的地震深度分布图
注:深度剖面上的彩色实心圆为剖面两侧7 km范围内地震在剖面上的垂直投影,沙滩球的投影剖面为AA’, 彩色实心圆的颜色表示发震时间, 黑色虚线为拟合断层面a—重新定位地震震中分布;b—AA’剖面上的地震深度分布;c—BB’剖面上的地震深度分布
Figure 5. Map view and depth distribution of the aftershocks along profiles. Earthquakes within 7 km of the line are included
(a) Epicenter distribution of the relocated events; (b) Depth distribution of the aftershocks along AA’ profiles; (c) Depth distribution of the aftershocks along BB’ profiles Note:Colored solid circles on each depth profile represent the vertical projections of earthquakes within a 7 km range on both sides. The beach balls represent the focal mechanisms, and the projection profile is AA’; The colors of the solid circles indicate the occurrence time of the earthquakes; The black dashed line represents the fitted fault plane.
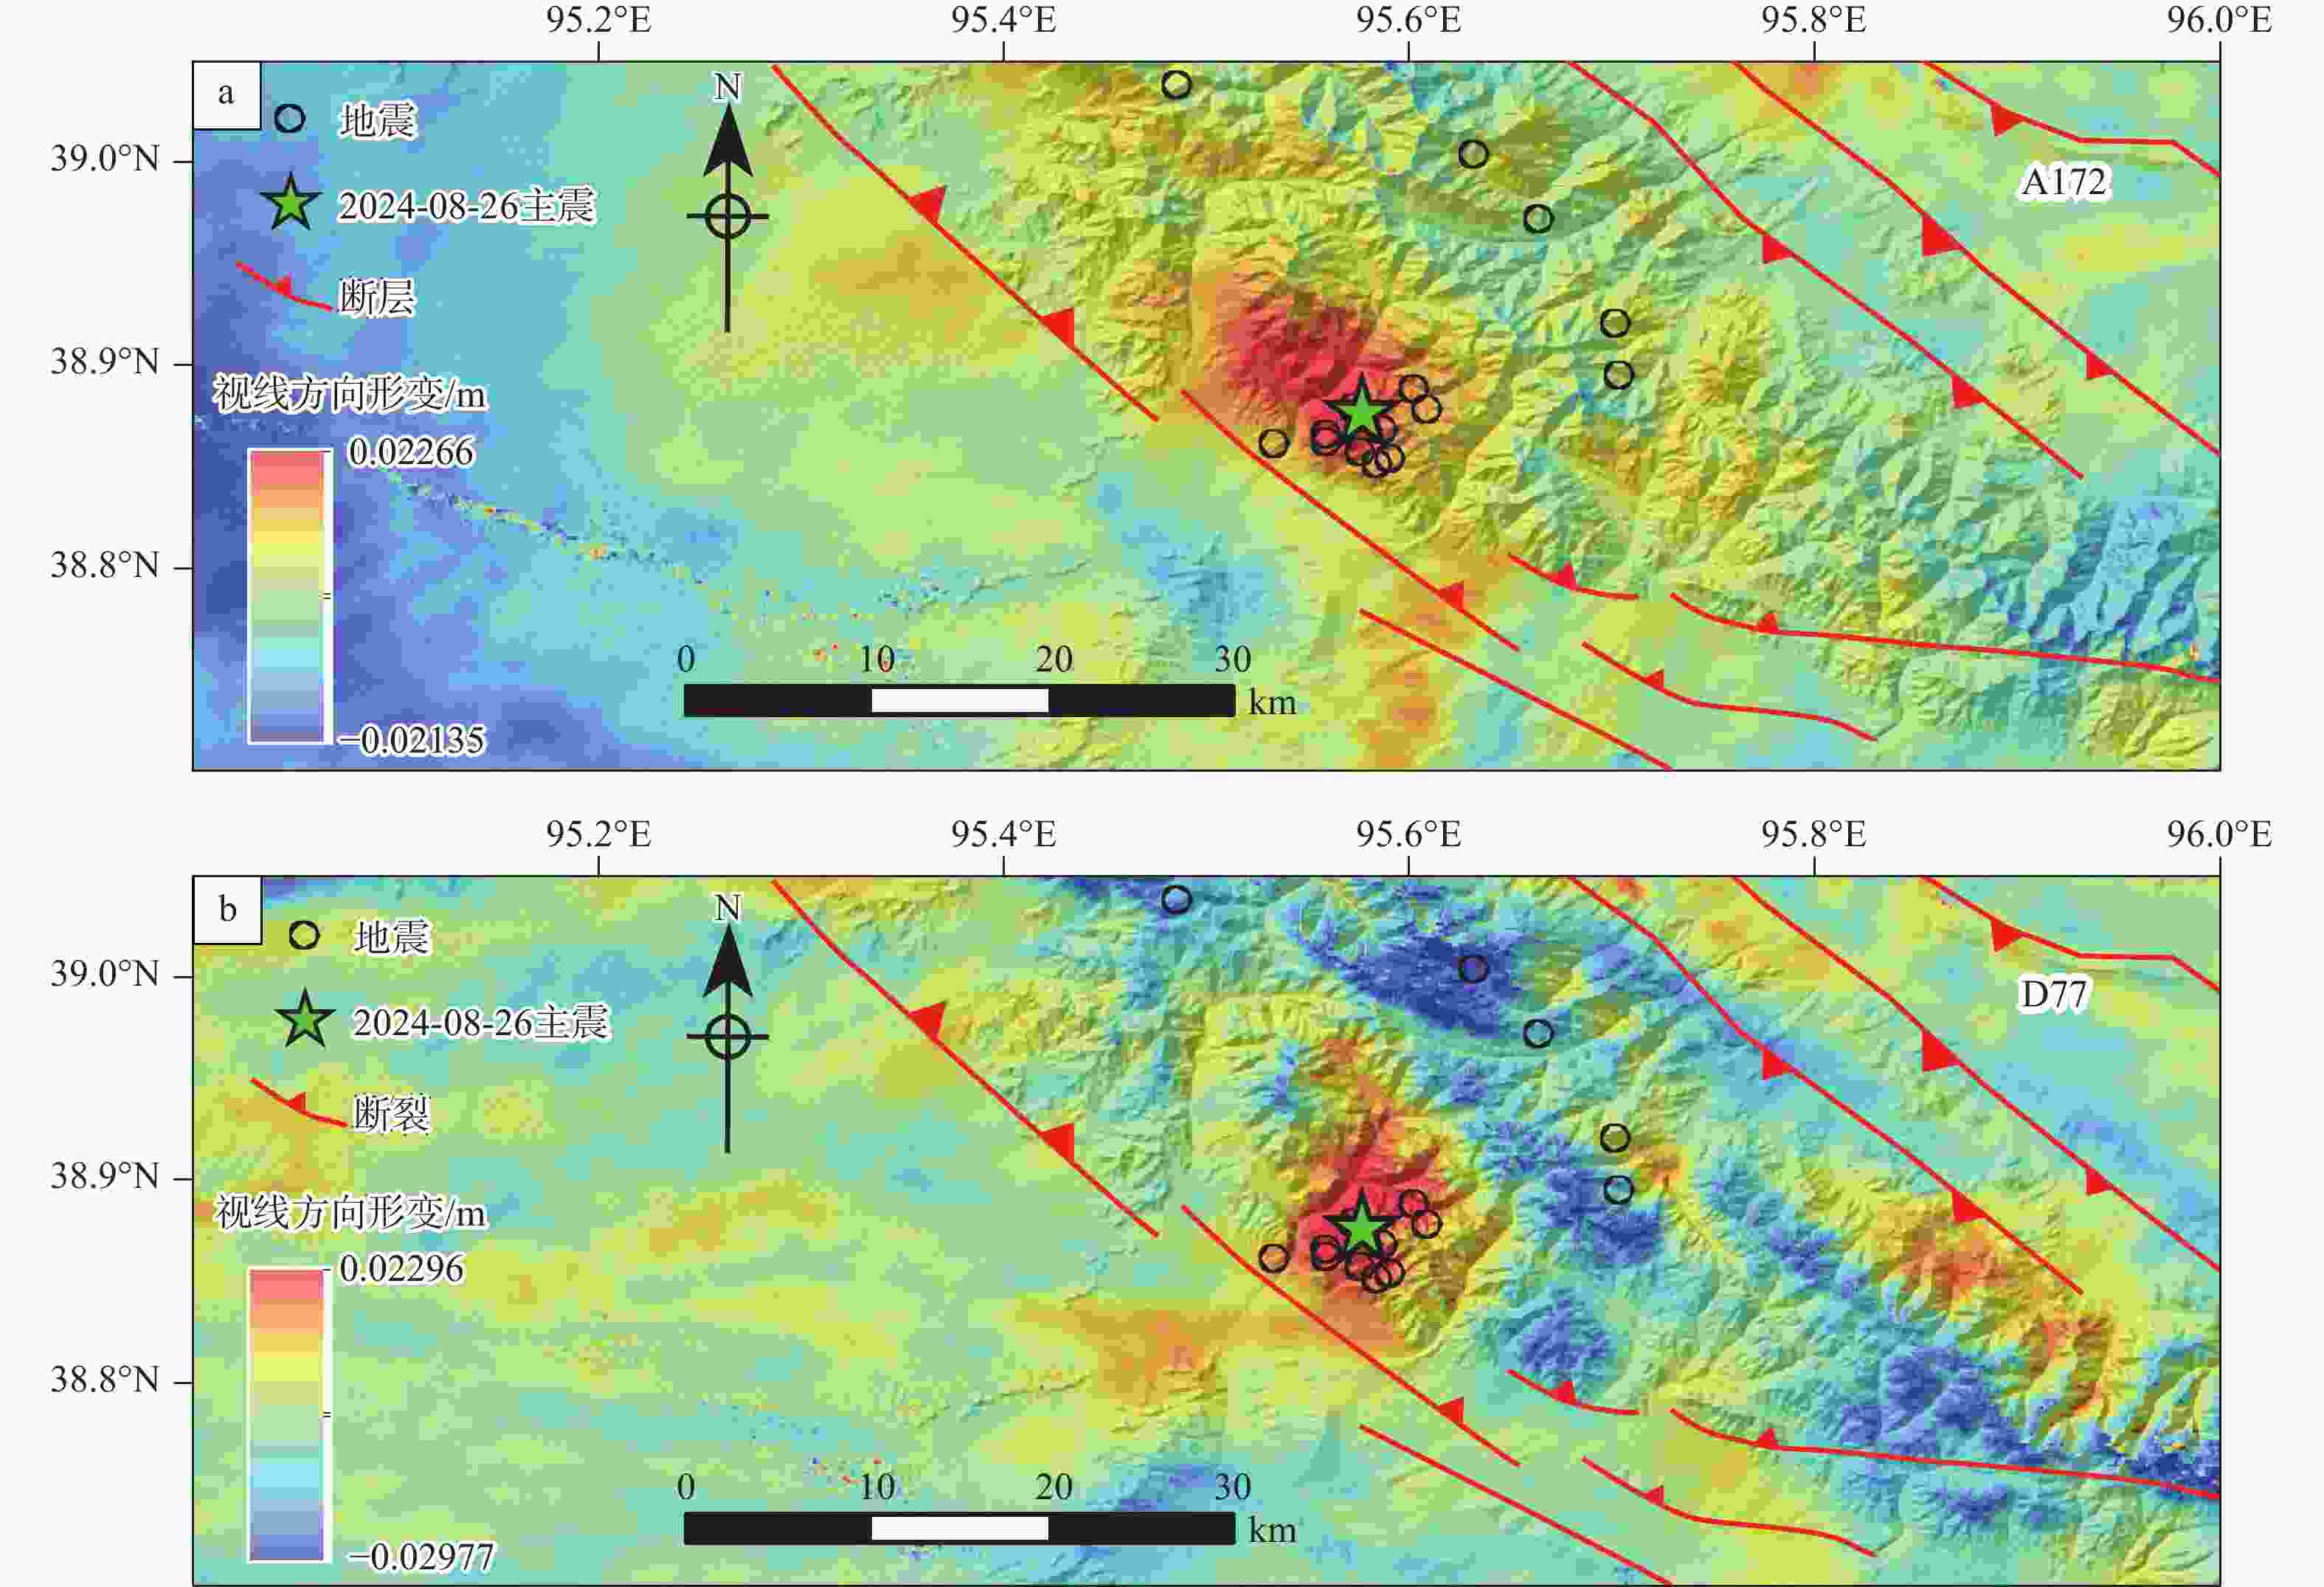
图 6 2021年阿克塞MS 5.5地震InSAR同震形变场特征
a—升轨(A172)视线方向形变场;b—降轨(D77)视线方向形变场
Figure 6. Coseismic deformation fields from InSAR of 2021 Aksai earthquake
(a) and (b) coseismic deformation fields in the ascending (A172) and descending (D77) orbits, respectively
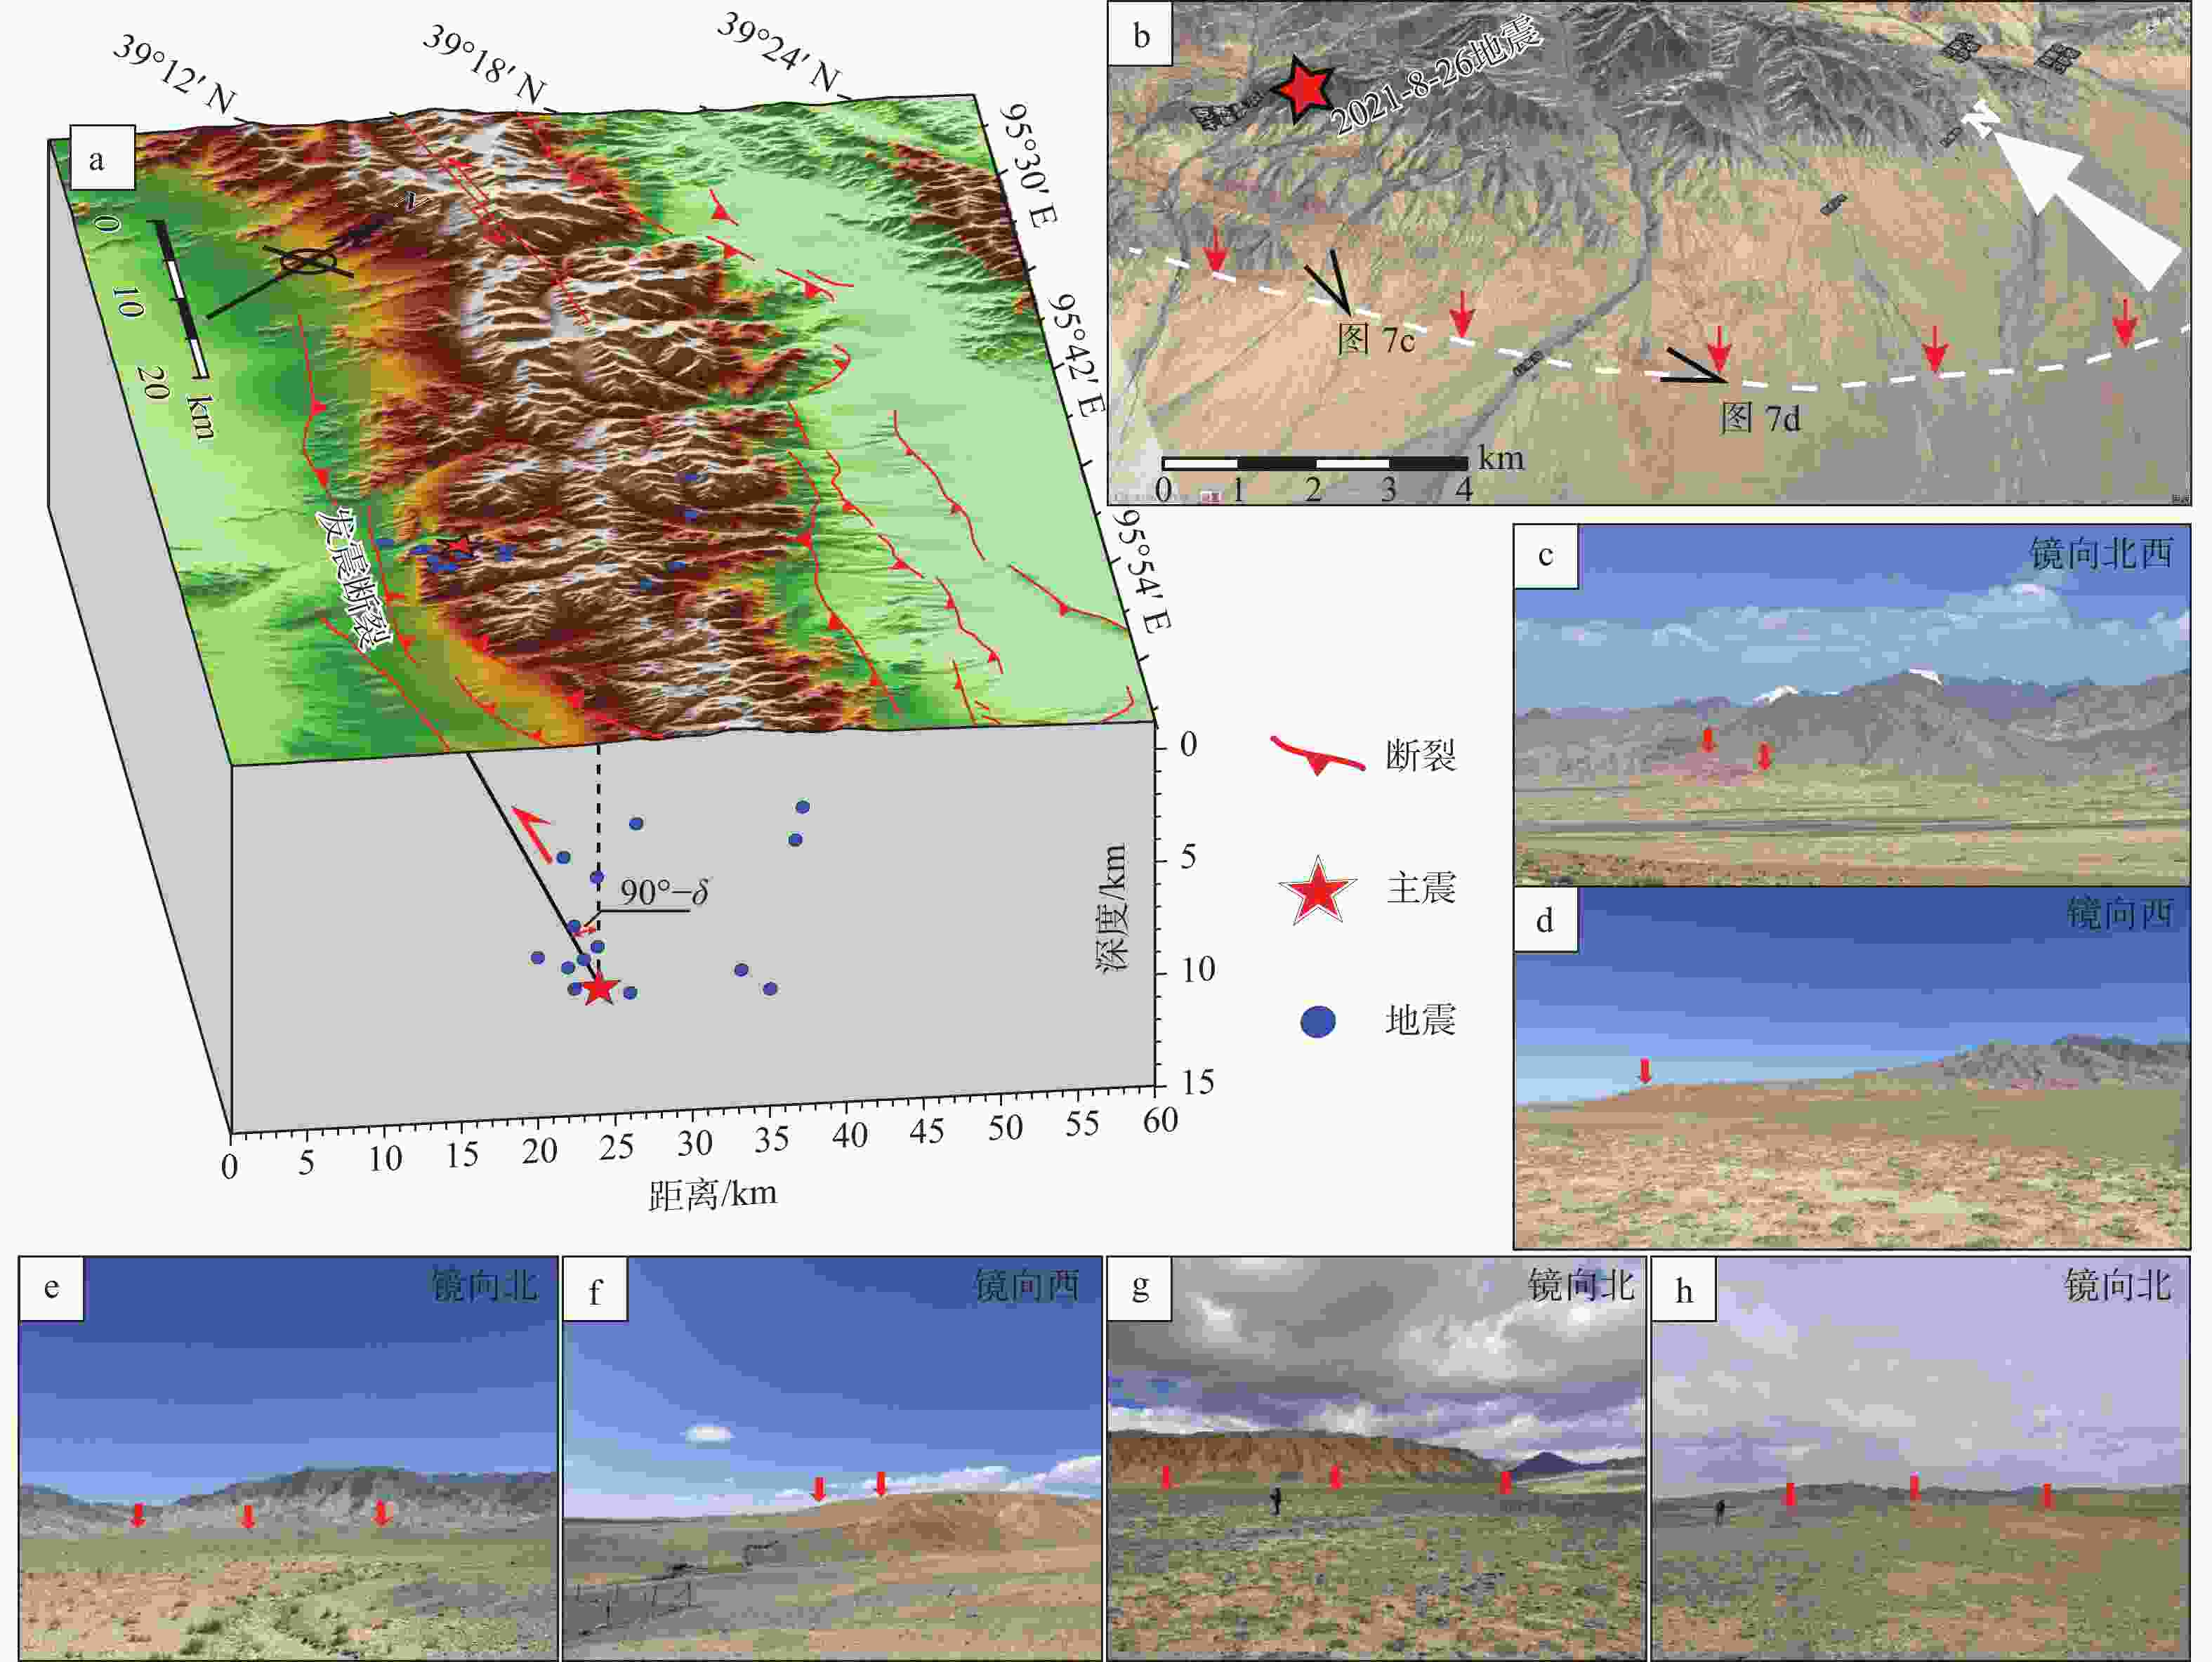
图 7 阿克塞MS5.5 地震发震构造和断层陡坎地貌
a—地震发震构造和破裂模式(δ为断裂倾角);b—震中卫星影像解译;c—h—党河南山南缘断裂断层陡坎地貌
Figure 7. Seismogenic fault of the Aksai earthquake and fault scarps along the southern Danghe Nan Shan Fault
(a) Seismogenic tectonics and rupture patterns of the Aksai earthquake (δ is the dip of the fault); (b) Geomorphic interpretation from satellite image; (c)—(h) Geomorphology of fault scarps along the southern Danghe Nan Shan Fault
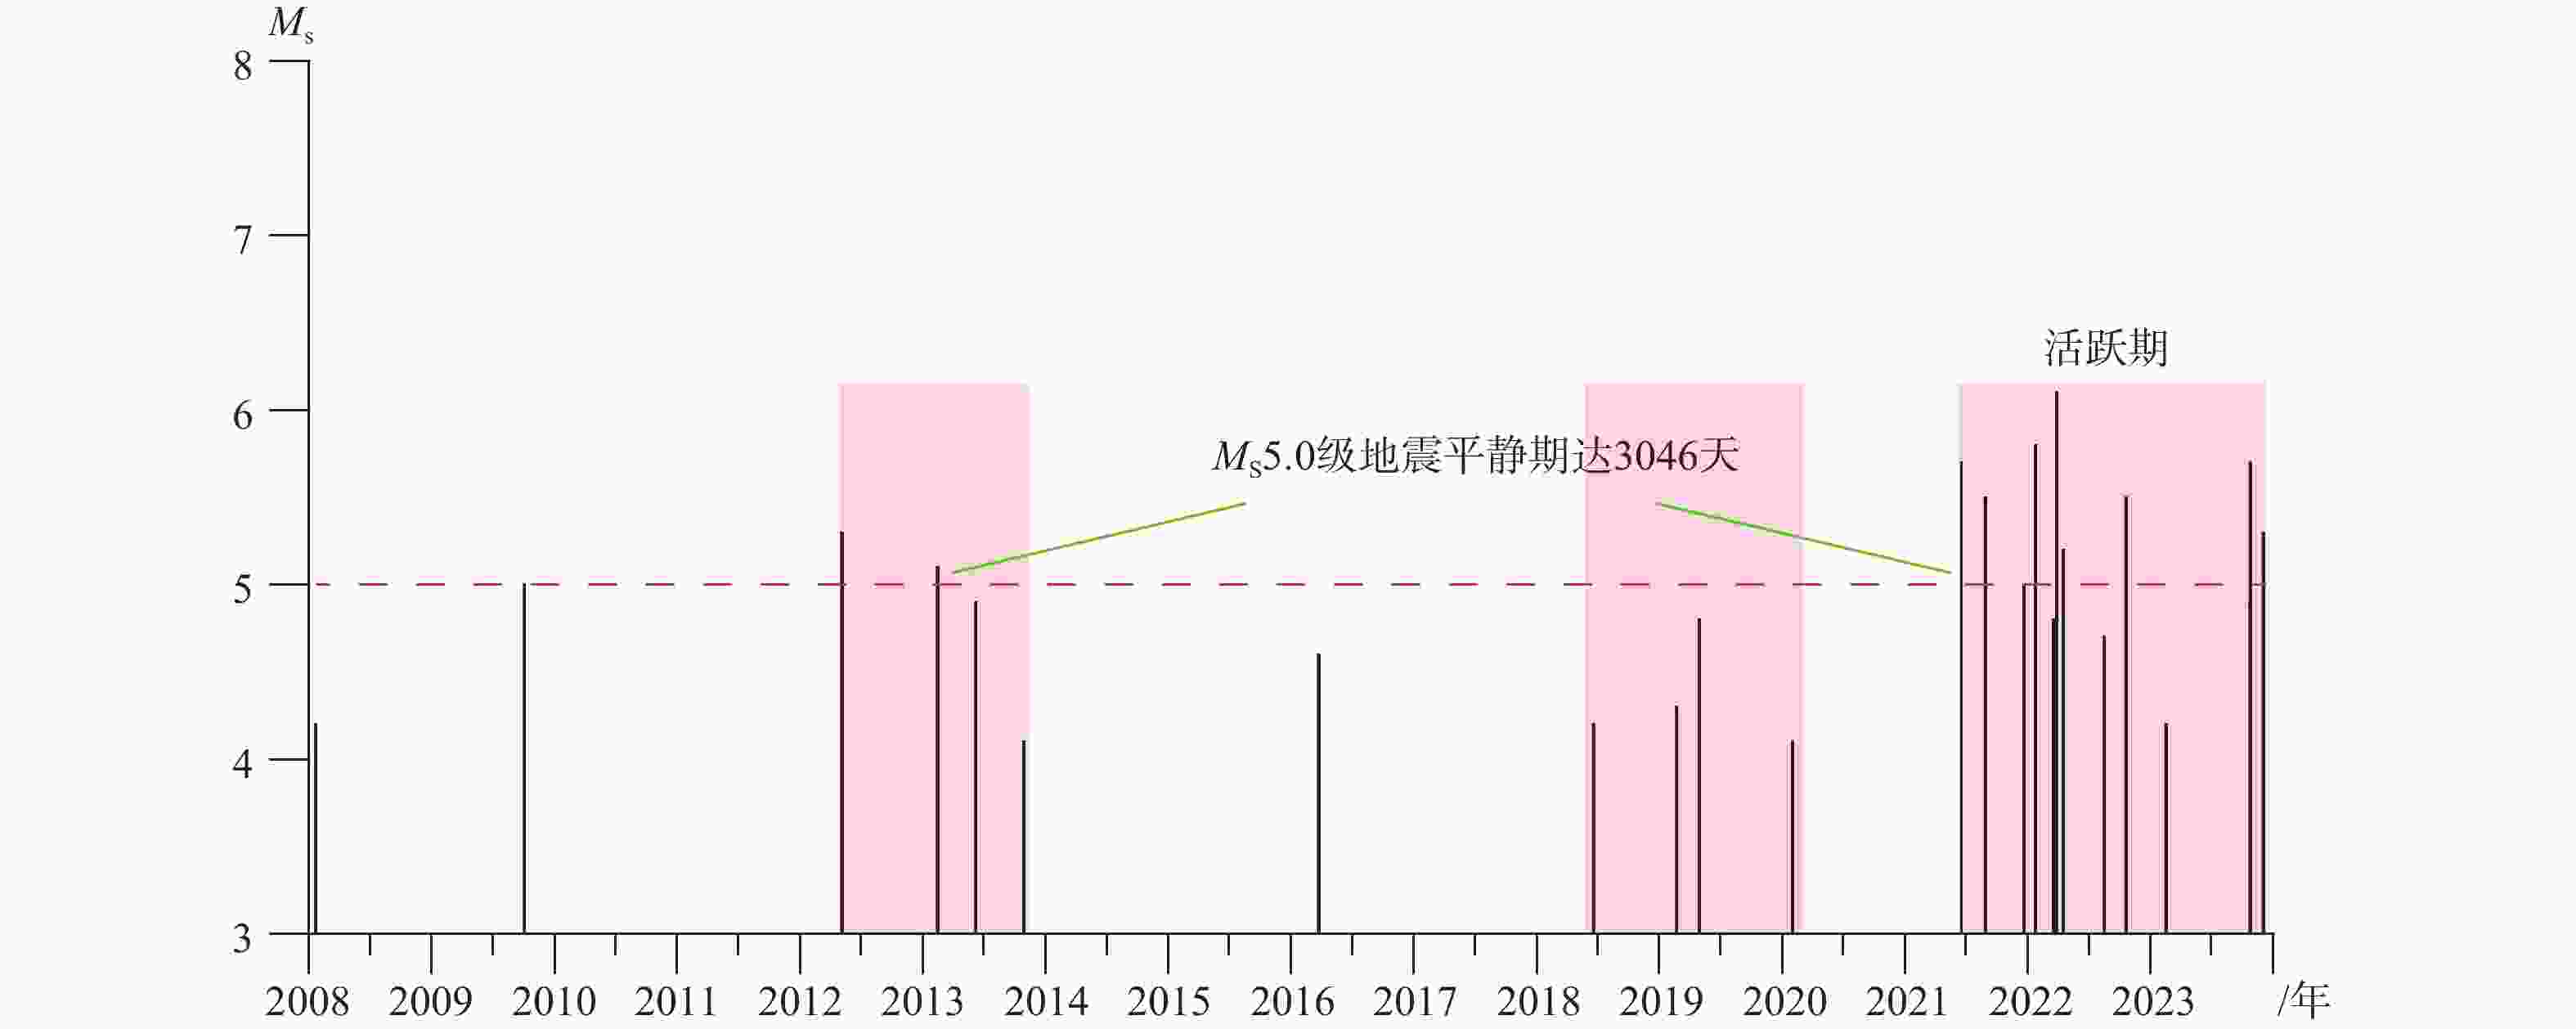
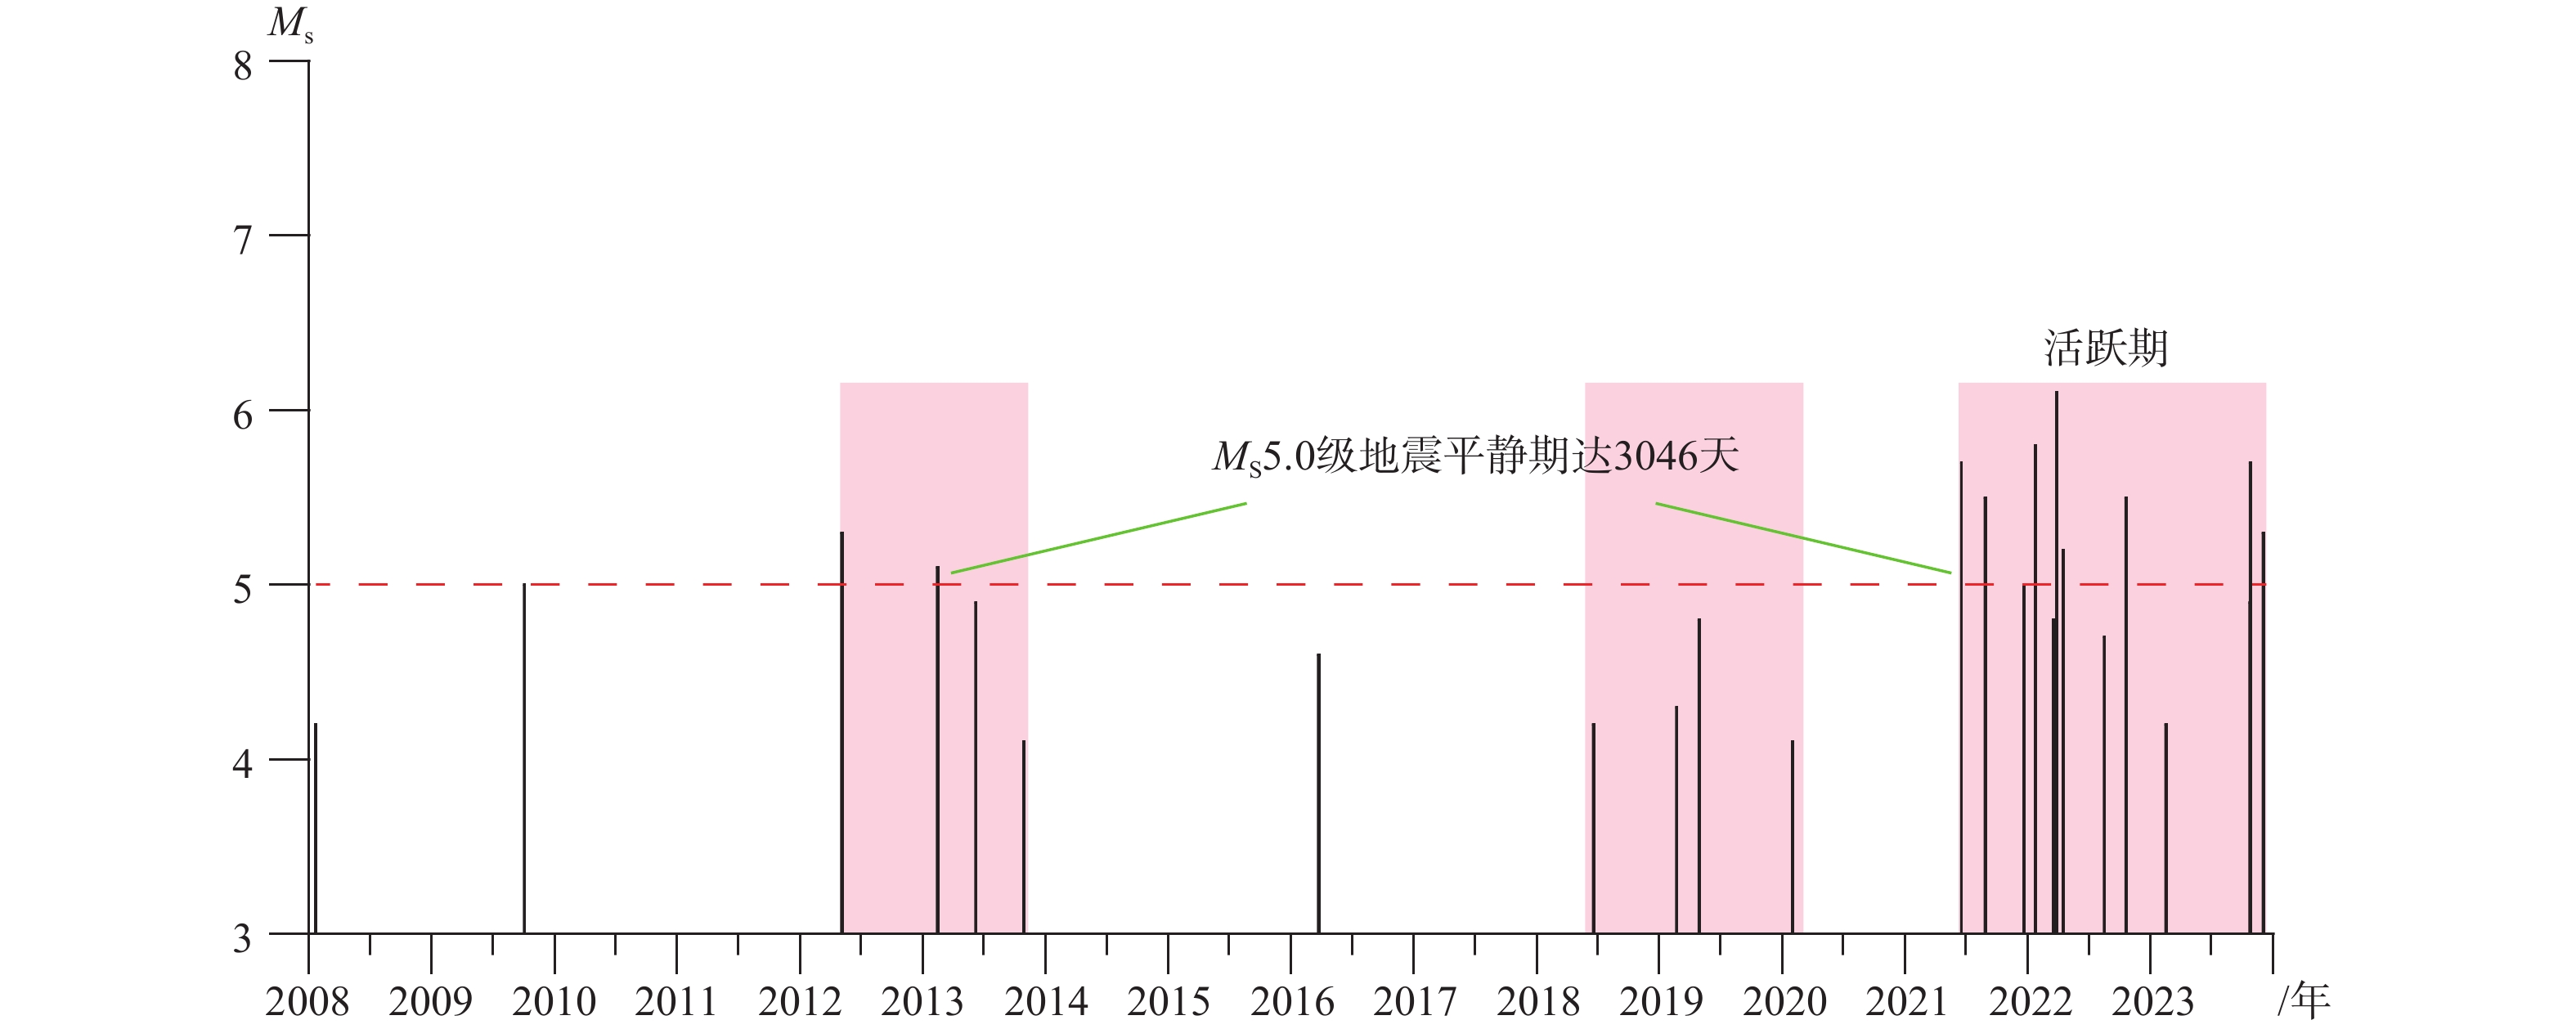
图 8 2008年至今祁连山西段(92°—100°E、37°—41.5°N)MS≥4.0地震震级−时间图
黑竖线为震级,粉红色影区示意地震活跃期,红色虚线为MS 5.0示意线
Figure 8. The Magnitude-time(M-t)diagram of the western Qilian Shan region since 2008
The seismic data used is Ms≥ 4.0 earthquakes in the western Qilian Shan region (longitude 92°–100°; latitude 37°–41.5°), since 2008. Seismic data in the western Qilian Shan region (longitude 92°–100°; latitude 37°–41.5°) with Ms≥ 4.0 magnitude since 2008. The black vertical line represents the magnitude, pink shaded area indicates the active period, and red dashed line represents the symbol line for Ms 5.0.
表 1 阿克塞地震震源机制解
Table 1. The results of focal mechanisms by different organizations
节面I 节面II P轴 T轴 深度/
km数据来源 走向/
(º)倾角/
(º)滑动角/
(º)走向/
(º)倾角/
(º)滑动角/
(º)方位角/
(º)倾伏角/
(º)方位角/
(º)倾伏角/
(º)310 39 71 154 54 105 234 8 111 76 17.4 Globe CMT
(Ekström et al.,2012)331 47 107 127 45 72 49 1 315 78 11.5 美国地质调查局 (USGS) 324.9 40.0 93.6 140.2 50.1 87.0 232.4 5.1 27.9 84.4 万永革,2019 331.3 37.6 66.6 180.0 56.0 107.0 257.9 9.5 134.9 73.0 6.1 薛善余等,2023 315 41 81 146 49 97 231 4 105 83 6.9 文中  下载: 导出CSV
-
[1] BAI Q P, NI S D, CHU R S, et al., 2020. gCAPjoint, a software package for full moment tensor inversion of moderately strong earthquakes with local and teleseismic waveforms[J]. Seismological Research Letters, 91(6): 3550-3562. doi: 10.1785/0220200031 [2] CHEN W W, NI S D, WANG Z J, et al., 2012. Joint inversion with both local and teleseismic waveforms for source parameters of the 2010 Kaohsiung earthquake[J]. Chinese Journal of Geophysics, 55(7): 2319-2328. (in Chinese with English abstract [3] EKSTRÖM G, NETTLES M, DZIEWOŃSKI A M, 2012. The global CMT project 2004-2010: centroid-moment tensors for 13, 017 earthquakes[J]. Physics of the Earth and Planetary Interiors, 200-201: 1-9. doi: 10.1016/j.pepi.2012.04.002 [4] ENGDAHL E R, VAN DER HILST R, BULAND R, 1998. Global teleseismic earthquake relocation with improved travel times and procedures for depth determination[J]. Bulletin of the Seismological Society of America, 88(3): 722-743. doi: 10.1785/BSSA0880030722 [5] GOLDSTEIN R M, WERNER C L, 1998. Radar interferogram filtering for geophysical applications[J]. Geophysical Research Letters, 25(21): 4035-4038. doi: 10.1029/1998GL900033 [6] HETZEL R, NIEDERMANN S, TAO M X, et al., 2002. Low slip rates and long-term preservation of geomorphic features in Central Asia[J]. Nature, 417(6887): 428-432. doi: 10.1038/417428a [7] KISSLING E, ELLSWORTH W L, EBERHART-PHILLIPS D, et al., 1994. Initial reference models in local earthquake tomography[J]. Journal of Geophysical Research: Solid Earth, 99(B10): 19635-19646. doi: 10.1029/93JB03138 [8] KISSLING E, KRADOLFER U, MAURER H, 1995. Program VELEST USER'S guide-short introduction[R]. Technical report. Institute of Geophysics, ETH Zuerich. [9] KLEIN F W, 1978. Hypocenter location program HYPOINVERSE: part I: users guide to versions 1, 2, 3, and 4. Part II. Source listings and notes[R]. Menlo Park: U.S. Geological Survey: 78-694. [10] LI L J, YAO X, ZHOU Z K, et al., 2022. The applicability assessment of Sentinel-1 data in InSAR monitoring of the deformed slopes of reservoir in the mountains of southwest China: a case study in the Xiluodu Reservoir[J]. Journal of Geomechanics, 28(2): 281-293. (in Chinese with English abstract [11] MASSONNET D, FEIGL K L, 1998. Radar interferometry and its application to changes in the earth's surface[J]. Reviews of Geophysics, 36(4): 441-500. doi: 10.1029/97RG03139 [12] MEYER B, TAPPONNIER P, GAUDEMER Y, et al., 1996. Rate of left-lateral movement along the easternmost segment of the Altyn Tagh fault, east of 96°E (China)[J]. Geophysical Journal International, 124(1): 29-44. doi: 10.1111/j.1365-246X.1996.tb06350.x [13] MEYER B, TAPPONNIER P, BOURJOT L, et al., 1998. Crustal thickening in Gansu-Qinghai, lithospheric mantle subduction, and oblique, strike-slip controlled growth of the Tibet plateau[J]. Geophysical Journal International, 135(1): 1-47. doi: 10.1046/j.1365-246X.1998.00567.x [14] QIU J T, LIU L, LIU C J, et al., 2019. The deformation of the 2008 Zhongba earthquakes and the tectonic movement revealed[J]. Seismology and Geology, 41(2): 481-498. (in Chinese) [15] QIU J T, SUN J B, 2023. Characteristics of normal-fault earthquake deformation in the Qinghai-Tibet Plateau revealed by InSAR[J]. Reviews of Geophysics and Planetary Physics, 54(6): 600-611 (in Chinese with English abstract [16] SHAO Y X, 2010. The activity features during late Quaternary of Yema River-Banghe Nan Shan faults in western Qilian Shan[D]. Lanzhou: China Earthquake Administration Lanzhou Institute of Seismology. (in Chinese with English abstract [17] SHAO Y X, YUAN D Y, LEI Z S, et al, 2011. The features of earthquake surface rupture zone on northern margin fault of Danghe Nanshan[J]. Technology for Earthquake Disaster Prevention, 6(4): 427-435. (in Chinese with English abstract [18] SHAO Y X, YUAN D Y, OSKIN M E, et al., 2017. Historical (Yuan Dynasty) earthquake on the North Danghe Nanshan Thrust, western Qilian Shan, China[J]. Bulletin of the Seismological Society of America, 107(3): 1175-1184. doi: 10.1785/0120160289 [19] SHAO Y X, VAN DER WOERD J, LIU-ZENG J, et al., 2023. Shortening rates and recurrence of large earthquakes from folded and uplifted terraces in the Western Danghe Nan Shan foreland, North Tibet[J]. Journal of Geophysical Research: Solid Earth, 128(1): e2021JB023736. doi: 10.1029/2021JB023736 [20] TAPPONNIER P, XU Z Q, ROGER F, 2001. Oblique stepwise rise and growth of the Tibet Plateau[J]. Science, 294(5547): 1671-1677. doi: 10.1126/science.105978 [21] VAN DER WOERD J, XU X W, LI H B, et al., 2001. Rapid active thrusting along the northwestern range front of the Tanghe Nan Shan (western Gansu, China)[J]. Journal of Geophysical Research: Solid Earth, 106(B12): 30475-30504. doi: 10.1029/2001JB000583 [22] WALDHAUSER F, ELLSWORTH W L, 2000. A Double-Difference earthquake location algorithm: method and application to the northern Hayward fault, California[J]. Bulletin of the Seismological Society of America, 90(6): 1353-1368. doi: 10.1785/0120000006 [23] WAN Y G, 2019. Determination of center of several focal mechanisms of the same earthquake[J]. Chinese Journal of Geophysics, 62(12): 4718-4728. (in Chinese) [24] WANG G M, WU Z H, PENG G L, et al., 2021. Seismogenic fault and it's rupture characteristics of the 21 May, 2021 Yangbi MS 6.4 earthquake: analysis results from the relocation of the earthquake sequence[J]. Journal of Geomechanics, 27(4): 662-678. (in Chinese with English abstract [25] WANG P T, 2016. A study on the rupture characteristics of great earthquake along Danghenanshan north piedmont fault with high resolution aerial-survey data[D]. Lanzhou: China Earthquake Administration Lanzhou Institute of Seismology. (in Chinese) [26] WANG S J, 2020. Research on co-seismic and post-seismic deformation of the 2015 Pishan earthquake based on sentinel-1a data[D]. Xi’an: Chang' an University. (in Chinese with English abstract [27] XIAO X G, 2019. Study on the evolution law of landslide and seismic deformation field based on InSAR technology —taking Jiuzhaigou Earthquake as an example[D]. Chengdu: Southwest Jiaotong University. (in Chinese with English abstract [28] XIE Z J, JIN B K, ZHENG Y, et al. , 2013. Source parameters inversion of the 2013 Lushan earthquake by combining teleseismic waveforms and local seismograms. Science China: Earth Sciences, 43(6): 1010-1019. (in Chinese) [29] XU X W, TAPPONNIER P, VAN DER WOERD J, et al. , 2003. Discussion on Late Quaternary left lateral strike-slip rate of Altun fault zone and its transformation model of tectonic movement[J]. Scientia Sinica (Terrae), 33(10): 967-974. (in Chinese with English abstract [30] XUE S Y, XIE H, YUAN D Y, et al.,2023. Relocation of the 2021 Aksai M5.5 earthquake and its tectonic implication[J]. China Earthquake Engineering Journal,45(3):540-551. (in Chinese with English abstract [31] YI G X, LONG F, VALLAGE A, et al., 2016. Focal mechanism and tectonic deformation in the seismogenic area of the 2013 Lushan Earthquake Sequence, Southwestern China[J]. Chinese Journal of Geophysics, 59(10): 3711-3731. (in Chinese with English abstract [32] YUAN D Y, GE W P, CHEN Z W, et al., 2013. The growth of northeastern Tibet and its relevance to large-scale continental geodynamics: a review of recent studies[J]. Tectonics, 32: 1-13. doi: 10.1029/2012TC003159 [33] YUAN D Y, FENG J G, ZHENG W J, et al., 2020. Migration of large earthquakes in Tibetan block area and disscussion on major active region in the future[J]. Seismology and Geology, 42(2): 297-315. (in Chinese with English abstract [34] ZHANG G W, LEI J S, 2013. Relocations of Lushan, Sichuan Strong Earthquake (Ms7.0) and its aftershocks[J]. Chinese Journal of Geophysics, 56(5): 1764-1771. (in Chinese with English abstract [35] ZHANG P Z, ZHENG D W, YIN G M, et al., 2006. Discussion on late Cenozoic growth and rise of northeastern margin of the Tibetan Plateau[J]. Quaternary Sciences, 26(1): 5-13. (in Chinese with English abstract [36] ZHANG P Z, ZHANG H P, ZHENG W J, et al., 2014. Cenozoic tectonic evolution of Continental eastern Asia[J]. Seismology and Geology, 36(3): 574-585. (in Chinese with English abstract [37] ZHAO L S, HELMBERGER D V, 1994. Source estimation from broadband regional seismograms[J]. Bulletin of the Seismological Society of America, 84(1): 91-104. [38] ZHAO P, 2009. Active characteristics study of major faults in the Suberegion in the Late Quaternary[D]. Beijing: Institute of Geology, China Earthquake Administrator. (in Chinese with English abstract [39] ZHENG W J, ZHANG P Z, YUAN D Y, et al., 2009. Deformation on the northern of the Tibetan Plateau from GPS measurement and geologic rates of Late Quaternary along the major fault[J]. Chinese Journal of Geophysics, 52(10): 2491-2508. (in Chinese with English abstract [40] ZHENG W J, ZHANG P Z, HE W G, et al., 2013. Transformation of displacement between strike-slip and crustal shortening in the northern margin of the Tibetan Plateau: evidence from decadal GPS measurements and late Quaternary slip rates on faults[J]. Tectonophysics, 584: 267-280. doi: 10.1016/j.tecto.2012.01.006 [41] ZHENG W J, YUAN D Y, ZHANG P Z, et al., 2016. Tectonic geometry and kinematic dissipation of the active faults in the northeastern Tibetan plateau and their implications for understanding Northeastward growth of the plateau[J]. Quaternary Sciences, 36(4): 775-788. (in Chinese with English abstract [42] ZHU L P, HELMBERGER D V, 1996. Advancement in source estimation techniques using broadband regional seismograms[J]. Bulletin of the Seismological Society of America, 86(5): 1634-1641. doi: 10.1785/BSSA0860051634 [43] 陈伟文,倪四道,汪贞杰,等,2012. 2010年高雄地震震源参数的近远震波形联合反演[J]. 地球物理学报,55(7):2319-2328. doi: 10.6038/j.issn.0001-5733.2012.07.017 [44] 李凌婧,姚鑫,周振凯,等,2022. Sentinel-1数据在西南山区水库变形斜坡InSAR监测中的适用性评价:以溪洛渡水库为例[J]. 地质力学学报,28(2):281-293. [45] 邱江涛,刘雷,刘传金,等,2019. 2008年仲巴地震形变及其揭示的构造运动[J]. 地震地质,41(2):481-498. doi: 10.3969/j.issn.0253-4967.2019.02.014 [46] 邱江涛,孙建宝,2023. InSAR揭示的青藏高原近期正断型地震形变特征与指示意义[J]. 地球与行星物理论评(中英文),54(6):600-611. [47] 邵延秀,2010. 祁连山西段野马河—党河南山断裂晚第四纪活动特征[D]. 兰州:中国地震局兰州地震研究所. [48] 邵延秀,袁道阳,雷中生,等,2011. 党河南山北缘断裂古地震形变带特征研究[J]. 震灾防御技术,6(4):427-435. doi: 10.3969/j.issn.1673-5722.2011.04.008 [49] 万永革,2019. 同一地震多个震源机制中心解的确定[J]. 地球物理学报,62(12):4718-4728. doi: 10.6038/cjg2019M0553 [50] 王光明,吴中海,彭关灵,等,2021. 2021年5月21日漾濞MS6.4地震的发震断层及其破裂特征:地震序列的重定位分析结果[J]. 地质力学学报,27(4):662-678. doi: 10.12090/j.issn.1006-6616.2021.27.04.055 [51] 王朋涛,2016. 基于高分辨航测数据研究党河南山北缘断裂的大震破裂习性[D]. 兰州:中国地震局兰州地震研究所. [52] 王思佳,2020. 基于Sentinel-1A的2015年皮山地震同震及震后形变研究[D]. 西安:长安大学. [53] 肖星光,2019. 基于InSAR技术的滑坡与同震形变场演化规律研究:以九寨沟地震为例[D]. 成都:西南交通大学. [54] 谢祖军,金笔凯,郑勇,等,2013. 近远震波形反演2013年芦山地震震源参数[J]. 中国科学:地球科学,43(6):1010-1019. [55] 徐锡伟,TAPPONNIER P,VAN DER WOERD J,等,2003. 阿尔金断裂带晚第四纪左旋走滑速率及其构造运动转换模式讨论[J]. 中国科学(D辑),33(10):967-974. [56] 薛善余,谢虹,袁道阳,等,2023. 2021年阿克塞M5.5地震重定位及构造意义[J]. 地震工程学报,45(3):540-551. [57] 易桂喜,龙锋,VALLAGE A,等,2016. 2013年芦山地震序列震源机制与震源区构造变形特征分析[J]. 地球物理学报,59(10):3711-3731. doi: 10.6038/cjg20161017 [58] 袁道阳,冯建刚,郑文俊,等,2020. 青藏地块区大地震迁移规律与未来主体活动区探讨[J]. 地震地质,42(2):297-315. doi: 10.3969/j.issn.0253-4967.2020.02.004 [59] 张广伟,雷建设. 2013. 四川芦山7.0级强震及其余震序列重定位[J]. 地球物理学报,56(5):1764-1771. [60] 张培震,郑德文,尹功明,等,2006. 有关青藏高原东北缘晚新生代扩展与隆升的讨论[J]. 第四纪研究,26(1):5-13. doi: 10.3321/j.issn:1001-7410.2006.01.002 [61] 张培震,张会平,郑文俊,等,2014. 东亚大陆新生代构造演化[J]. 地震地质,36(3):574-585. doi: 10.3969/j.issn.0253-4967.2014.03.003 [62] 赵朋,2009. 肃北地区主要断裂晚第四纪活动特征研究[D]. 北京:中国地震局地质研究所. [63] 郑文俊,张培震,袁道阳,等,2009. GPS观测及断裂晚第四纪滑动速率所反映的青藏高原北部变形[J]. 地球物理学报,52(10):2491-2508. doi: 10.3969/j.issn.0001-5733.2009.10.008 [64] 郑文俊,袁道阳,张培震,等,2016. 青藏高原东北缘活动构造几何图像、运动转换与高原扩展[J]. 第四纪研究,36(4):775-788. doi: 10.11928/j.issn.1001-7410.2016.04.01 -

 下载:
下载:


计量
- 文章访问数: 764
- HTML全文浏览量: 374
- PDF下载量: 77
- 被引次数: 0
