留言板

尊敬的读者、作者、审稿人, 关于本刊的投稿、审稿、编辑和出版的任何问题, 您可以本页添加留言。我们将尽快给您答复。谢谢您的支持!

姓名
邮箱
手机号码
标题
留言内容
验证码

青海五龙沟金矿区蚀变矿物光谱特征与找矿应用

周轶群 胡道功

黄启文, 李阿伟, 2019. 高应力条件下的岩芯电磁性能变化. 地质力学学报, 25 (4): 453-458. DOI: 10.12090/j.issn.1006-6616.2019.25.04.042
引用本文: 周轶群, 胡道功, 2012. 青海五龙沟金矿区蚀变矿物光谱特征与找矿应用. 地质力学学报, 18 (3): 331-338.
HUANG Qiwen, LI Awei, 2019. STRESS INDUCED CHANGES IN THE ELECTRICAL-MAGNETIC PROPERTIES OF ROCK CORESHUANG. Journal of Geomechanics, 25 (4): 453-458. DOI: 10.12090/j.issn.1006-6616.2019.25.04.042
Citation: ZHOU Yi-qun, HU Dao-gong, 2012. SPECTRAL CHARACTERISTICS OF ALTERATION MINERALS AND ITS APPLICATION IN GOLD DEPOSIT PROSPECTING IN WULONGGOU, QINGHAI PROVINCE. Journal of Geomechanics, 18 (3): 331-338.

青海五龙沟金矿区蚀变矿物光谱特征与找矿应用

基金项目: 

中国地质调查局矿产资源评价专项"野外地质调查服务与管理系统研建与应用" 1212011120215

详细信息
    作者简介:

    周轶群(1987-), 女, 湖北襄阳人, 硕士研究生, 主要研究方向:第四纪地质及遥感信息技术应用。E-mail:ayumi541@163.com

  • 中图分类号: P627

SPECTRAL CHARACTERISTICS OF ALTERATION MINERALS AND ITS APPLICATION IN GOLD DEPOSIT PROSPECTING IN WULONGGOU, QINGHAI PROVINCE

  • 摘要: 使用近红外光谱仪对五龙沟金矿区主要蚀变矿物进行了光谱测试,获得该矿区主要蚀变矿物的光谱数据;同时选择部分具有代表性的样品进行详细的镜下鉴定,并将镜下鉴定结果与野外实测光谱曲线进行对比分析,检查其对五龙沟金矿体矿化蚀变快速检测的有效性和准确度。对比分析结果表明,蚀变分带与矿体吻合较好,对矿化分带具有较好的指示意义,也为该区的金矿勘探提供了依据。


  • Brady[1, 2], Li[3], Anastasiadis[4], Jensen[5], Niu[6], Ma[7, 8], and Yao[9] have researched the electromagnetic properties of rocks under stress, and the electromagnetic (EM) waves produced and their interaction with the ionosphere.

    To measure the electric current pulse produced under stress of fracturing rock samples, the charge measuring digital electrometer[4], and the short-circuit(to ground) streaming current[5] method have been used. Both show that at the onset of fracture there is a DC current pulse.

    This experiment uses a third method: a closed series circuit to measure the induced exoelectron cloud. A battery is in series with a digital voltmeter, oscilloscope, and the rock sample. The digital voltmeter measures the DC current flow caused by the battery's electric field, while the oscilloscope measures the AC component induced as the exoelectron cloud absorbs EM waves. The advantage of this closed setup is that both DC and AC currents are measured and it is easier to explore the physical origins of the exoelectron current.

    Various phenomenological models have been proposed to explain the data: piezoelectric effect[1], and the moving charge dislocation model[4] (MCD). The existing Standard Lattice Model (SLM) popularized by physicists, and chemists is adopted here.

    Poly-crystalline rocks (where the crystals are randomly oriented) can be modeled as a lattice array of predominantly Si-O-Si bonds(Figure 1). Other atoms can substitute for Si, eg. Li, Al, Ca, Na, etc.

    Figure  1.  Quartz lattice structure, interstitial space between atoms where exoelectrons can move in

    Under high pressure, the outer shell electron of the Si-O dipole will get squeezed into the interstitial space between atoms, creating a loosely bound exoelectron cloud that increases as the stress increases. This phenomenon which appears at high stress, is due to two sources: (a) the quantum mechanical electron tunneling effect[10], and (b) breaking bond electrons.

    (a) The outermost electron of the oxygen atom is bound in a shallow potential well (~0.38 volts); when stress energy is applied, this electron absorbs part of this energy, thus increasing its kinetic energy. By itself, this slight increase in energy is insufficient for the electron to overcome and jump out of its potential well; but it is enough to increase its probability of tunneling through the well wall into the lattice interstitial between atoms. This probability multiplied by the number of available oxygen atoms gives the number of the electrons that tunnel out and form the exoelectron cloud: typically of the order of picocoulombs to nanocoulombs.

    (b) Electrons released by breaking bonds from micro-crack initiation. Crack nucleation centres most probably start in parallel. Whenever a Si-O bond breaks, a dangling +Si bond is created along with a free electron attached to the -O atom which will hop from atom to atom. This electron current is proportional to the cracks'surface area, and the collection efficiency of the battery electrodes. The broken bond electron cloud is much more than the tunneling cloud.

    The measured current pulse will have an initial slowly rising tunneling part, followed by a suddenly rising broken bond current.

    The lattice under high pressure will also give rise to the following phenomena:

    ① strain-creep related EM radiation: due to the changes in Si-O dipole moment as the lattice contracts, and flows in different directions.

    ② light emission from breaking, and recombining Si-O bonds.

    ③ charge accumulation, and separation resulting in spark discharges and the concurrent light and EM emissions.

    ④ sound emissions from the strained lattice, and eventually crack propagation.

    Further experiments are underway to measure these effects as a function of pressure.

    Generally speaking, the exoelectron current effect is measurable in hard insulator rocks (granite, basalt, limestone, marble, etc.): the stress energy goes into distorting and breaking the Si-O bonds. In soft rocks (sandstone, shale, etc.) the stress energy is dissipated as the rock grains are forced into the inter-granular voids thus reducing the energy that could go into stressing the lattice bonds: consequently the exoelectron current is not measurable. Conducting rocks (pyrite, etc.) which have a relatively high background current flow would mask the normally weak exoelectron current(nano-amp range).

    For this experiment granite (large grained, igneous rock) and basalt (fine grained) samples were chosen to differentiate between the piezoelectric explanation and the SLM explanation for the tunneling and broken bond current measured. Sandstone (porous) and shale (sedimentary rock) were also measured and show no clear exoelectron current effect. Marble (metamorphic rock) has been measured by others[4], and shown to have the DC exoelectron effect.

    When the stressed core sample is placed in series with a battery, voltmeter and oscilloscope, the electron cloud will flow. The voltmeter detects the direct current (DC) I, and the oscilloscope measures the alternating current (AC) component.

    The exoelectron cloud will also absorb, and scatter an E.M. wave. The wave's energy E (a constant) is converted into the induced alternating (AC) current's power: V(f)×I(f). The frequency of the current is also the wave's frequency f.

    The energy of the EM wave is a constant during the experiment: E=V×I. Thus when the current I increases (as when tunneling electrons and breaking bond electrons move into the interstitial lattice), V drops. This drop in the AC amplitude as the stress increases is measured with the oscilloscope's Fourier Transform feature.

    Figure  2.  Experimental setup (200 ton press, with the sample (25 mm×50 mm cylinder), voltmeter, oscilloscope, and battery in a series circuit, and 50 Hz background radiation)

    The direct current I (mV) vs Stress curves measured by the digital voltmeter (DVM) for granite (Figure 3), and basalt follow (Figure 4). Both show an initial distinct gradual rise in I (due to the tunneling current), before a sudden rise (due to breaking bonds) at the fracture point.

    Figure  3.  Voltage vs Stress/Time, granite sample
    Figure  4.  Voltage vs Stress/Time, basalt sample

    The next photo shows the AC current results: First is the oscilloscope trace of the 50 Hz AC current component; then immediately below, the Fourier Transform showing the 50 Hz peak bracketed by left cursor at 40 Hz and right cursor at 60 Hz.(Figure 5)

    Figure  5.  Screen photo

    Figure 6 shows the start of the drop in the FT voltage peak as the AC current increases at higher and higher stress. A minimum is reached just before the major fracture, and minor cracks sounds are heard. After complete fracture and the stress drops to zero, the voltage peak rises back to the same level before stress was applied.

    Figure  6.  50 Hz FT peak at different times

    This small experiment confirms that EM waves can actively probe the stress changes in a highly stressed crust zone just before crack initiation. As the stress increases to breaking point, the exoelectron cloud increases in size.

    It has been suggested that the DC exoelectron current effect can be due to a piezoelectric cause. However a careful use of the Standard Lattice Model rules out this explanation: 1) Both granite (with coarse grained randomly oriented crystals, which might have a piezoelectric effect) and basalt (with fine grained crystals, with no known piezoelectric properties) have the same characteristic I(current) vs Stress curve at the approach to rupture, i.e. a slow rise followed by a sharp rise. 2) The strain/stress on a non-central symmetric piezoelectric crystal induces an electric field (voltage), but no free electrons. This is the definition of the piezoelectric effect. 3) Moreover, the piezo-voltage effect is present at low pressures too; Whereas the exoelectron current effect is only observed at high stress close to the rupture point.

    The exo-electron cloud and the induced DC current explains in a simple way the changes in rock sample conductivity (resistance) at high stress or pressures as reported by others. It also is the reason for increases in the measured electric charge field in crushing concrete compression tests.

    Ultra-low-frequency (ULF) waves[3] interacting with the ionosphere are being studied for earthquake precursors. These time-coincident data are complicated and do not show a clear cause-effect relationship. Satellite and ground receivers are used in this research.

    These studies use a 'passive' method unlike the 'active' approach proposed in this research: a radio transmitter transmits an EM wave that reflects off the exoelectron cloud created by a high differential stress fault zone.

    This active method would complement the existing ground station, and satellite receiving networks.

    The AC (alternating current) exoelectron current effect shows that the absorption of EM waves by rupturing rock, though small, is measurable and can be exploited to good effect.

    A probing E.M. wave beam will reflect off the exoelectron cloud produced at a high stress fault zone. When the differential stress reaches a critical intensity, the zone's strained crystal structure starts releasing more and more exoelectrons. Eventually the crystalline rock structure starts to crack producing an event. Further experiments are planned to measure and confirm this remote active sensing method.

    The reflected EM waves data would complement in-situ stress data[6, 7]. These two methods together would be more effective than either one individually.

    It is pointed out that other phenomena: strain-creep radiation, light emission, sound emission, and static electricity are produced concurrently. The detection and measurement of all the above five phenomena would be a necessary condition to anticipate an actual event.

    This research was supported by a Director's Research grant(2016-2018, DZLXJK201605). The assistance, and advice from the following are gratefully noted: PENG Hua, WANG Hongcai, MA Xiumin, JIANG Jingjie, PENG Liguo, WANG Fusheng, MA Yue, SUN Dongsheng, LIU Shengxin

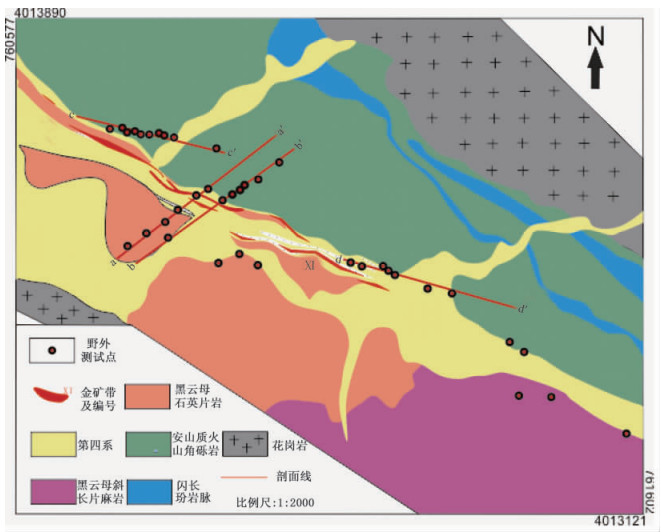
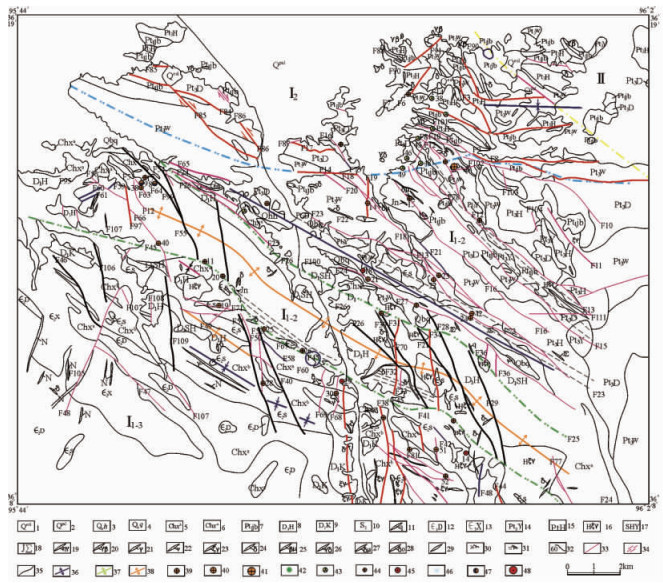
  • 图  1  五龙沟金矿矿区地质简图(陆露,2011;据五龙沟金矿内部研究报告修编,2008)

    1—第四系风成砂;2—第四系冲洪积砂、砾石层;3—青白口系变火山岩组;4—青白口系丘吉东沟组;5—长城系小庙组上段;6—长城系小庙组下段;7—下元古代白沙河岩组;8—泥盆纪侵入岩-淡肉红色中粗粒黑云母钾长花岗岩;9—泥盆纪侵入岩-灰-浅灰色中粗粒二长花岗岩;10—晚志留纪侵入岩;11—晚志留纪-晚泥盆纪侵入岩;12—寒武纪侵入岩-浅灰中粗粒二长花岗岩;13—寒武纪侵入岩-浅灰黑云母花岗闪长岩;14—晚元古代侵入岩-浅灰中粗粒黑云母花岗闪长岩;15—晚元古代侵入岩-灰色中细粒石英闪长岩;16—肉红色中粒强蚀变钾长花岗岩;17—深灰绿色中粒硅化角闪辉长石;18—尖黑山单元:灰绿色透闪石化橄辉岩;19—二长花岗岩脉;20—黑云母花岗岩脉;21—石英脉;22—花岗岩脉;23—钾长花岗岩脉;24—闪长岩脉;25—辉绿玢岩脉;26—辉石闪长岩脉;27—闪长玢岩脉;28—石英闪长岩脉;29—岩脉;30—岩层产状;31—岩石片理产状;32—岩石片麻理产状;33—断层;34—韧性剪切带;35—地层界线;36—背斜轴迹;37—倒装向斜轴迹;38—向斜轴迹;39—小型金矿床位置;40—中型金矿床位置;41—大型金矿床位置;42—铜金属矿化位置点;43—多金属矿化位置点;44—金矿化点;45—铁矿化位置点;46—钼矿化位置点;47—多金属矿点;48—铅锌矿点位

    Figure  1.  Geological sketch map of WuLonggou gold deposit
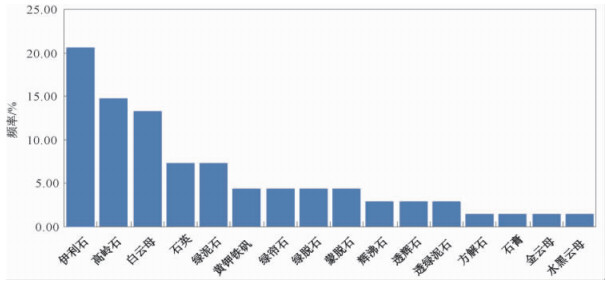
    图  2  工作区地质简图

    Figure  2.  Geological sketch map of working area

    图  3  野外实测蚀变矿物频率直方图

    Figure  3.  Frequency histogram of measured alteration minerals in field by using PNIRS

    图  4  野外实测PNIRS光谱图与室内镜下照片对比

    Figure  4.  Contrasting sample graphics measured by PNIRS in field to the microscopic images

  • [1] 李厚民, 钱壮志, 胡正国, 等.青海省都兰县五龙沟地区金矿化类型[J].青海地质, 1999, (1):36~41. http://www.cnki.com.cn/Article/CJFDTOTAL-GTJL199901006.htm

    LI Hou-min, QIAN Zhuang-zhi, HU Zheng-guo, et al. Type of gold mineralization in Wulonggou area, Qinghai[J]. Qinghai Geology, 1999, (1):36~41. http://www.cnki.com.cn/Article/CJFDTOTAL-GTJL199901006.htm
    [2] 田国强, 朱多禄, 田咏.五龙沟铜锌矿地质成因探讨[J].甘肃冶金, 2006, 28(3):63~65. http://www.cnki.com.cn/Article/CJFDTOTAL-GSYE200603025.htm

    TIAN Guo-qiang, ZHU Duo-lu, TIAN Yong. Genetic discuss of Cu-Zn deposit of Wulonggou[J]. Gansu Metallurgy, 2006, 28(3):63~65. http://www.cnki.com.cn/Article/CJFDTOTAL-GSYE200603025.htm
    [3] 袁万明, 莫宣学, 喻学惠, 等.东昆仑印支期区域构造背景的花岗岩记录[J].地质论评, 2000, 46(2):203~211. http://www.cnki.com.cn/Article/CJFDTOTAL-DZLP200002012.htm

    YUAN Wan-ming, MO Xuan-xue, YU Xue-hui, et al. The record of Indosinian tectonic setting from the granotoid of eastern Kunlun Mountains[J]. GeologicalReview, 2000, 46(2):203~211. http://www.cnki.com.cn/Article/CJFDTOTAL-DZLP200002012.htm
    [4] 钱壮志, 胡正国, 刘继庆.东昆仑北西向韧性剪切带发育的区域构造背景:以石灰沟韧性剪切带为例[J].成都理工学院学报, 1998, 25(2):201~205. http://www.cnki.com.cn/Article/CJFDTOTAL-CDLG802.014.htm

    QIAN Zhuang-zhi, HU Zheng-guo, LIU Ji-qing. Northwest ductile shear zones and their tectonic setting in the east of Kunlun Mountains:Take Shihuigou ductile shear zone as an example[J]. Journal of Chengdu University of Technology, 1998, 25(2):201~205. http://www.cnki.com.cn/Article/CJFDTOTAL-CDLG802.014.htm
    [5] 寇林林, 罗明非, 钟康惠.青海五龙沟金矿矿集区Ⅰ号韧性剪切带40Ar/39Ar年龄及地质意义[J].新疆地质, 2010, 28(3):330~333. http://kns.cnki.net/KCMS/detail/detail.aspx?filename=xjdi201003023&dbname=CJFD&dbcode=CJFQ

    KOU Lin-lin, LUO Ming-fei, ZHONG Kang-hui. 40Ar/39Ar dating of theⅠgold-bearing shear zone on the gold-ore collected belt of the Wulonggou, Qinghai, and its significance[J]. Xinjiang Geology, 2010, 28(3):330~333. http://kns.cnki.net/KCMS/detail/detail.aspx?filename=xjdi201003023&dbname=CJFD&dbcode=CJFQ
    [6] 高香香, 邹林, 高光明, 等.青海五龙沟地区1:5万遥感信息找矿勘查与靶区预测研究[J].矿产与地质, 2005, 19(4):418~421. http://www.cnki.com.cn/Article/CJFDTOTAL-KCYD200504017.htm

    GAO Xiang-xiang, ZOU Lin, GAO Guang-ming, et al. 1/50000 scale remote sensing prospecting and target prediction in Wulonggou area, Qinghai[J]. Mineral Resources and Geology, 2005, 19(4):418~421. http://www.cnki.com.cn/Article/CJFDTOTAL-KCYD200504017.htm
    [7] 刘刚.东昆仑五龙沟金矿围岩蚀变的遥感识别[J].国土资源遥感, 2002, 54(4):60~62. doi: 10.6046/gtzyyg.2002.04.13

    LIU Gang. Remote sensing extraction of alteration information related to the Wulonggou gold deposit, East Kunlun Mountains[J]. Remote Sensing for Land &Resources, 2002, 54(4):60~62. doi: 10.6046/gtzyyg.2002.04.13
    [8] 张廷斌, 钟康惠, 易桂花, 等.东昆仑五龙沟金矿集中区遥感地质信息提取与找矿预测[J].地质与勘探, 2009, 45(4):444~449. http://www.cnki.com.cn/Article/CJFDTOTAL-DZKT200904016.htm

    ZHANG Ting-bin, ZHONG Kang-hui, YI Gui-hua, et al. The extraction of remote sensing geological information and metalllogeneic prediction of gold mineralized concentrate district in Wulonggou, East Kunlun Mountains[J]. Geology and Exploration, 2009, 45(4):444~449. http://www.cnki.com.cn/Article/CJFDTOTAL-DZKT200904016.htm
    [9] 易桂花, 张廷斌, 倪师军, 等.五龙沟金矿集中区化探异常与遥感蚀变异常的综合分析[J].中国矿业, 2010, 19(12):104~106. doi: 10.3969/j.issn.1004-4051.2010.12.031

    YI Gui-hua, ZHANG Ting-bin, NI Shi-jun, et al. Comprehensive analysis of geochemical anomaly and remote sensing alteration of gold mineralized concentrate district in Wulonggou area[J]. China Mining Magazine, 2010, 19(12):104~106. doi: 10.3969/j.issn.1004-4051.2010.12.031
    [10] 邹长毅, 史长义.五龙沟金矿区域地球化学异常特征及找矿标志[J].中国地质, 2004, 31(4):420~423. http://www.cnki.com.cn/Article/CJFDTOTAL-DIZI200404012.htm

    ZOU Chang-yi, SHI Chang-yi. Characteristics of regional geochemical anomalies and ore indications in the Wulonggou gold deposit[J]. Geology in China, 2004, 31(4):420~423. http://www.cnki.com.cn/Article/CJFDTOTAL-DIZI200404012.htm
    [11] 钱壮志, 李厚民, 胡正国, 等.东昆仑中带闪长玢岩脉与金矿成矿关系-以石灰沟金矿床为例[J].西安工程学院学报, 1999, 21(1):1~4. http://www.cnki.com.cn/Article/CJFDTOTAL-XAGX901.000.htm

    QIAN Zhuang-zhi, LI Hou-min, HU Zheng-guo, et al. The relationship between the dioritic porphyrite dikes and the gold mineralization in the middle belt of East Kunlun Mountains[J]. Journal of Xi'an Engineering University, 1999, 21(1):1~4. http://www.cnki.com.cn/Article/CJFDTOTAL-XAGX901.000.htm
    [12] 钱壮志, 李厚民, 胡正国.青海五龙沟地区金矿控矿构造研究[J].西安地质学院学报, 1997, 19(增刊):27~32. http://www.cnki.com.cn/Article/CJFDTOTAL-XAGX1997S1004.htm

    QIAN Zhuang-zhi, LI Hou-min, HU Zheng-guo. Study of structures controlling gold deposits in Wulonggou areas, Qinghai Province[J]. Journal of Xi'an College of Geology, 1997, 19(Supp.):27~32. http://www.cnki.com.cn/Article/CJFDTOTAL-XAGX1997S1004.htm
    [13] 李厚民, 沈远超, 胡正国, 等.青海东昆仑五龙沟金矿成矿条件及成矿机理[J].地质与勘探, 2001, 37(1):65~69. http://www.cnki.com.cn/Article/CJFDTOTAL-DZKT200101014.htm

    LI Hou-min, SHEN Yuan-chao, HU Zheng-guo, et al. Minerogeneticme and condition of Wulonggou gold deposit in East Kunlun Mountains, Qinghai Province[J]. Geology and Prospecting, 2001, 37(1):65~69. http://www.cnki.com.cn/Article/CJFDTOTAL-DZKT200101014.htm
  • 加载中
图(4)
计量
  • 文章访问数:  336
  • HTML全文浏览量:  210
  • PDF下载量:  15
  • 被引次数: 0
出版历程
  • 收稿日期:  2012-03-29
  • 刊出日期:  2012-09-01

目录

/

返回文章
返回