

Evaluation of landslide susceptibility and contribution analysis of key driving factors on the Loess Plateau
-
摘要: 黄土高原滑坡灾害高发,明确滑坡易发区格局及识别关键驱动因子对该区域防灾减灾及重大工程建设具有重要意义。文章以黄土高原滑坡为研究对象,通过多重共线性分析筛选出13个评价因子,构建了极端梯度上升模型(XGBoost)、频率比耦合XGBoost模型(FR−XGBoost)和频率比耦合随机森林(FR−RF)的优化评价模型;从模型可解释性的角度深入探讨了关键驱动因子的作用机制与交互关系。结果表明:耦合模型(FR−XGBoost与FR−RF)预测性能优于单一XGBoost模型,其中FR−XGBoost模型AUC值达0.968,表现最优;年均降雨量、土壤侵蚀性和坡度是影响滑坡发育的关键驱动因子,其对模型的输出贡献占比分别为26.59%、20.80%和14.66%。此外,通过偏依赖图揭示了关键因子之间的非线性交互作用,显示坡度与降雨、土壤特性在特定区间内对滑坡发生具有耦合增强效应。Abstract:
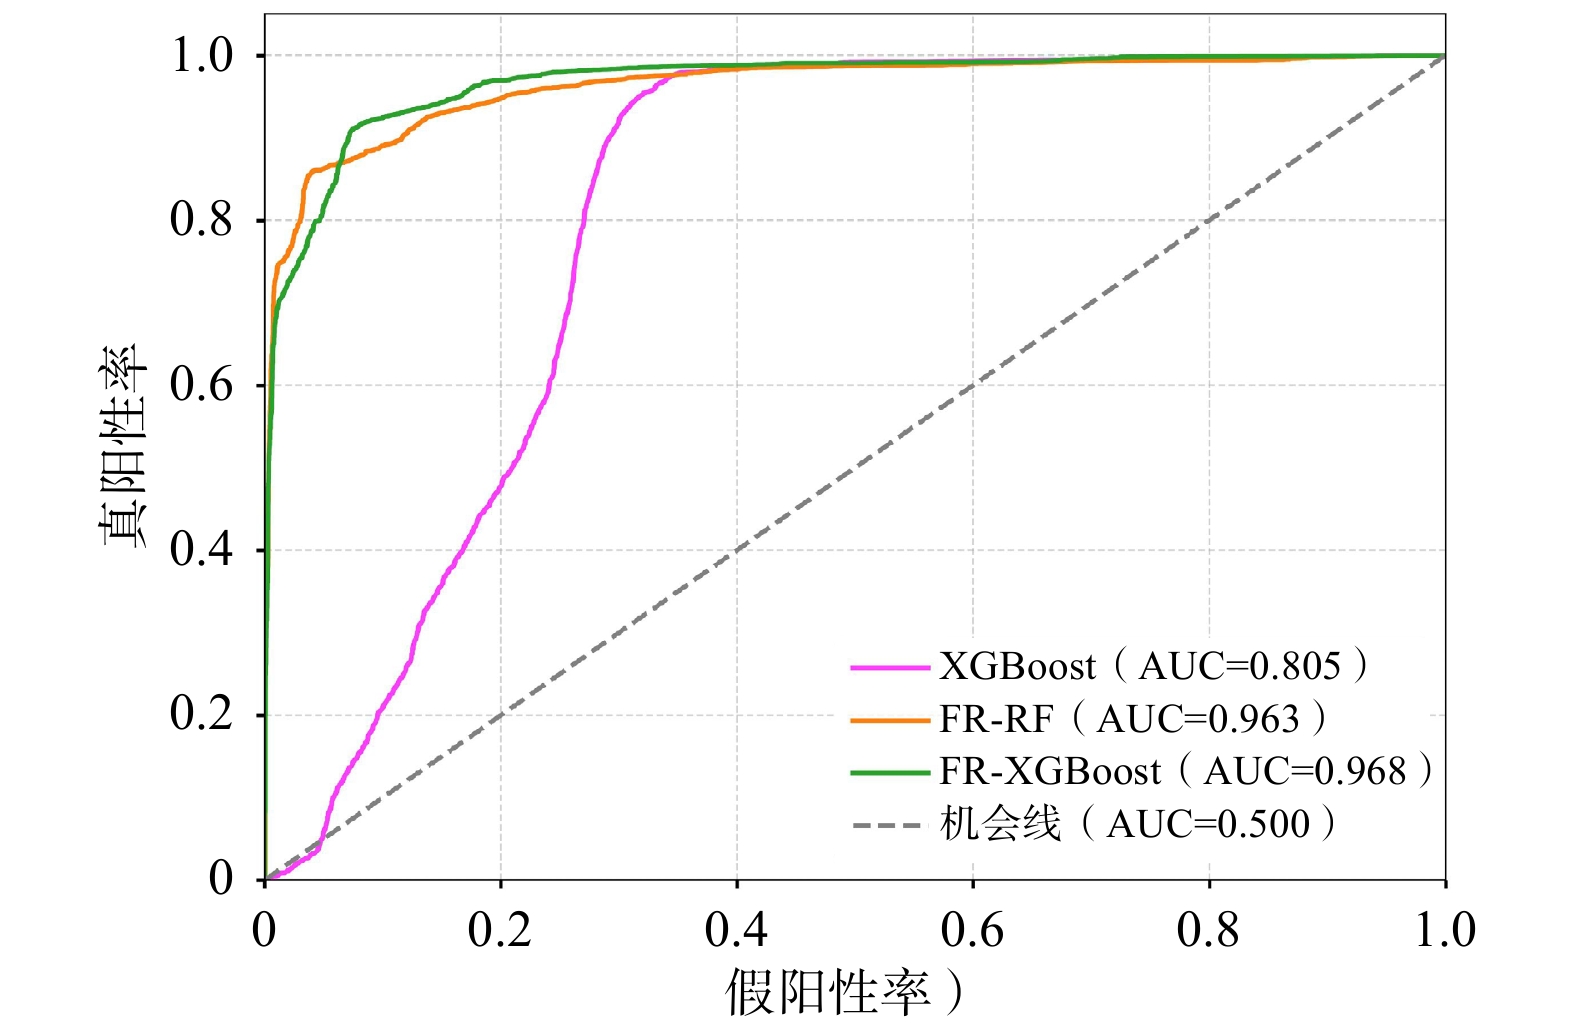
Objective The Loess Plateau is a region critically susceptible to landslides, posing significant risks to human life and infrastructure. Accurate identification of prone areas is vital for disaster mitigation. However, current coupled models often suffer from limitations: they rely on simplistic combinations or default parameters without systematic hyperparameter optimization and fail to achieve deep integration at the feature level, resulting in suboptimal performance and interpretability. This study aims to overcome these shortcomings by developing systematically optimized models and leveraging interpretability tools to elucidate the underlying mechanisms of landslide occurrence. Methods Based on a multicollinearity analysis, thirteen evaluation factors were selected for model construction. We developed three landslide susceptibility models: an extreme gradient boosting (XGBoost) model, a frequency ratio-coupled XGBoost (FR–XGBoost) model, and a frequency ratio-coupled random forest (FR–RF) model. A key advancement in our methodology was the employment of the Optuna framework for the systematic and automated optimization of model hyperparameters to enhance predictive performance. Furthermore, to overcome the “black-box” nature of machine learning models and gain mechanistic insights, we applied shapley additive explanations (SHAP) and partial dependence plots (PDPs) to interpret the models, identify key driving factors, and reveal their interaction effects. Results The results demonstrated significant performance differences among the three models. The coupled models, FR–XGBoost and FR–RF, substantially outperformed the single XGBoost model, with AUC values of 0.968 and 0.963, respectively, compared to 0.805 for the single model. This not only confirms the superior predictive capability achieved by integrating the frequency ratio but also validates the effectiveness of the systematic hyperparameter optimization using the Optuna framework and the selection of evaluation factors. Interpretability analysis using SHAP provided quantitative insights into the factor contributions. Annual average rainfall was identified as the most critical driving factor, with a SHAP contribution value of 26.59%. Soil erodibility and slope gradient followed, contributing 20.80% and 14.66% to the model output, respectively. These three factors collectively dominated the landslide susceptibility pattern in the study area. Further analysis using PDPs revealed the specific functional relationships and interactions between these key factors. The influence of annual average rainfall and soil erodibility on landslide occurrence was predominantly positive and monotonically increasing; their predictive contributions became particularly pronounced above thresholds of approximately 400 mm and 0.04, respectively. Conversely, the relationship between slope gradient and landslide susceptibility was non-monotonic. The effect exhibited a distinct single-peak pattern, where susceptibility increased with slope up to an optimal interval of 5° to 20°, beyond which it gradually decreased. Critically, PDPs revealed significant nonlinear interactions among key driving factors. A distinct synergistic effect was observed under the combined conditions of moderate-low slope gradients (5°–20°), high annual average rainfall (>400 mm), and high soil erodibility (>0.04), defining a characteristic high-risk scenario where landslide probability is substantially amplified. This specific combination pattern provides a quantifiable criterion for identifying the highest-risk areas within the Loess Plateau. We recommend prioritizing enhanced monitoring and engineering interventions in zones where these three factors overlap, and incorporating the established thresholds into local disaster prevention plans as key indicators for early risk identification. Conclusion This study demonstrates that the coupled model achieves higher predictive accuracy than the single model. Annual average rainfall, soil erodibility, and slope gradients were identified as the key driving factors for landslide development in the study area. Furthermore, complex nonlinear interactions exist among these key factors, which significantly influence landslide occurrence. [Significance] This study delivers a high-precision landslide susceptibility map for the Loess Plateau, supporting practical disaster prevention and land-use planning; more profoundly, the interpretability analysis (SHAP and PDP) provides mechanistic insights into landslide initiation, establishing a vital scientific basis for risk management and infrastructure development. -
Key words:
- Loess Plateau /
- Landslide /
- Susceptibility assessment /
- Machine learning /
- Model interpretabili
-
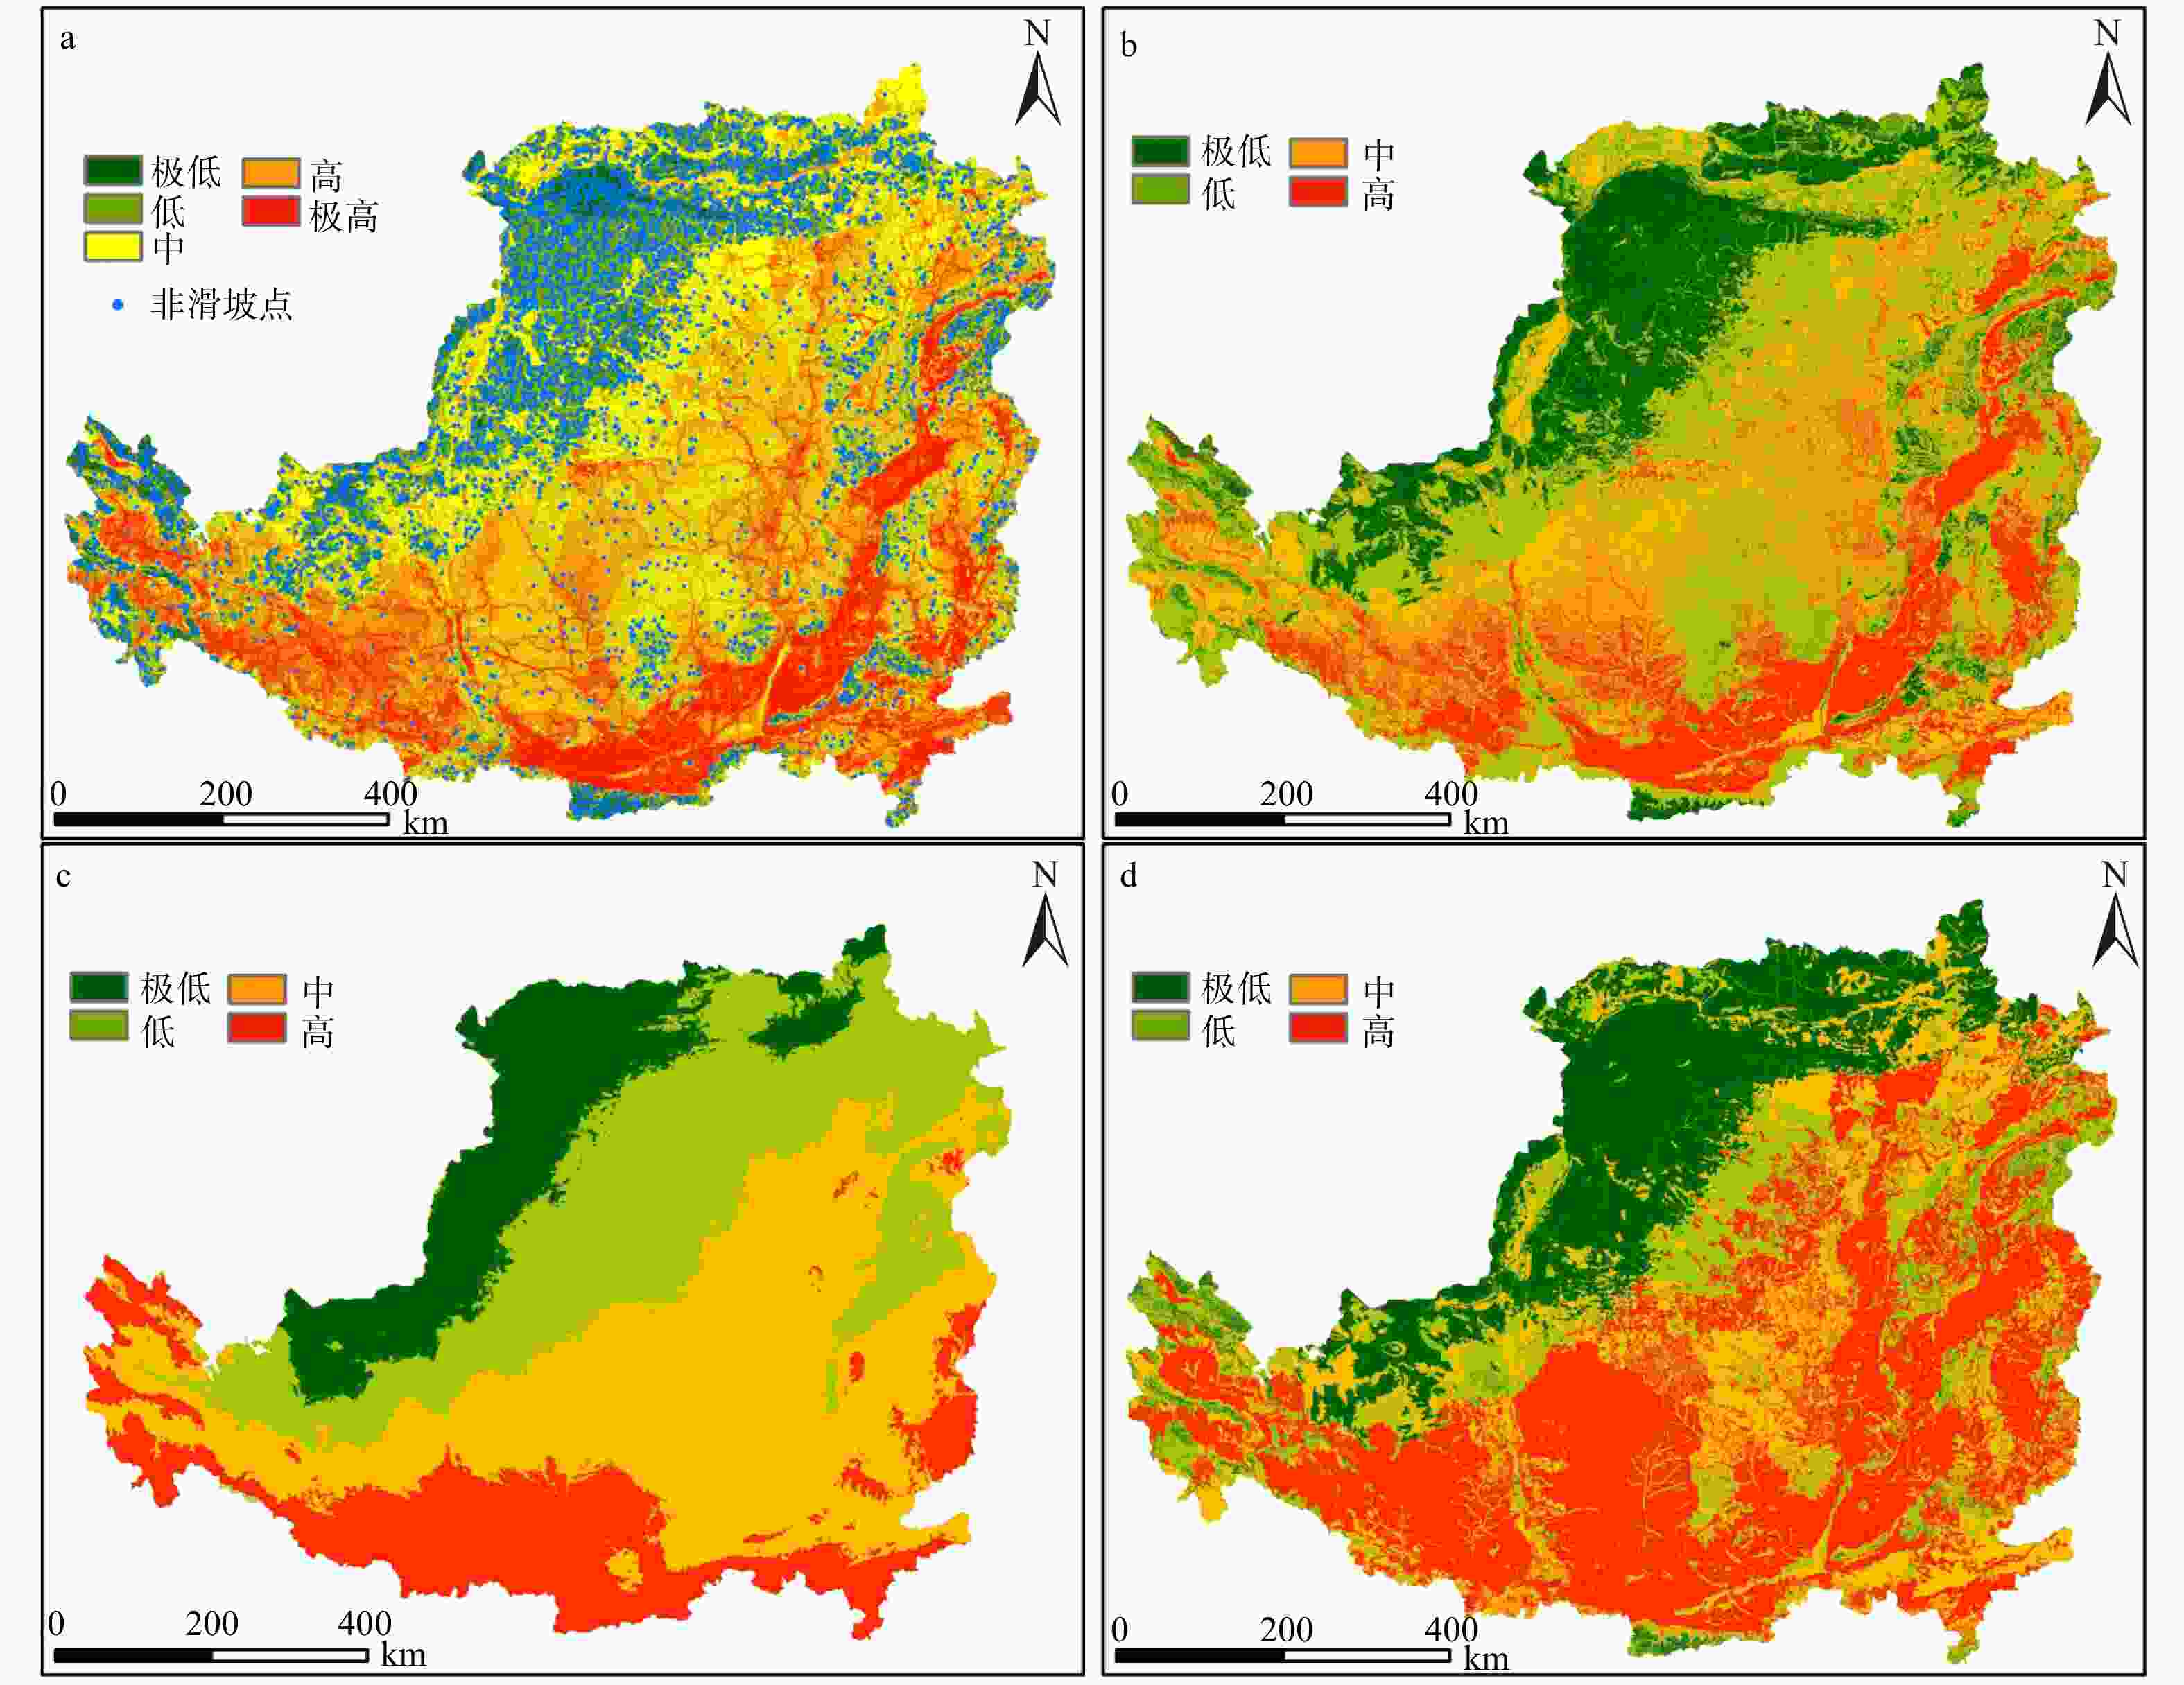
图 4 黄土高原滑坡易发性区划图
a—FR模型;b—FR−RF模型;c—XGBoost模型;d—FR−XGBoost模型
Figure 4. Landslide Susceptibility Zoning Map of the Study Area
(a) FR model; (b) FR–RF model; (c) XGBoost model; (d) FR–XGBoost model
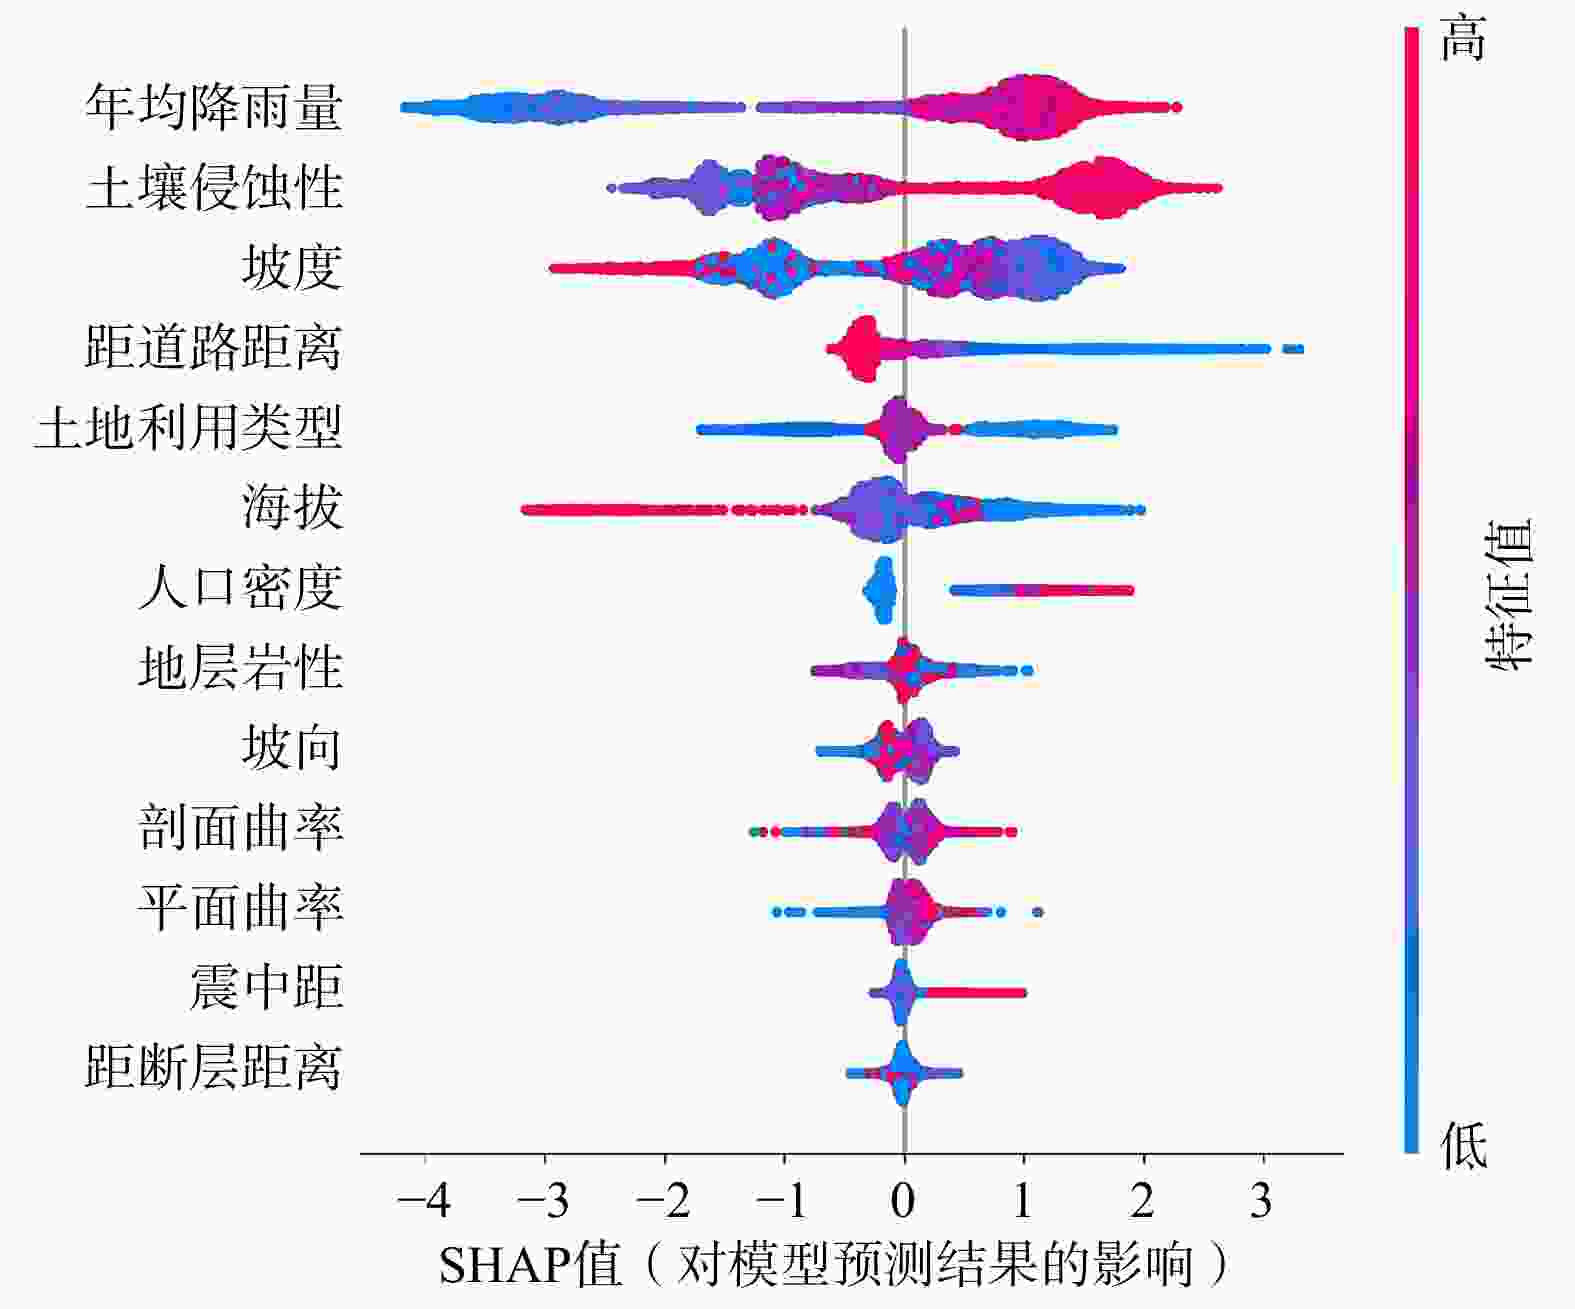
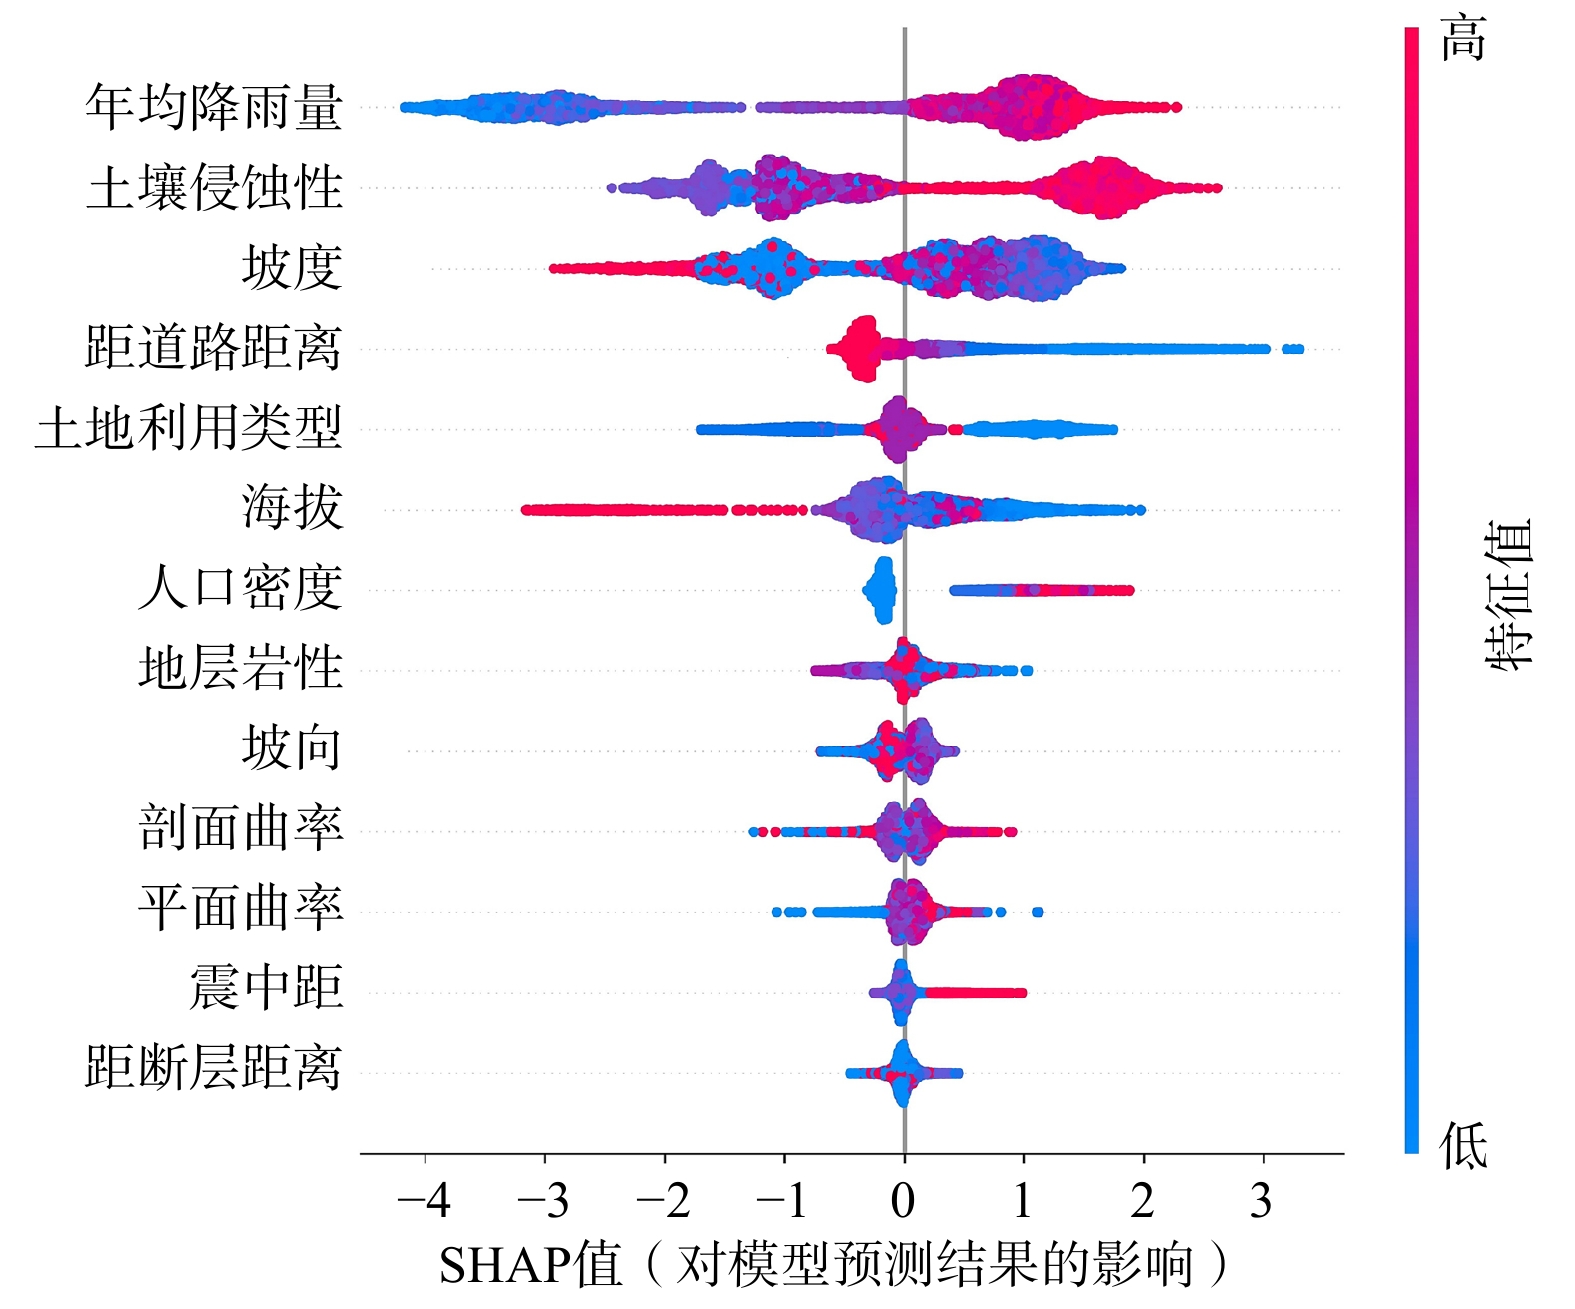
图 6 评价因子对XGBoost模型输出的影响分布图
Figure 6. Distribution of feature impacts on XGBoost model output
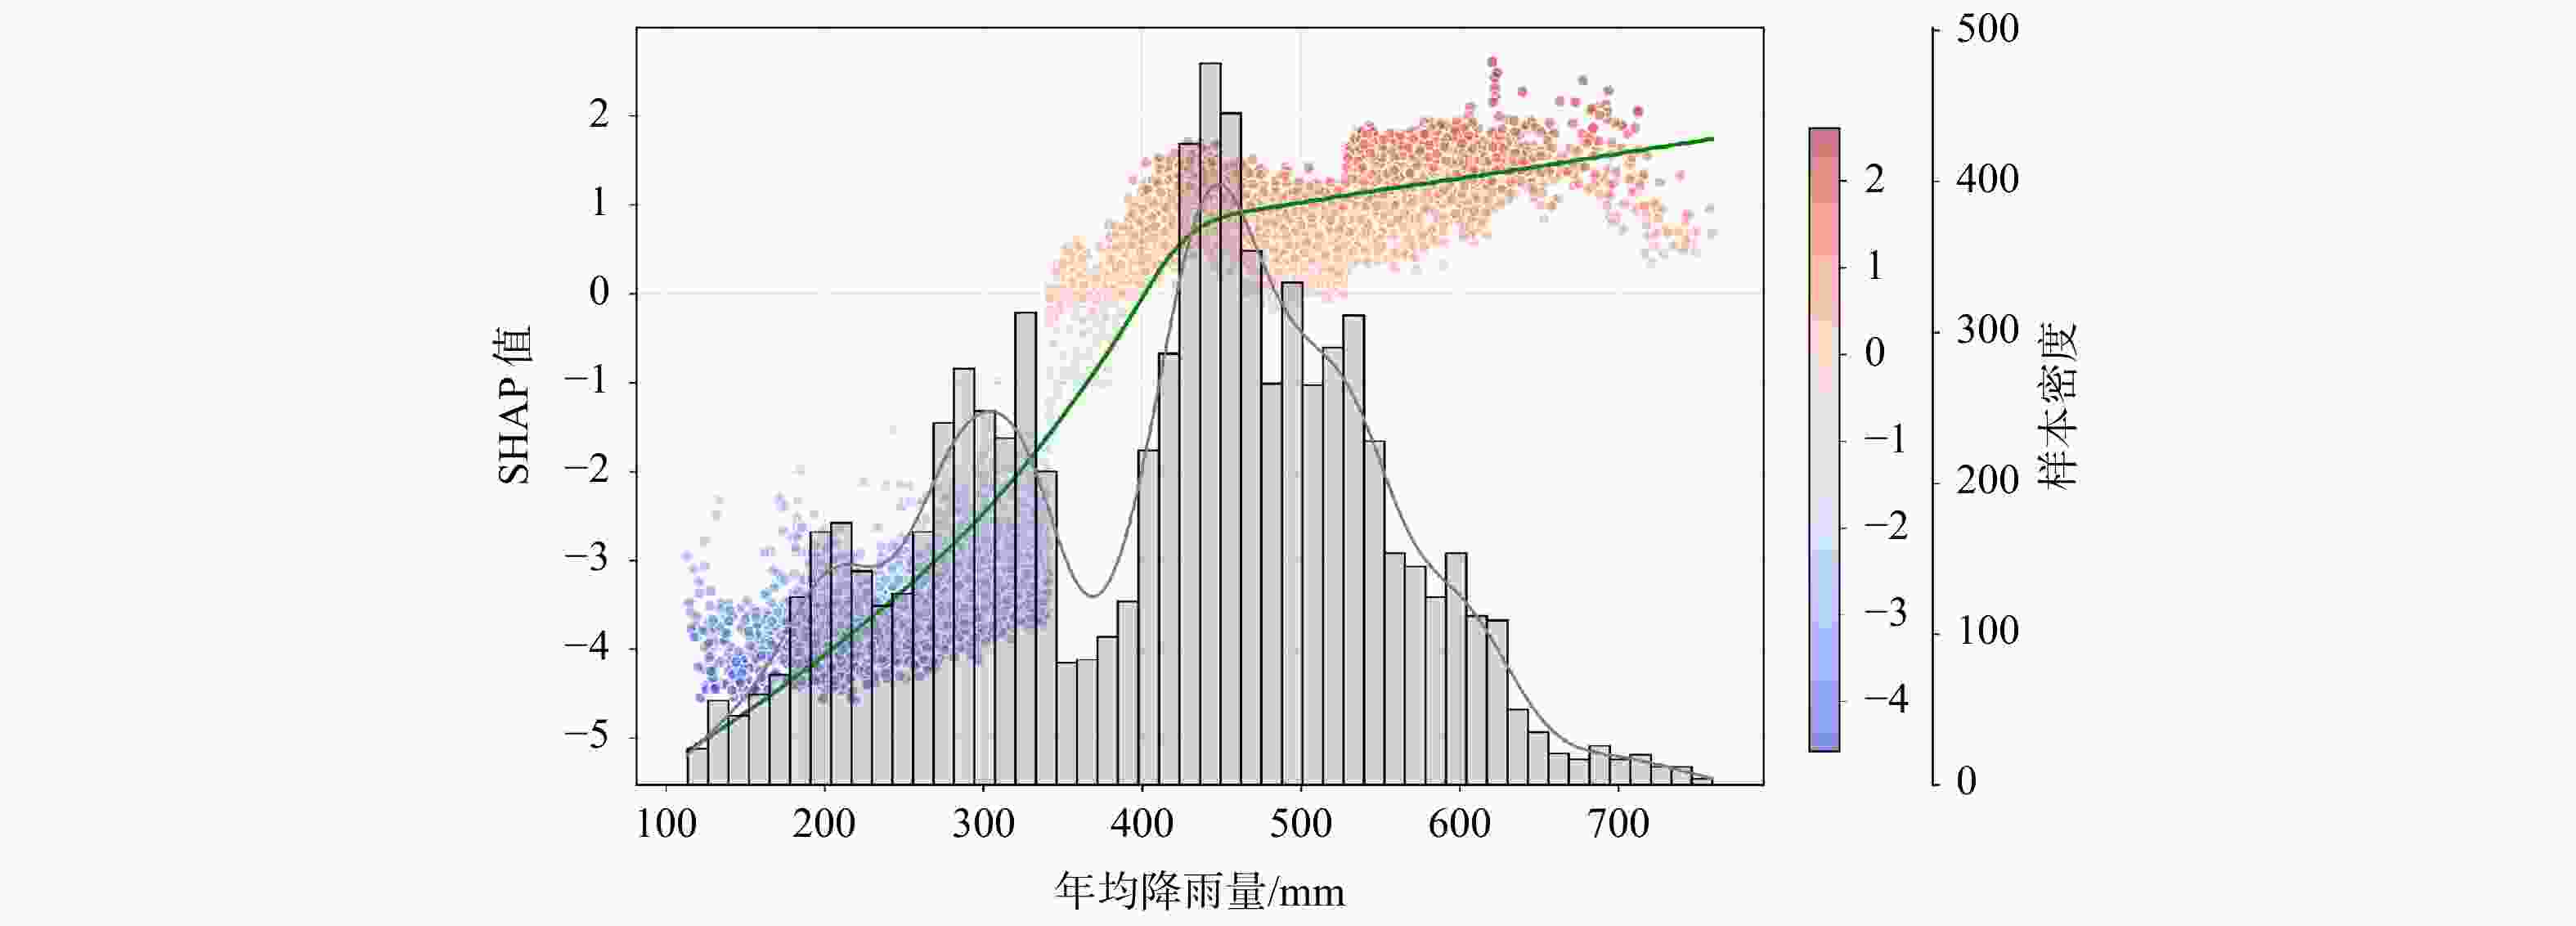
图 7 年均降雨量SHAP分布特征
散点颜色表示SHAP值的正负(红色为正影响,蓝色为负影响),散点纵坐标对应左侧SHAP值轴;绿色曲线为局部加权回归平滑线,揭示年均降雨量对模型预测的非线性影响模式;灰色直方图及灰色核密度曲线表示年均降雨量的样本分布密度,对应右侧样本密度轴
Figure 7. Distribution characteristics of SHAP values for annual average rainfall
The scatter point colors represent the sign and magnitude of SHAP values (red indicates positive influence, blue indicates negative influence), with the vertical coordinates corresponding to the left SHAP value axis. The green curve shows the locally weighted regression smoothing line, revealing the nonlinear influence pattern of annual average rainfall on model predictions; the gray histogram and gray kernel density curve represent the sample distribution density of annual average rainfall, corresponding to the right sample density axis.
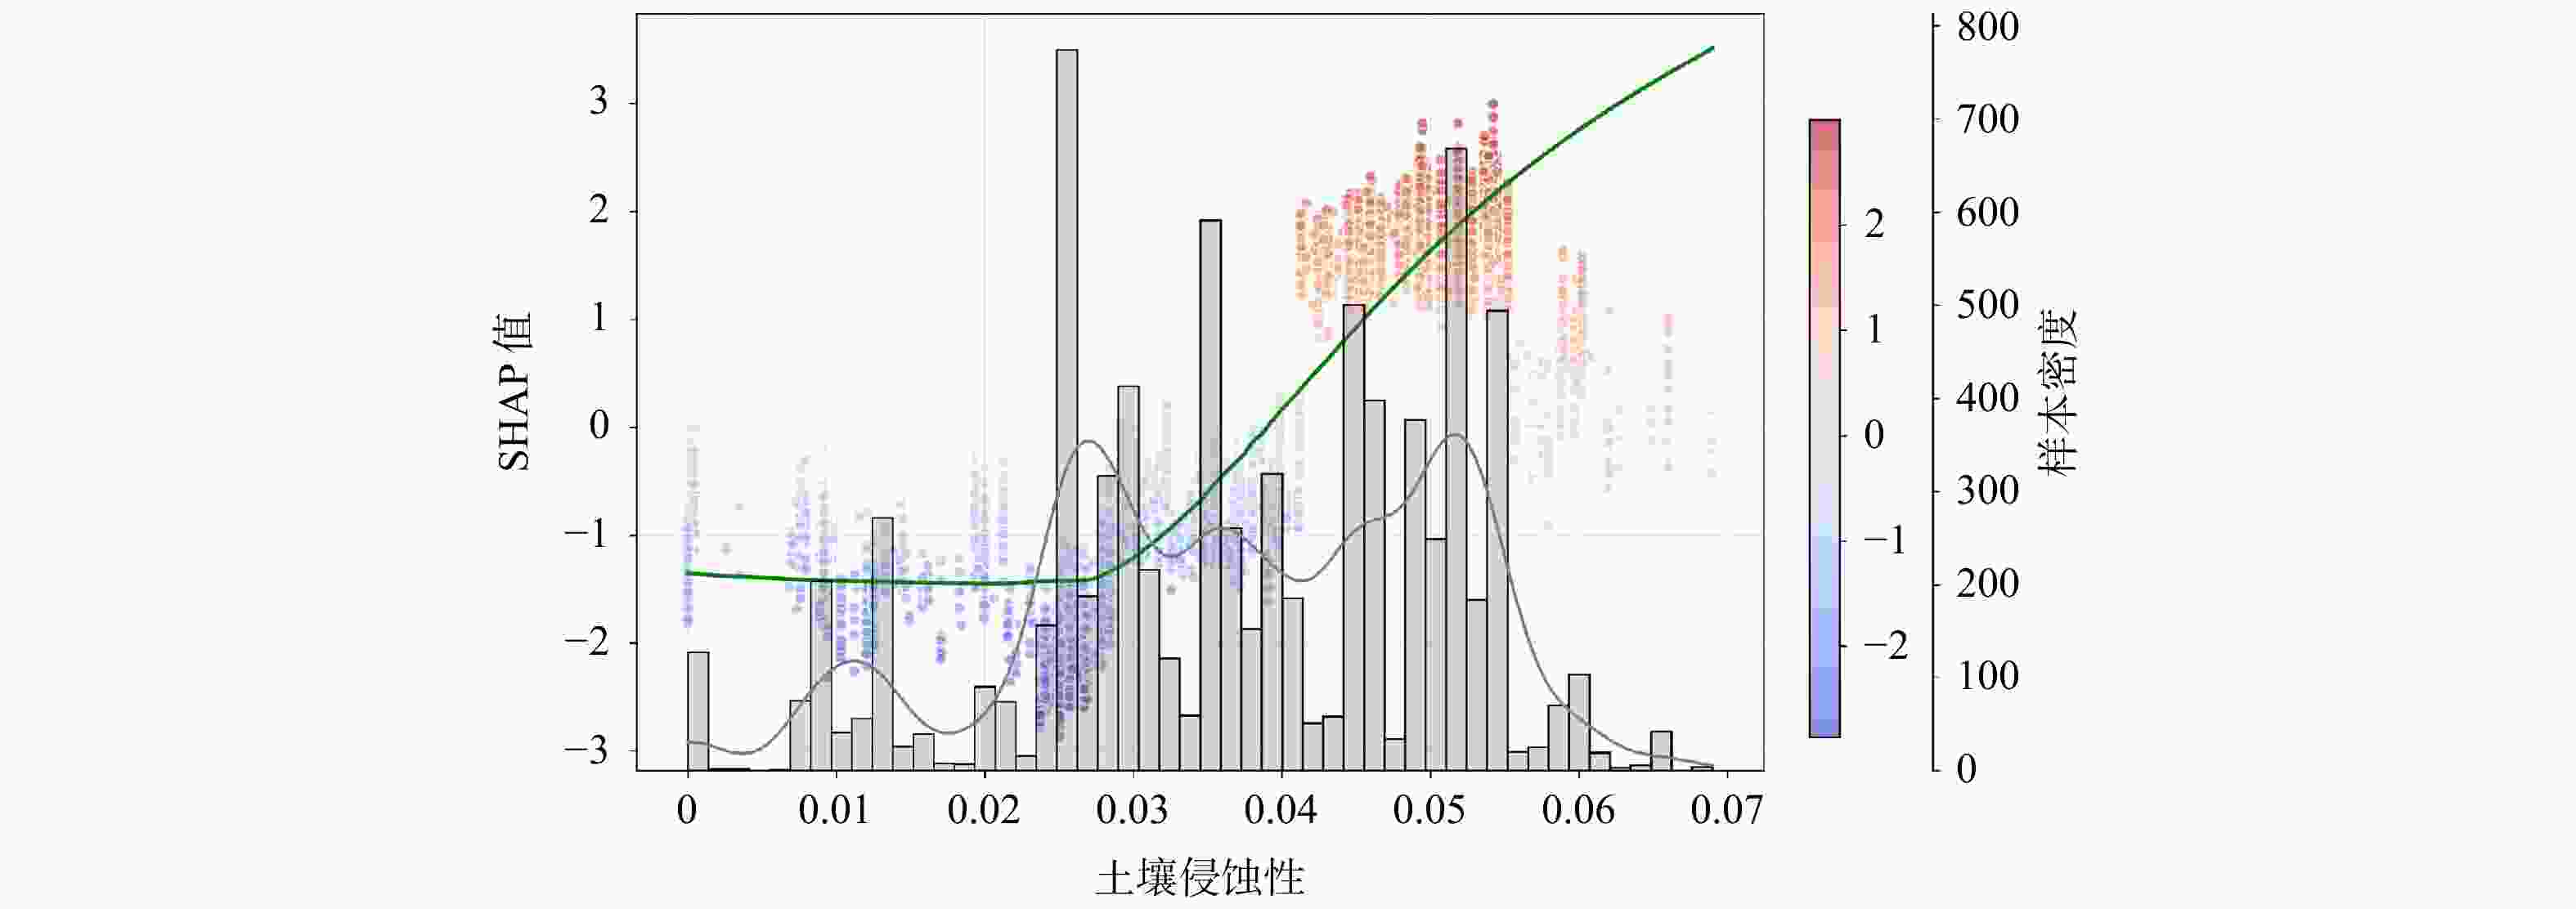
图 8 土壤侵蚀性SHAP分布特征
散点颜色表示SHAP值的正负(红色为正影响,蓝色为负影响),散点纵坐标对应左侧SHAP值轴;绿色曲线为局部加权回归平滑线,揭示土壤侵蚀性对模型预测的非线性影响模式;灰色直方图及灰色核密度曲线表示土壤侵蚀性的样本分布密度,对应右侧样本密度轴
Figure 8. Distribution characteristics of SHAP values for soil erodibility
The scatter point colors represent the sign and magnitude of SHAP values (red indicates positive influence, blue indicates negative influence), with the vertical coordinates corresponding to the left SHAP value axis. The green curve shows the locally weighted regression smoothing line, revealing the nonlinear influence pattern of soil erodibility on model predictions; the gray histogram and gray kernel density curve represent the sample distribution density of soil erodibility, corresponding to the right sample density axis.
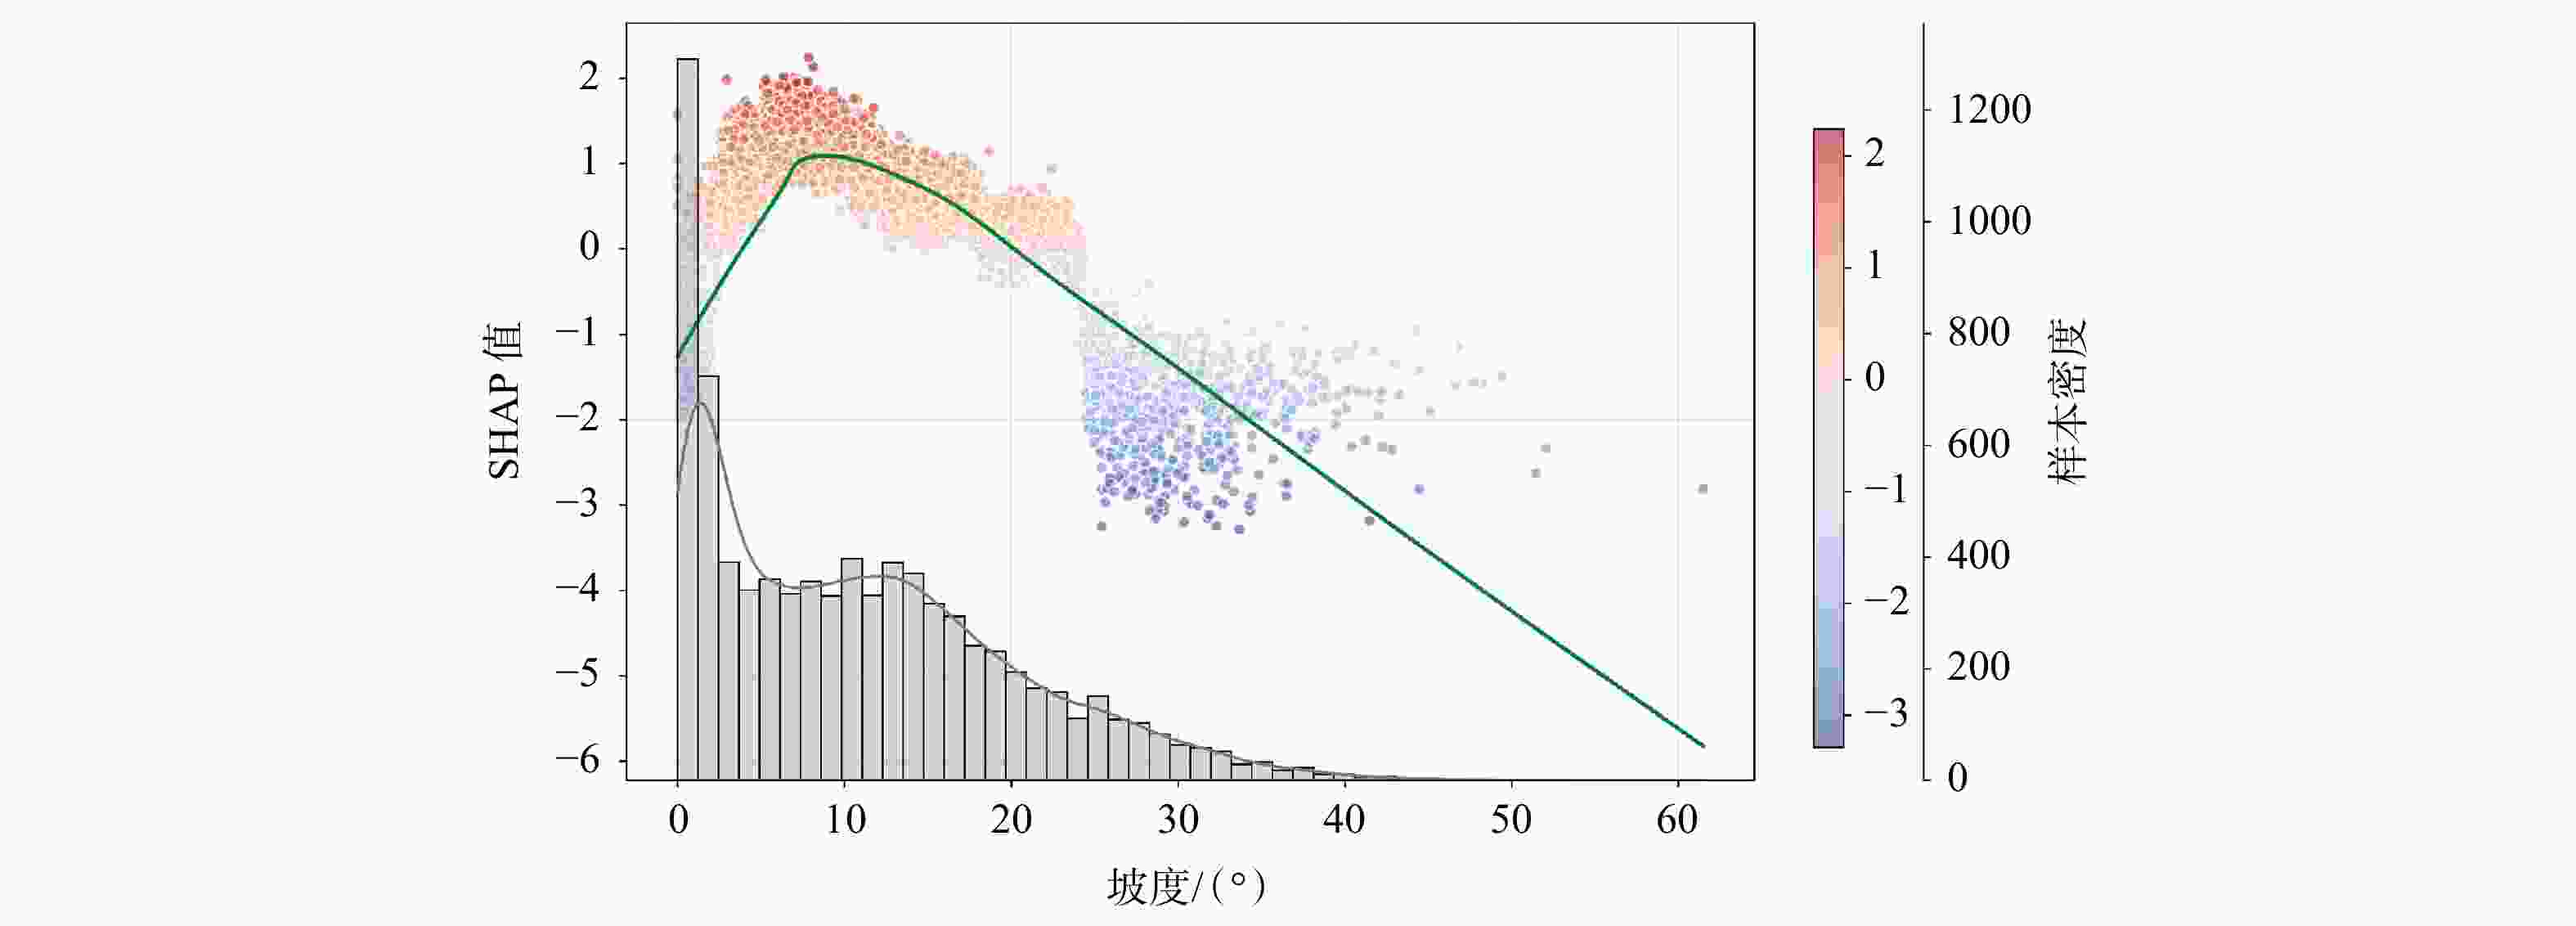
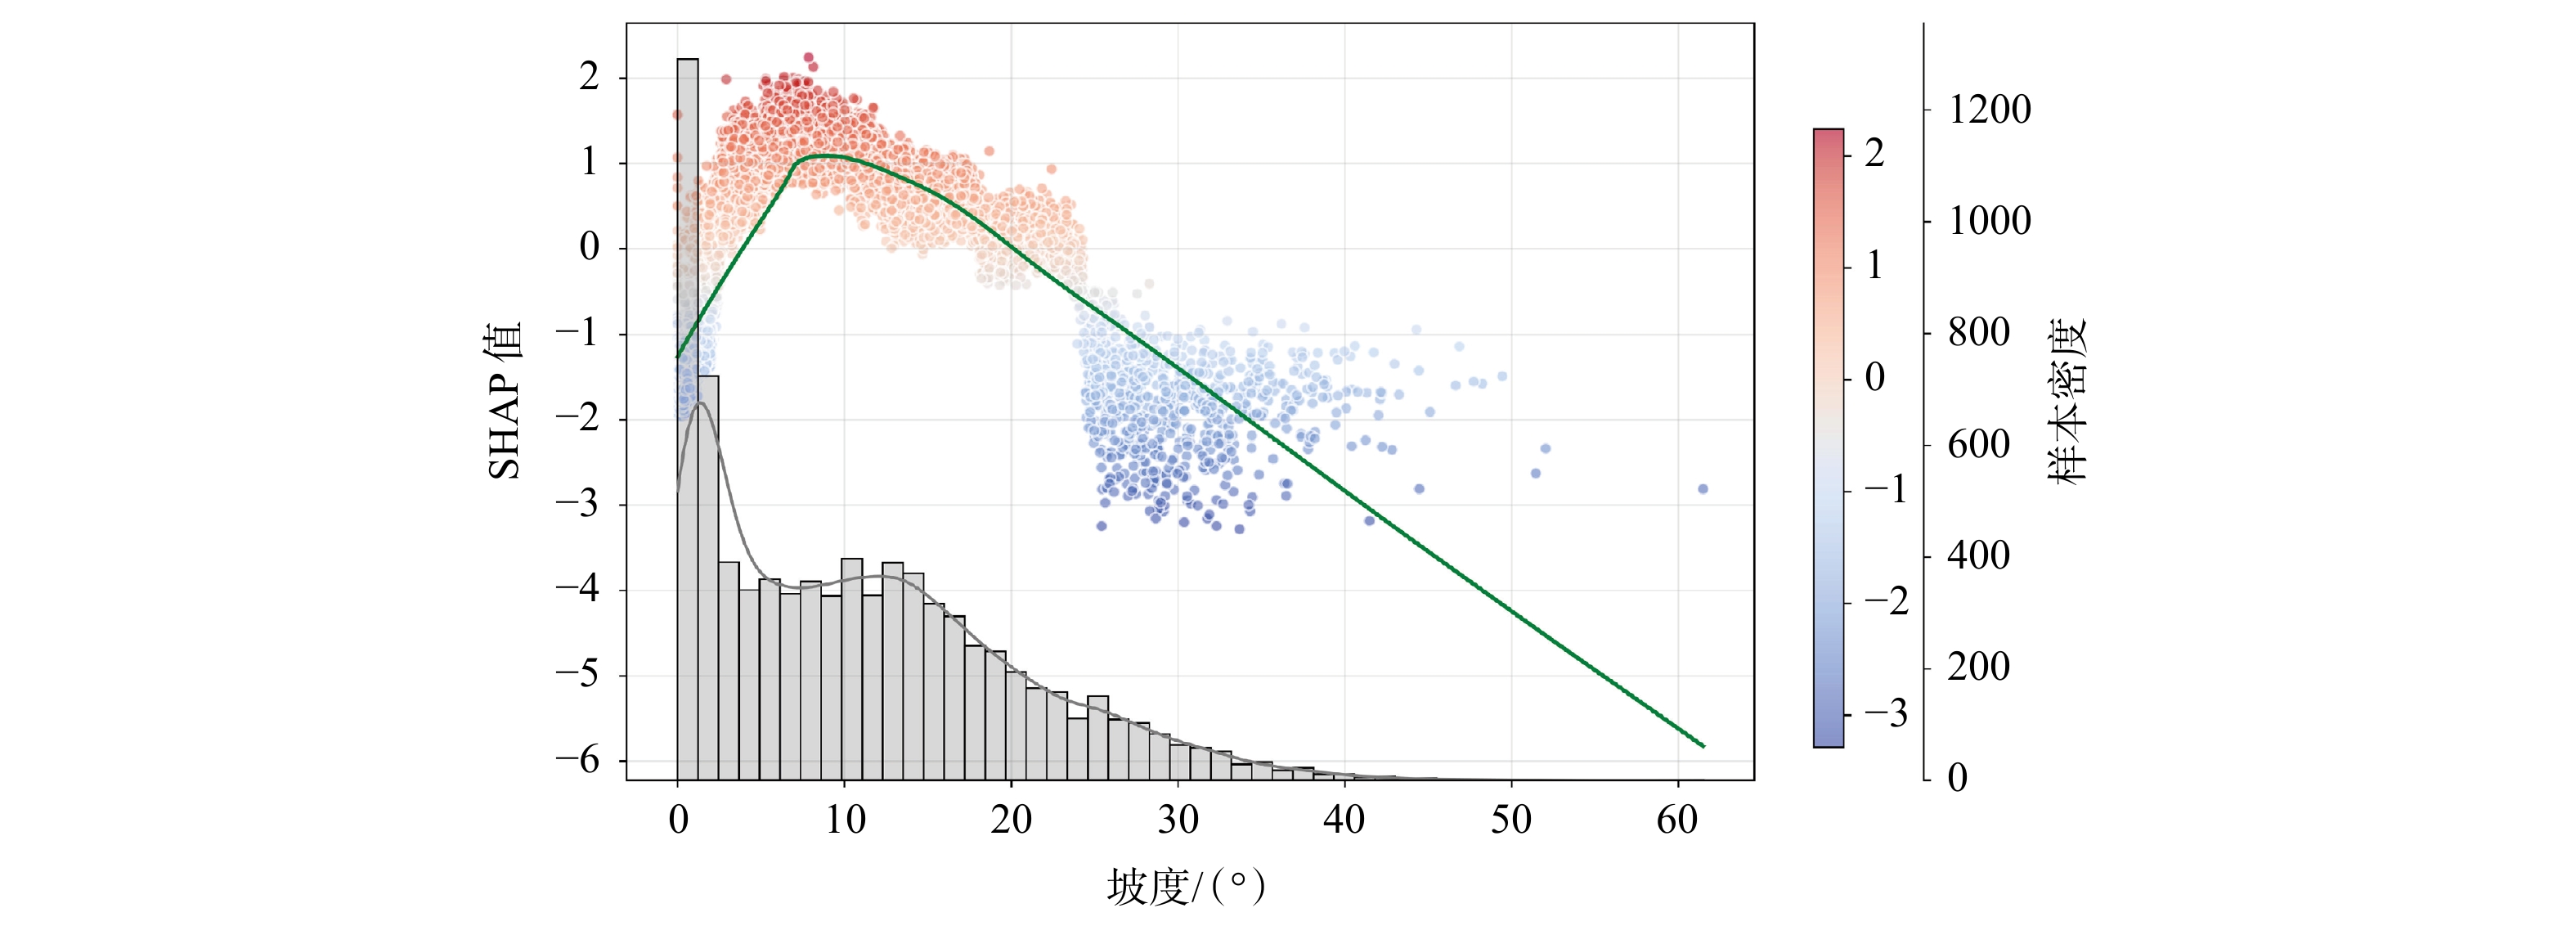
图 9 坡度SHAP分布特征
散点颜色表示SHAP值的正负(红色为正影响,蓝色为负影响),散点纵坐标对应左侧SHAP值轴;绿色曲线为局部加权回归平滑线,揭示坡度对模型预测的非线性影响模式;灰色直方图及灰色核密度曲线表示坡度的样本分布密度,对应右侧样本密度轴
Figure 9. Distribution characteristics of SHAP values for slope gradient
The scatter point colors represent the sign and magnitude of SHAP values (red indicates positive influence, blue indicates negative influence), with the vertical coordinates corresponding to the left SHAP value axis. The green curve shows the locally weighted regression smoothing line, revealing the nonlinear influence pattern of slope gradient on model predictions; the gray histogram and gray kernel density curve represent the sample distribution density of slope gradient, corresponding to the right sample density axis.
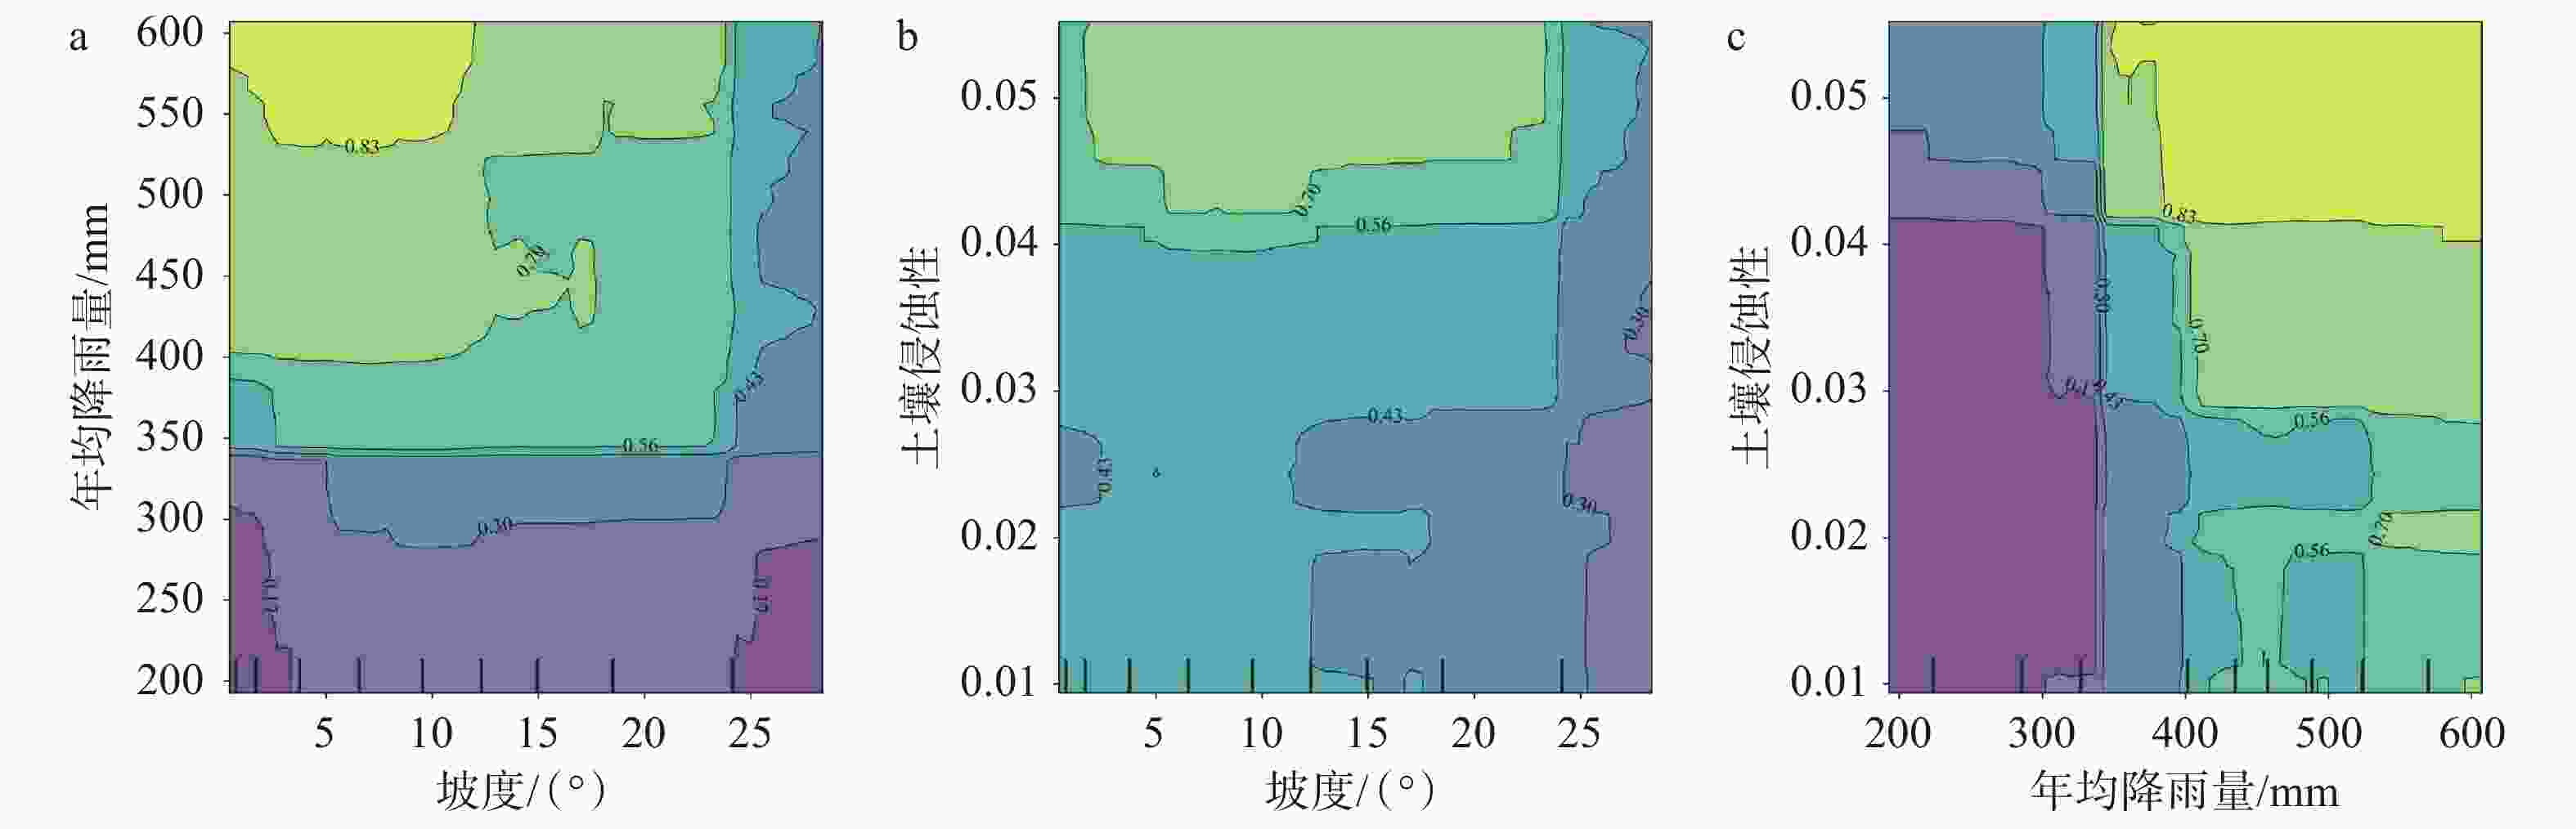
图 10 关键驱动因子的偏依赖特征
a—坡度与年均降雨量的交互效应;b—坡度与土壤侵蚀性的交互效应;c—年均降雨量与土壤侵蚀性的交互效应
Figure 10. Partial dependence characteristics of key driving factors
(a) Interaction effect between slope gradient and annual average rainfall; (b) Interaction effect between slope gradient and soil erodibility; (c) Interaction effect between annual average rainfall and soil erodibility
表 1 多重共线性分析
Table 1. Multicollinearity analysis
影响因子 TOL VIF 距断层距离 0.901 1.110 距道路距离 0.893 1.120 地层岩性 0.905 1.104 NDVI 0.499 2.003 震中距 0.837 1.194 人口密度 0.934 1.071 土壤侵蚀性 0.924 1.082 土地利用类型 0.782 1.279 平面曲率 0.728 1.373 剖面曲率 0.725 1.380 年均降雨量 0.557 1.795 坡向 0.998 1.002 坡度 0.748 1.336 高程 0.763 1.310  下载: 导出CSV
表 2 优化后的关键参数
Table 2. Optimized key parameters
超参数 说明 XGBoost FR−XGBoost FR−RF n_estimators 决策树数量 300 300 352 max_depth 最大树深度 11 13 15 learning_rate 学习率 0.063 0.222 — subsample 样本采样比例 0.963 0.659 — colsample_bytree 特征采样比例 0.6025 0.812 — gamma 节点分裂最小损失下降 1.3150 0.354 — min_samples_split 节点分裂最小样本数 — — 9 min_samples_leaf 叶节点最小样本数 — — 1 max_features 特征选择策略 — — log2
下载: 导出CSV
表 3 评价因子频率比值
Table 3. Frequency ratio of evaluation factors
评价因子 属性区间 滑坡占比/% 分类面积占比/% FR值 NFR值 海拔/m 85~939 20.29 14.05 1.44 30 939~1793 56.96 68.17 0.84 17 1793~2647 19.07 13.28 1.44 29 2647~3500 3.68 3.18 1.16 24 3500~4354 0.00 1.27 0.00 0 4354~5208 0.00 0.06 0.00 0 坡度/(°) 0~12 53.91 17.14 3.14 54 12~24 40.54 17.68 2.29 40 24~36 5.02 15.93 0.32 5 36 ~48 0.52 17.16 0.03 1 48~61 0.00 16.89 0.00 0 61~74 0.00 15.20 0.00 0 坡向/(°) −1~60 13.89 17.14 0.81 14 60~120 18.79 17.68 1.06 18 120~180 18.77 15.93 1.18 20 180~240 18.18 17.16 1.06 18 240~300 17.17 16.89 1.02 17 300~360 13.20 15.20 0.87 14 年均降雨量/mm 108.7~225 0.21 7.93 0.03 0 225~341.3 2.42 20.04 0.12 2 341.3~457.7 40.61 32.92 1.23 21 457.6~573.9 42.28 32.11 1.32 22 573.9~690.2 13.98 6.56 2.13 36 690.2~806.6 0.49 0.44 1.10 19 剖面曲率 −7.967~−5.420 0.00 0.00 0.00 0 −5.420 ~−2.874 0.00 0.00 0.00 0 −2.874~−0.327 6.74 5.56 1.21 10 −0.328~2.218 93.24 94.44 0.99 8 2.218~4.765 0.02 0.00 9.79 82 4.765~7.311 0.00 0.00 0.00 0 平面曲率 −5.526 ~−3.099 0.00 0.00 0.00 0 −3.099~−0.673 0.75 0.69 1.08 52 −0.673~1.753 99.25 99.30 1.00 48 1.753~4.180 0.00 0.00 0.00 0 4.180~6.606 0.00 0.00 0.00 0 6.606~9.032 0.00 0.00 0.00 0 人口密度/人 0~202 99.43 99.79 1.00 8 202~405 0.40 0.16 2.55 21 405~607 0.14 0.05 2.77 23 607~809 0.03 0.01 5.84 48 809~1012 0.00 0.00 0.00 0 1012~1214 0.00 0.00 0.00 0 土壤侵蚀性 0~0.014 2.51 6.54 0.38 9 0.014 ~0.028 4.40 13.05 0.34 8 0.028~0.041 19.90 29.20 0.68 16 0.041~0.055 65.36 43.76 1.49 34 0.055~0.069 7.80 7.38 1.06 24 0.069~0.083 0.03 0.08 0.44 10 地层岩性 新近系泥岩、砂岩 10.41 5.09 2.05 13 二叠系砂岩、粉砂岩 6.39 4.71 1.36 9 白垩系碎屑岩、泥岩 8.65 8.53 1.01 6 三叠系泥岩、砂岩 9.33 7.78 1.20 8 侏罗系砂砾岩、砂岩 3.05 2.37 1.29 8 太古宙麻粒岩、片麻岩 2.12 4.50 0.47 3 奥陶系砂岩、白云岩 2.86 4.52 0.63 4 石炭系砂岩、页岩 7.33 3.75 1.95 12 震旦系砾岩、石英砂岩 0.00 0.02 0.00 0 寒武系砂岩、灰岩 0.96 3.00 0.32 2 水体 0.05 0.17 0.31 2 泥盆系砂岩、粉砂岩 0.52 0.69 0.76 5 花岗岩脉、闪长玢岩脉 0.00 0.00 0.00 0 古近系泥岩、砂岩 6.63 2.07 3.20 20 志留系板岩、浅变质砂岩 0.24 0.57 0.43 3 冰川 0.00 0.01 0.00 0 第四系黄土、粉砂 41.45 52.22 0.79 5 震中距/km 0~3 0.66 1.06 0.62 8 3~6 2.02 2.67 0.76 10 6~9 4.44 5.16 0.86 11 9~15 6.84 7.81 0.88 11 15~30 25.12 24.46 1.03 13 30~50 22.79 24.83 0.92 12 50~100 27.73 27.79 1.00 13 >100 10.39 6.21 1.67 22 土地利用类型 农田 42.61 29.55 1.44 15 森林 9.23 14.84 0.62 6 灌木 0.02 0.29 0.06 1 草地 44.13 49.03 0.90 9 水体 0.00 0.47 0.00 0 雪/冰 0.14 0.03 5.46 56 荒地 0.26 2.67 0.10 1 不透水面 3.62 3.11 1.16 12 湿地 0.00 0.00 0.00 0 距断层距离/km 0~3 6.84 4.79 1.43 23 3~6 5.71 4.85 1.18 19 6~9 5.21 4.78 1.09 17 9~15 7.28 8.96 0.81 13 15~30 13.81 17.04 0.81 13 >30 61.16 59.58 1.03 16 距道路距离/km 0~0.5 17.82 8.14 2.19 27 0.5~1 8.89 6.53 1.36 17 1~2 12.30 10.83 1.14 14 2~3 8.62 8.97 0.96 12 3~4 7.28 7.73 0.94 11 4~5 6.03 6.77 0.89 11 >5 39.06 51.03 0.77 9
下载: 导出CSV
表 4 评价因子相对权重
Table 4. Relative weight of evaluation factors
评价因子 XGboost FR−XGBoost FR−RF 距道路距离 0.0750 0.0751 0.0733 地层岩性 0.0266 0.0435 0.0767 距断层距离 0.0091 0.0114 0.0235 震中距 0.0100 0.0129 0.0335 人口密度 0.0538 0.0000 0.0002 土壤侵蚀性 0.2080 0.3105 0.2645 土地利用类型 0.0738 0.0829 0.0987 平面曲率 0.0172 0.0011 0.0022 剖面曲率 0.0222 0.0013 0.0075 年均降雨量 0.2659 0.3171 0.2728 坡向 0.0222 0.0237 0.0267 坡度 0.1466 0.0768 0.0552 海拔 0.0695 0.0438 0.0651
下载: 导出CSV
-
[1] CHAI H X, CHENG W M, QIAO Y L, 2006. Classification system of 1: 1 000 000 digital loess geomorphology in China[J]. Journal of Geo-information Science, 8(2): 6-13. (in Chinese with English abstract) [2] CHEN D L, AN X L, SHAO H Y, et al., 2025. Quantitative assessment of landslide hazard susceptibility and key driving factors in Loess Plateau geomorphologic area[J]. Journal of Beijing Normal University (Natural Science), 61(2): 255-267. (in Chinese with English abstract) [3] CHEN T Q, GUESTRIN C, 2016. XGBoost: a scalable tree boosting system[C]//Proceedings of the 22nd ACM SIGKDD international conference on knowledge discovery and data mining. San Francisco: ACM: 785-794. [4] DONG J W, ZHOU Y, YOU N S, et al. , 2021. A 30-m annual maximum NDVI dataset in China from 2000 to 2022 [DS/OL]. National Ecosystem Science Data Center. [5] DOU J, XIANG Z L, XU Q, et al., 2023. Application and development trend of machine learning in landslide intelligent disaster prevention and mitigation[J]. Earth Science, 48(5): 1657-1674. (in Chinese with English abstract) [6] FU X P, WANG M, ZHANG D Q, et al., 2025. An XGBoost-SHAP framework for identifying key drivers of urban flooding and developing targeted mitigation strategies[J]. Ecological Indicators, 175: 113579. doi: 10.1016/j.ecolind.2025.113579 [7] HONG H Y, POURGHASEMI H R, POURTAGHI Z S, 2016. Landslide susceptibility assessment in Lianhua County (China): a comparison between a random forest data mining technique and bivariate and multivariate statistical models[J]. Geomorphology, 259: 105-118. doi: 10.1016/j.geomorph.2016.02.012 [8] HUSSAIN M A, CHEN Z L, ZHOU Y L, et al., 2025. Landslide susceptibility mapping using artificial intelligence models: a case study in the Himalayas[J]. Landslides, 22(6): 2089-2103. doi: 10.1007/s10346-025-02466-2 [9] KE C Y, HE S, QIN Y G, 2023. Comparison of natural breaks method and frequency ratio dividing attribute intervals for landslide susceptibility mapping[J]. Bulletin of Engineering Geology and the Environment, 82(10): 384. doi: 10.1007/s10064-023-03392-0 [10] KE C Y, SUN P, ZHANG S, et al., 2025. Influences of non-landslide sampling strategies on landslide susceptibility mapping: a case of Tianshui city, Northwest of China[J]. Bulletin of Engineering Geology and the Environment, 84(3): 123. doi: 10.1007/s10064-025-04147-9 [11] LI M, HE H, WU D L, et al., 2025. The spatial-temporal evolution of soil erosion in the Loess Plateau under the context of climate change[J]. Acta Ecologica Sinica, 45(16): 7793-7807. (in Chinese with English abstract) [12] LI T L, WANG C Y, LI P, 2013. Loess deposit and loess landslides on the Chinese loess plateau[M]//WANG F W, MIYAJIMA M, LI T L, et al. Progress of geo-disaster mitigation technology in Asia. Berlin Heidelberg: Springer: 235-261. [13] LIU J, LI S L, CHEN T, 2018. Landslide susceptibility assesment based on optimized random forest model[J]. Geomatics and Information Science of Wuhan University, 43(7): 1085-1091. (in Chinese with English abstract) [14] LIU T S, 1985. Loess and the environment[M]. Beijing: Science Press. (in Chinese) [15] LUNDBERG S M, LEE S I, 2017. A unified approach to interpreting model predictions[C]//Proceedings of the 31st international conference on neural information processing systems. Long Beach: Curran Associates Inc. : 4768-4777. [16] LV L, CHEN T, LIU G, et al., 2025. A comparative study of model interpretability considering the decision differentiation of landslide susceptibility models[J]. IEEE Transactions on Geoscience and Remote Sensing, 63: 4401218. [17] NAN S H, LI J J, WEI J F, et al., 2025. Driving and synergistic effects of water quality indexes on dissolved oxygen in basin based on XGBoost-SHAP model[J]. Water Resources and Power, 43(7): 52-56. (in Chinese with English abstract) [18] PENG J B, LIN H C, WANG Q Y, et al., 2014. The critical issues and creative concepts in mitigation research of loess geological hazards[J]. Journal of Engineering Geology, 22(4): 684-691. (in Chinese with English abstract) [19] PENG J B, WANG Q Y, ZHUANG J Q, et al., 2020. Dynamic formation mechanism of landslide disaster on the Loess Plateau[J]. Journal of Geomechanics, 26(5): 714-730. (in Chinese with English abstract) [20] PRADHAN B, DIKSHIT A, LEE S, et al., 2023. An explainable AI (XAI) model for landslide susceptibility modeling[J]. Applied Soft Computing, 142: 110324. doi: 10.1016/j.asoc.2023.110324 [21] QIN Y G, YANG G L, LU K P, et al., 2021. Performance evaluation of five GIS-based models for landslide susceptibility prediction and mapping: a case study of Kaiyang County, China[J]. Sustainability, 13(11): 6441. doi: 10.3390/su13116441 [22] REICHENBACH P, ROSSI M, MALAMUD B D, et al., 2018. A review of statistically-based landslide susceptibility models[J]. Earth-Science Reviews, 180: 60-91. doi: 10.1016/j.earscirev.2018.03.001 [23] TONG B, YIN Y P, LI B, et al., 2025. Review on artificial intelligence-based large language models for geological hazards[J]. The Chinese Journal of Geological Hazard and Control, 36(2): 1-12. (in Chinese with English abstract) [24] WANG H G, HU M T, LIU X C, 2025. Reconstruction and interpretability analysis of China's food security level based on machine learning and SHAP algorithm[J]. Journal of China Agricultural University, 30(7): 264-274. (in Chinese with English abstract) [25] WANG H J, SUN P, ZHANG S, et al., 2020. Rainfall-induced landslide in loess area, Northwest China: a case study of the Changhe landslide on September 14, 2019, in Gansu Province[J]. Landslides, 17(9): 2145-2160. doi: 10.1007/s10346-020-01460-0 [26] WANG H J, SUN P, ZHANG S, et al., 2022. Evolutionary and dynamic processes of the Zhongzhai landslide reactivated on October 5, 2021, in Niangniangba, Gansu Province, China[J]. Landslides, 19(12): 2983-2996. doi: 10.1007/s10346-022-01966-9 [27] WANG H J, SUN P, REN J, et al., 2023. Reactivation mechanism and run-out processes of the Wangqi landslide induced by water leakage on April 30, 2022, in Tianshui City, Gansu Province, China[J]. Landslides, 20(5): 999-1011. doi: 10.1007/s10346-023-02046-2 [28] WANG K, WU L Y, YIN K L, et al., 2025. Shallow landslide susceptibility assessment based on BO-XGBoost model in Quzhou[J]. Safety and Environmental Engineering, 32(3): 197-209. (in Chinese with English abstract) [29] WANG L M, GUO A N, WANG P, et al., 2020. Characteristics and Revelation of Great Haiyuan Earthquake Disaster[J]. City and Disaster Reduction, (06): 43-53. (in Chinese) [30] WEI R Z, WANG Q, ZHUANG Q et. al., 2022. Discussion on late cenozoic stratigraphic features and earth surface processes in the middle reaches of the Yellow River and its adjacent regions[J]. Quaternary Sciences, 42(03): 823-842. (in Chinese with English abstract) [31] WU S R, SHI J S, WANG T, et al. , 2012. Theory and methodology of landslide risk assessment[M]. Beijing: Science Press. (in Chinese) [32] XU C, WU X Y, XU X W, 2018. Earthquake-triggered landslides in the Loess Plateau and its adjacent areas[J]. Journal of Engineering Geology, 26(S1): 260-273. (in Chinese with English abstract) [33] XU Q, DONG X J, LI W L, 2019. Integrated space-air-ground early detection, monitoring and warning system for potential catastrophic geohazards[J]. Geomatics and Information Science of Wuhan University, 44(7): 957-966. (in Chinese with English abstract) [34] XU Q, PENG D L, FAN X M, et al., 2025. Preliminary study on the characteristics and initiation mechanism of Zhongchuan flowslide due to liquefaction triggered by the Ms 6.2 Jishishan earthquake in Gansu Province[J]. Geomatics and Information Science of Wuhan University, 50(2): 207-222. (in Chinese with English abstract) [35] XU X W, HAN Z J, YANG X P, et al. , 2016. Seismotectonic map of China and adjacent areas[M]. Beijing: Seismological Press. (in Chinese with English abstract) [36] YUAN B Y, TANG G A, ZHOU L P, et al. , 2007 Control action of the Cenozoic tectogenesis on the geomorphic differentiation in Loess Plateau and the formation of Yellow River[J]. Quaternary Sciences. 32(05): 829-838. (in Chinese with English abstract) [37] YANG J, HUANG X, 2021. The 30 m annual land cover dataset and its dynamics in China from 1990 to 2019[J]. Earth System Science Data, 13(8): 3907-3925. doi: 10.5194/essd-13-3907-2021 [38] YE T Z, HUANG C K, DENG A Q. 2017. Spatial database of 1: 2500000 digital geologic map of People’s Republic of China[J]. Geology in China, 44(S1): 19−24. (in Chinese with English abstract) [39] ZHANG S, SUN P, REN J, et al., 2022. Successful emergency evacuation from a catastrophic loess landslide reactivated by the torrential rain in October 2021 in Tianshui, Ganusu, NW China[J]. Geoenvironmental Disasters, 9(1): 19. doi: 10.1186/s40677-022-00222-5 [40] ZHANG S, SUN P, LI R, et al., 2023. Preliminary investigation on a catastrophic loess landslide induced by heavy rainfall on 1 September 2022 in Qinghai, China[J]. Landslides, 20(7): 1553-1559. doi: 10.1007/s10346-023-02086-8 [41] ZHOU C, YIN K L, CAO Y, et al., 2020. Landslide susceptibility assessment by applying the coupling method of radial basis neural network and adaboost: a case study from the three gorges reservoir area[J]. Earth Science, 45(6): 1865-1876. (in Chinese with English abstract) [42] ZHOU S Q, LIU Z Y, WANG M, et al., 2022. Impacts of building configurations on urban stormwater management at a block scale using XGBoost[J]. Sustainable Cities and Society, 87: 104235. doi: 10.1016/j.scs.2022.104235 [43] 柴慧霞, 程维明, 乔玉良, 2006. 中国“数字黄土地貌”分类体系探讨[J]. 地球信息科学, 8(2): 6-13. [44] 陈丹璐, 安雪莲, 邵怀勇, 等, 2025. 黄土塬地貌区滑坡灾害易发性量化评估及关键驱动因子[J]. 北京师范大学学报(自然科学版), 61(2): 255-267. [45] 董金玮, 周岩, 尤南山, 等, 2021. 2000-2022年中国30米年最大NDVI数据集[DS/OL]. 国家生态科学数据中心. [46] 窦杰, 向子林, 许强, 等, 2023. 机器学习在滑坡智能防灾减灾中的应用与发展趋势[J]. 地球科学, 48(5): 1657-1674. [47] 李曼, 何昊, 吴东丽, 等, 2025. 气候变化背景下黄土高原土壤侵蚀时空演变[J]. 生态学报, 45(16): 7793-7807. [48] 刘东生, 1985. 黄土与环境[M]. 北京: 科学出版社. [49] 刘坚, 李树林, 陈涛, 2018. 基于优化随机森林模型的滑坡易发性评价[J]. 武汉大学学报(信息科学版), 43(7): 1085-1091. [50] 南淑荷, 李进军, 魏佳芳, 等, 2025. 基于XGBoost-SHAP模型的流域水质指标对DO的驱动与协同影响分析[J]. 水电能源科学, 43(7): 52-56. [51] 彭建兵, 林鸿州, 王启耀, 等, 2014. 黄土地质灾害研究中的关键问题与创新思路[J]. 工程地质学报, 22(4): 684-691. [52] 彭建兵, 王启耀, 庄建琦, 等, 2020. 黄土高原滑坡灾害形成动力学机制[J]. 地质力学学报, 26(5): 714-730. [53] 佟彬, 殷跃平, 李昺, 等, 2025. 地质灾害人工智能大语言模型研究展望[J]. 中国地质灾害与防治学报, 36(2): 1-12. [54] 王兰民, 郭安宁, 王平, 等, 2020. 1920年海原大地震震害特征与启示[J]. 城市与减灾, (06): 43-53. [55] 王火根, 胡梦婷, 刘小春, 2025. 基于机器学习和SHAP算法的我国粮食安全水平测度重构及可解释性分析[J]. 中国农业大学学报, 30(7): 264-274. [56] 王凯, 邬礼扬, 殷坤龙, 等, 2025. 基于BO-XGBoost模型的衢州市浅层滑坡易发性评价[J]. 安全与环境工程, 32(3): 197-209. [57] 吴树仁, 石菊松, 王涛, 等, 2012. 滑坡风险评估理论与技术[M]. 北京: 科学出版社. [58] 魏荣珠, 王权, 庄其天, 等, 2022. 黄河中游及邻区晚新生代地层特征及地表过程讨论[J]. 第四纪研究, 42(03): 823-842. [59] 许冲, 吴熙彦, 徐锡伟, 2018. 黄土高原及邻区的地震滑坡[J]. 工程地质学报, 26(S1): 260-273. [60] 许强, 董秀军, 李为乐, 2019. 基于天-空-地一体化的重大地质灾害隐患早期识别与监测预警[J]. 武汉大学学报(信息科学版), 44(7): 957-966. [61] 许强, 彭大雷, 范宣梅, 等, 2025. 甘肃积石山Ms 6.2地震触发青海中川乡液化型滑坡-泥流特征与成因机理[J]. 武汉大学学报(信息科学版), 50(2): 207-222. [62] 徐锡伟, 韩竹军, 杨晓平, 等, 2016. 中国及邻近地区地震构造图[M]. 北京: 地震出版社. [63] 叶天竺, 黄崇轲, 邓志奇. 2017. 1: 250万中华人民共和国数字地质图空间数据库[J]. 中国地质, 44(S1): 19-24. [64] 袁宝印, 汤国安, 周力平, 等, 2012. 新生代构造运动对黄土高原地貌分异与黄河形成的控制作用[J]. 第四纪研究, 32(05): 829-838. [65] 周超, 殷坤龙, 曹颖, 等, 2020. 基于集成学习与径向基神经网络耦合模型的三峡库区滑坡易发性评价[J]. 地球科学, 45(6): 1865-1876. -

 下载:
下载:


计量
- 文章访问数: 816
- HTML全文浏览量: 264
- PDF下载量: 147
- 被引次数: 0
