Reconstruction of climatic and environmental evolution in the Yinchuan Basin from MIS6 to MIS5 based on spore–pollen evidence
-
摘要:
MIS6—MIS5是冰期向间冰期转变的典型时期,MIS5阶段的气候要素可以和现代暖期类比,对其演变过程进行研究可以更好地了解暖期气候变化过程和未来气候变化趋势。利用现代孢粉和气象数据以及季风边缘区银川盆地的地层孢粉和粒度指标,通过训练集选择、主控气候参数筛选、5种重建模型的交叉验证、区域对比、显著性检验和生态学解释后认为局部加权加权平均偏最小二乘法(LWWA-PLS)重建结果最为稳健。MIS6—MIS5阶段气候演变可分为6个阶段:157~131 ka时期,年平均降水量(Pann)为424.99 mm,7月平均温度(TJuly)为22.58 ℃,气候较湿冷,喜湿冷乔木类植被发育;131~119 ka时期,Pann为410.95 mm,TJuly为23.62 ℃,喜暖乔木、草本发育,气候转湿暖;119~111 ka时期,Pann为369.50 mm,TJuly为22.53 ℃,喜冷草本、乔木发育,气候干冷;111~98 ka时期,Pann为378.39 mm,TJuly为22.86 ℃,早期喜暖乔木含量高,后期喜冷乔木含量上升,气候整体干暖,温度先上升后下降;98~85 ka时期,Pann为278.24 mm,TJuly为22.01 ℃,喜冷乔木较发育,该阶段气候整体最为干冷;85~78 ka时期,Pann为364.21 mm,TJuly为23.45 ℃,乔木、草本均较发育,气候转湿暖。对重建的气候参数进行集合经验模态分解(EEMD),结果较好地响应于23 ka岁差周期,与北半球中、高纬地质记录对比后认为,受太阳辐射影响的北大西洋气候变动主要通过西风环流以及大洋传输带驱动东亚季风的变化,进而影响银川盆地的气候变化。
Abstract:MIS6 to MIS5 is a typical transition period from glacial to interglacial periods. The climate elements of MIS5 are similar to that of the current warm period, and studying its evolution process can better understand the climate change process of the current warm period and the future climate change trend. Based on modern spore–pollen and meteorological data, as well as stratigraphic spore–pollen and particle size indicators from the Yinchuan Basin in the monsoon margin area, the locally weighted average partial least squares method (LWWA-PLS) reconstruction results are considered to be the most robust after the selection of the training set, screening of the master climate parameters, cross-validation of the five reconstruction models, regional comparison, significance testing, and ecological interpretation. The climatic evolution from MIS6 to MIS5 can be divided into six stages. 157 to 131 ka, the climate was cold and humid, where wet and cold-loving arborvitae vegetation developed, with the average annual precipitation (Pann) being 424.99 mm and the average temperature in July (TJuly) 22.58 ℃. 131 to 119 ka, the climate turned wet and warm, and warm-loving trees and herbs developed; the Pann was 410.95 mm, and the TJuly was 23.62 ℃. 119 to 111 ka, the Pann was 369.50 mm, and the TJuly was 22.53 ℃; cold-loving herbs and trees developed in a cold and dry climate. 111 to 98 ka, the Pann is 378.39 mm, and the TJuly is 22.86 ℃; warm-loving trees account for a higher proportion in the early stage, and the number of cold-loving trees increased in the late stage; the climate was overall dry and warm, and the temperature increased first and then decreased. 98 to 85 ka, the Pann was 278.24, and the TJuly was 22.01 ℃; the overall climate was the driest and coldest, and cold-loving trees developed well. 85 to 78 ka, the Pann was 364.21 mm, and TJuly was 23.45 ℃; the climate turned warm and humid, and trees and herbs developed in this period. The reconstructed climate parameters' ensemble empirical mode decomposition (EEMD) results respond well to the 23 ka precessional cycle. Comparison with the mid- and high-latitude geologic record of the Northern Hemisphere suggests that solar radiation-influenced climatic variability in the North Atlantic primarily drives changes in the East Asian monsoon through the westerly wind circulation as well as the oceanic transport zone, which in turn influences climatic change in the Yinchuan Basin.
-
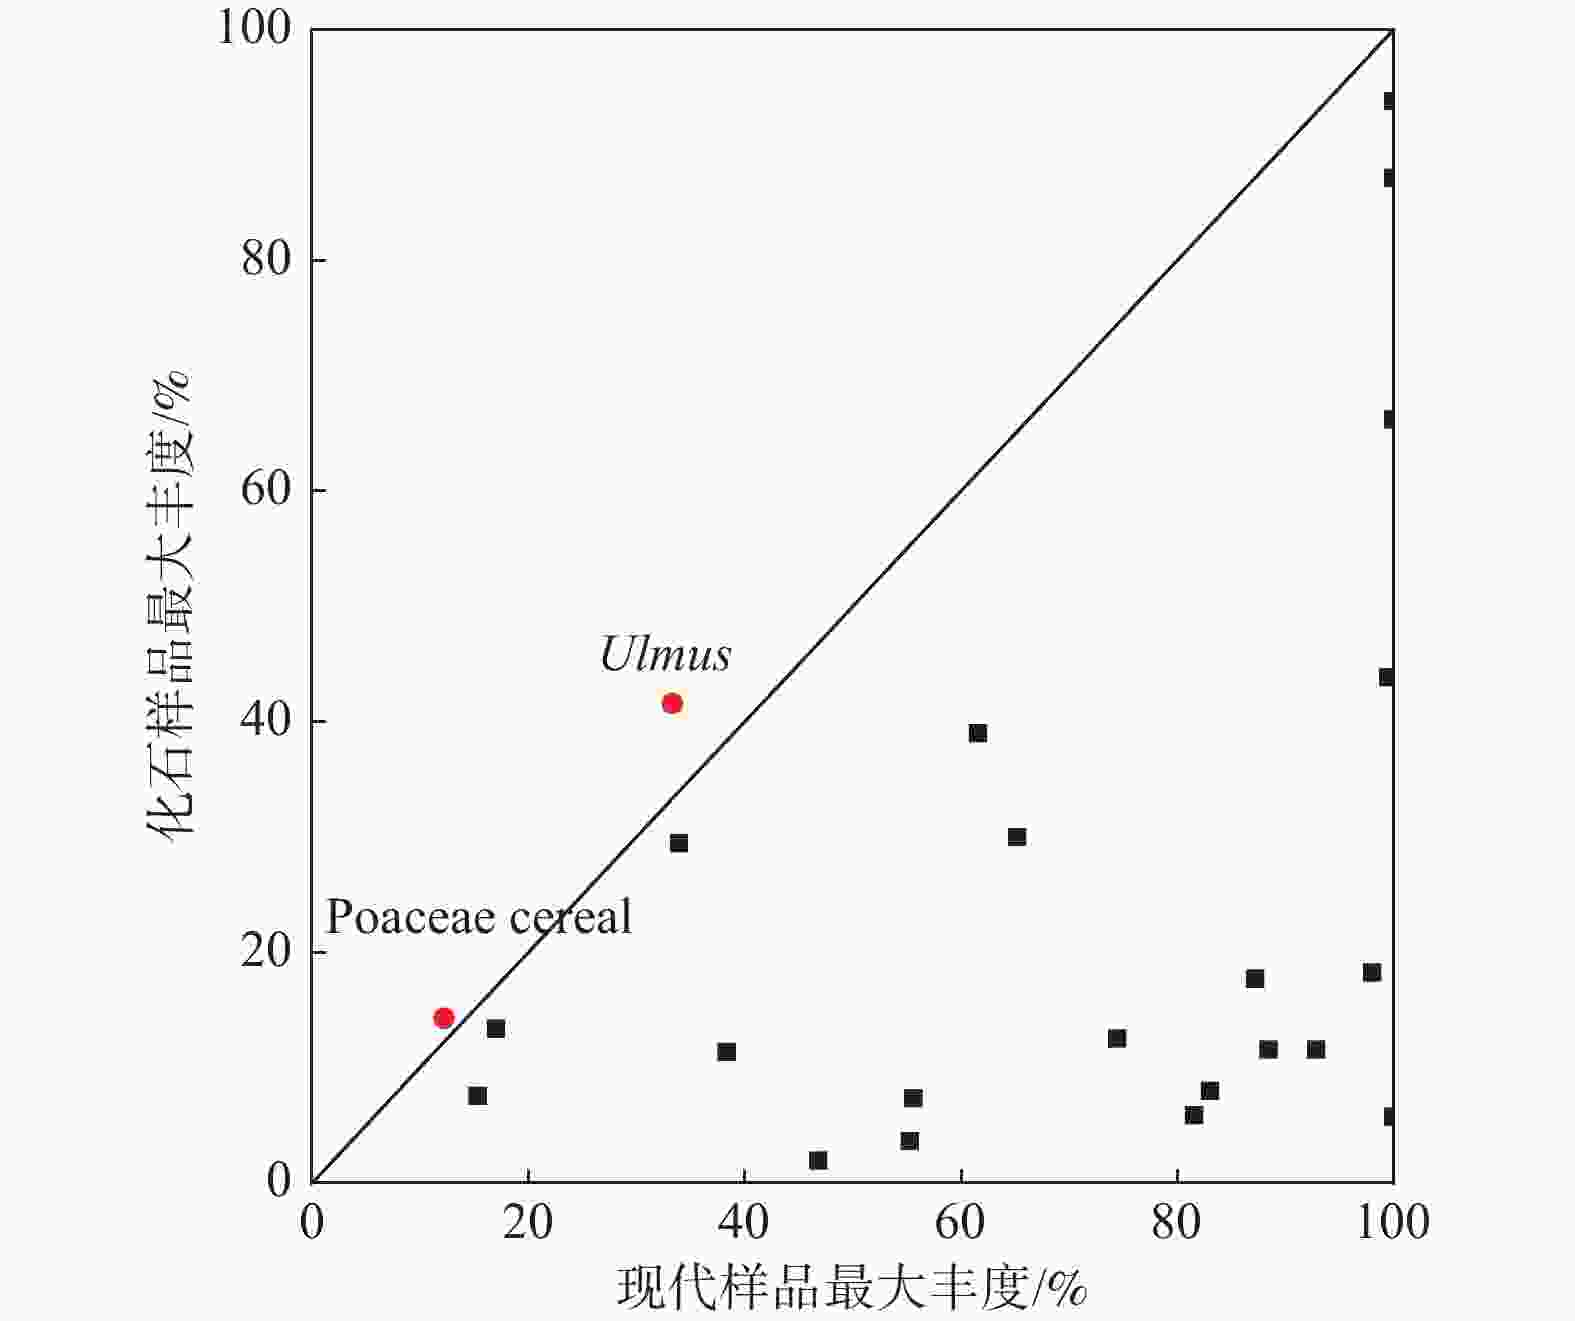
图 4 现代样品和地层化石中孢粉科属最大丰度值对比图
红色圆圈—化石样品的孢粉最大丰度大于现代样品孢粉丰度的科属
Figure 4. Comparison chart of maximum abundance values of sopre-pollen species from the modern and Borehole LS01 samples
Red circles–family and genus in which the maximum spore–pollen abundance in the borehole samples are greater than the spore–pollen abundance in the modern samples
图 7 重建结果显著性检验
红色虚线—95%随机重建结果解释方差的比例;蓝色线—化石样品PCA第一轴解释的方差比例
Figure 7. Significance test of the reconstruction results
Red dotted line–proportion of variance explained by 95% random reconstruction results; Blue line–proportion of variance explained by the first axis of a principal components analysis (PCA) of the borehole samples
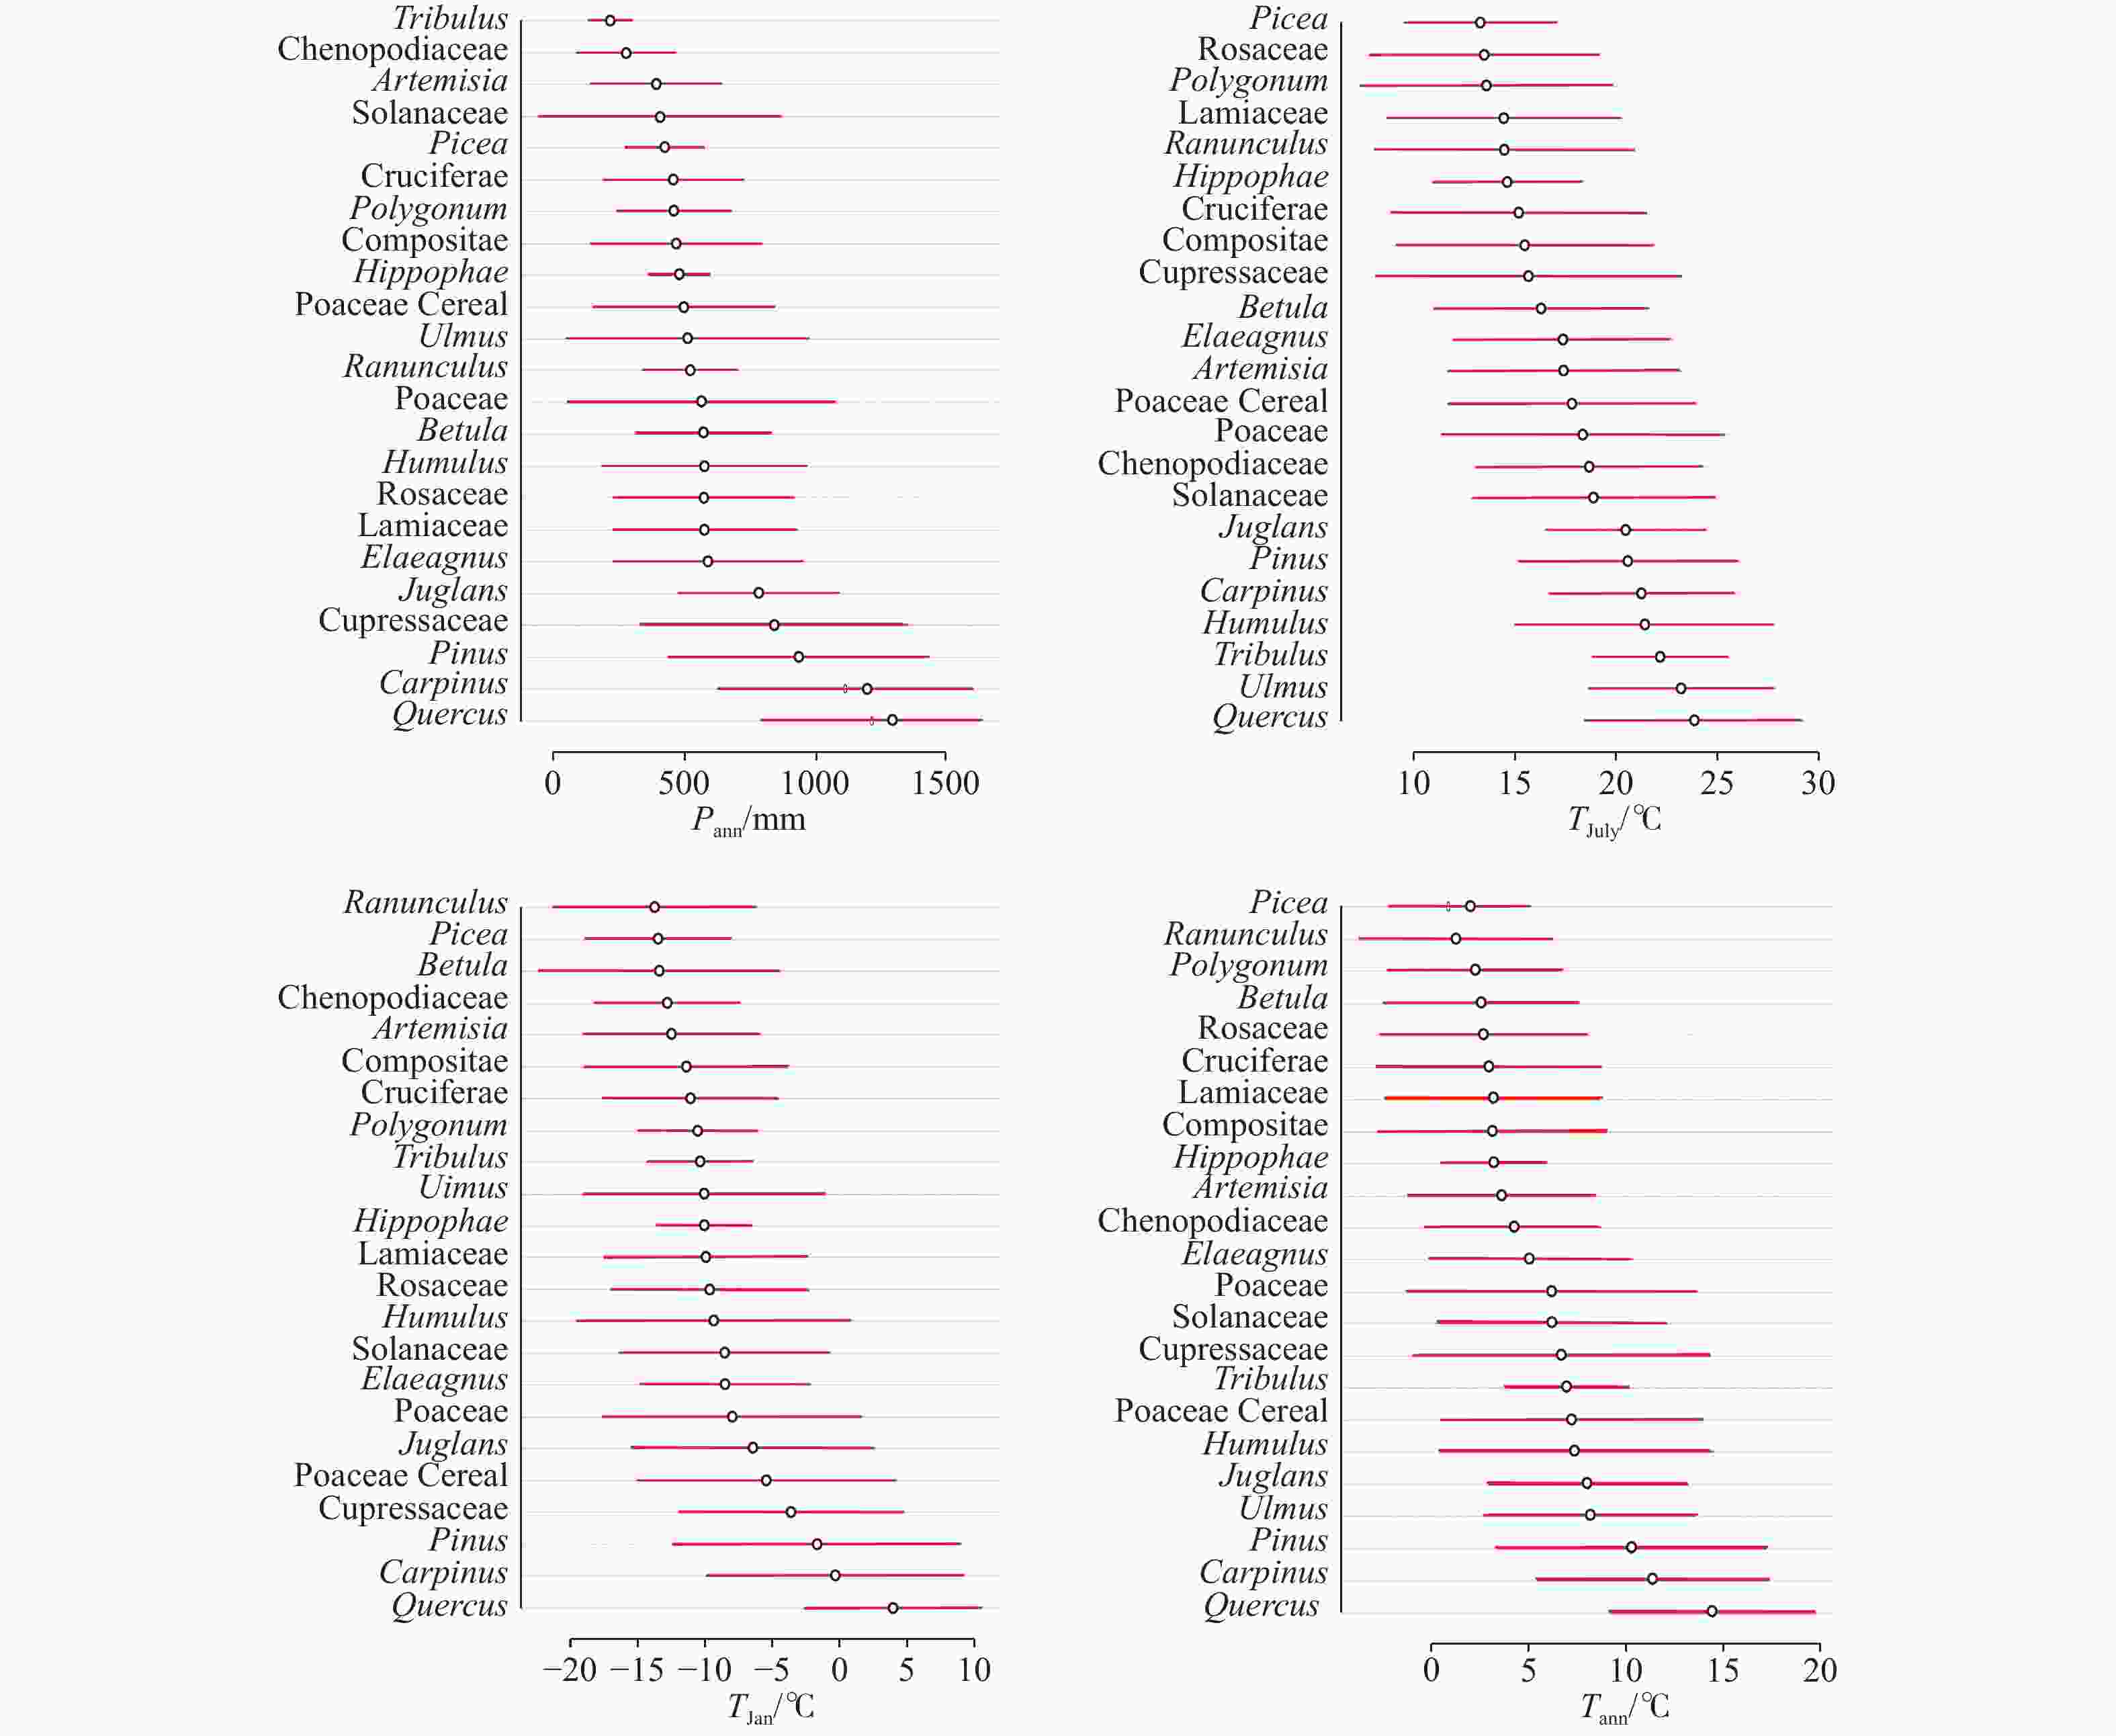
图 9 现代主要孢粉科属含量与年平均降水Huisman–Olff–Fresco(HOF)分析结果
a—Pinus;b—Picea;c—Betula;d—Cupressaceae;e—Carpinus;f—Juglans;g—Quercus deciduous;h—Ulmus;i—Hippophae;j—Elaeagnus;k—Poaceae;l—Chenopodiaceae;m—Asteraceae;n—Artemisia;o—Ranunculus;p—Polygonum;q—Rosaceae;r—Lamiaceae;s—Humulus;t—Tribulus
Figure 9. Huisman-Olff-Fresco (HOF) analysis results of main modern spore–pollen species contents vs. mean annual precipitation
图 10 现代主要孢粉科属含量与年平均温度HOF分析结果
a—Pinus;b—Picea;c—Betula;d—Cupressaceae;e—Carpinus;f—Juglans;g—Quercus deciduous;h—Ulmus;i—Hippophae;j—Elaeagnus;k—Poaceae;l—Chenopodiaceae;m—Asteraceae;n—Artemisia;o—Ranunculus;p—Polygonum;q—Rosaceae;r—Lamiaceae;s—Humulus;t—Tribulus
Figure 10. HOF results of main modern sopre–pollen species contents vs. mean annual temperature
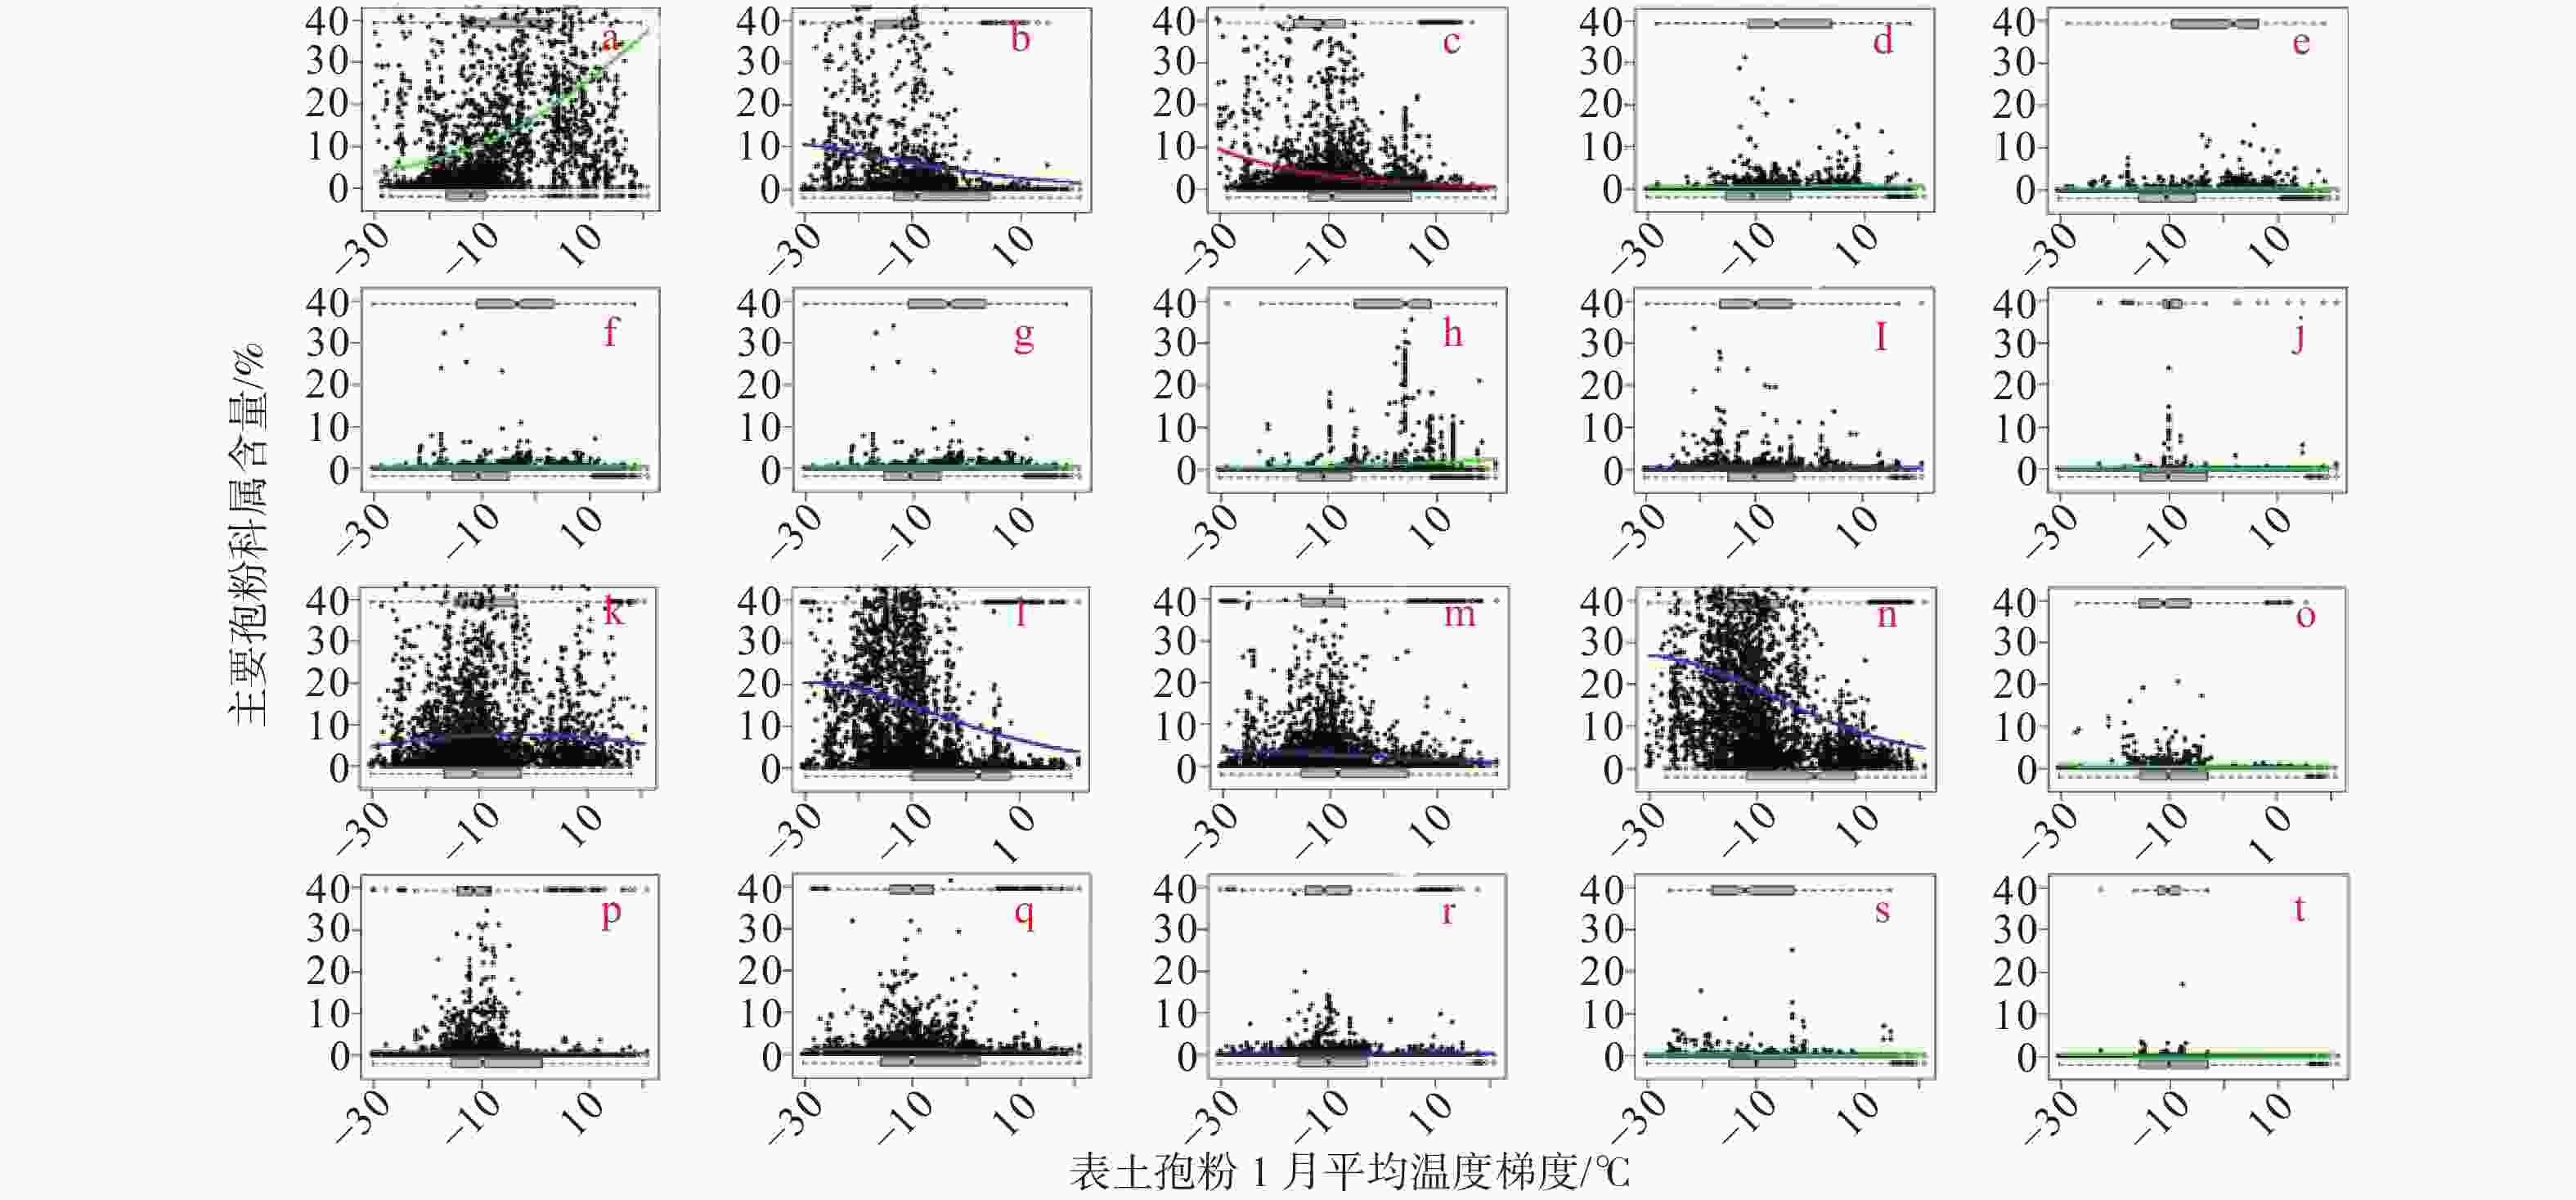
图 11 现代主要孢粉科属含量与1月平均温度HOF分析结果
a—Pinus;b—Picea;c—Betula;d—Cupressaceae;e—Carpinus;f—Juglans;g—Quercus deciduous;h—Ulmus;i—Hippophae;j—Elaeagnus;k—Poaceae;l—Chenopodiaceae;m—Asteraceae;n—Artemisia;o—Ranunculus;p—Polygonum;q—Rosaceae;r—Lamiaceae;s—Humulus;t—Tribulus
Figure 11. HOF results of main modern sopre–pollen species contents vs. mean temperature in January
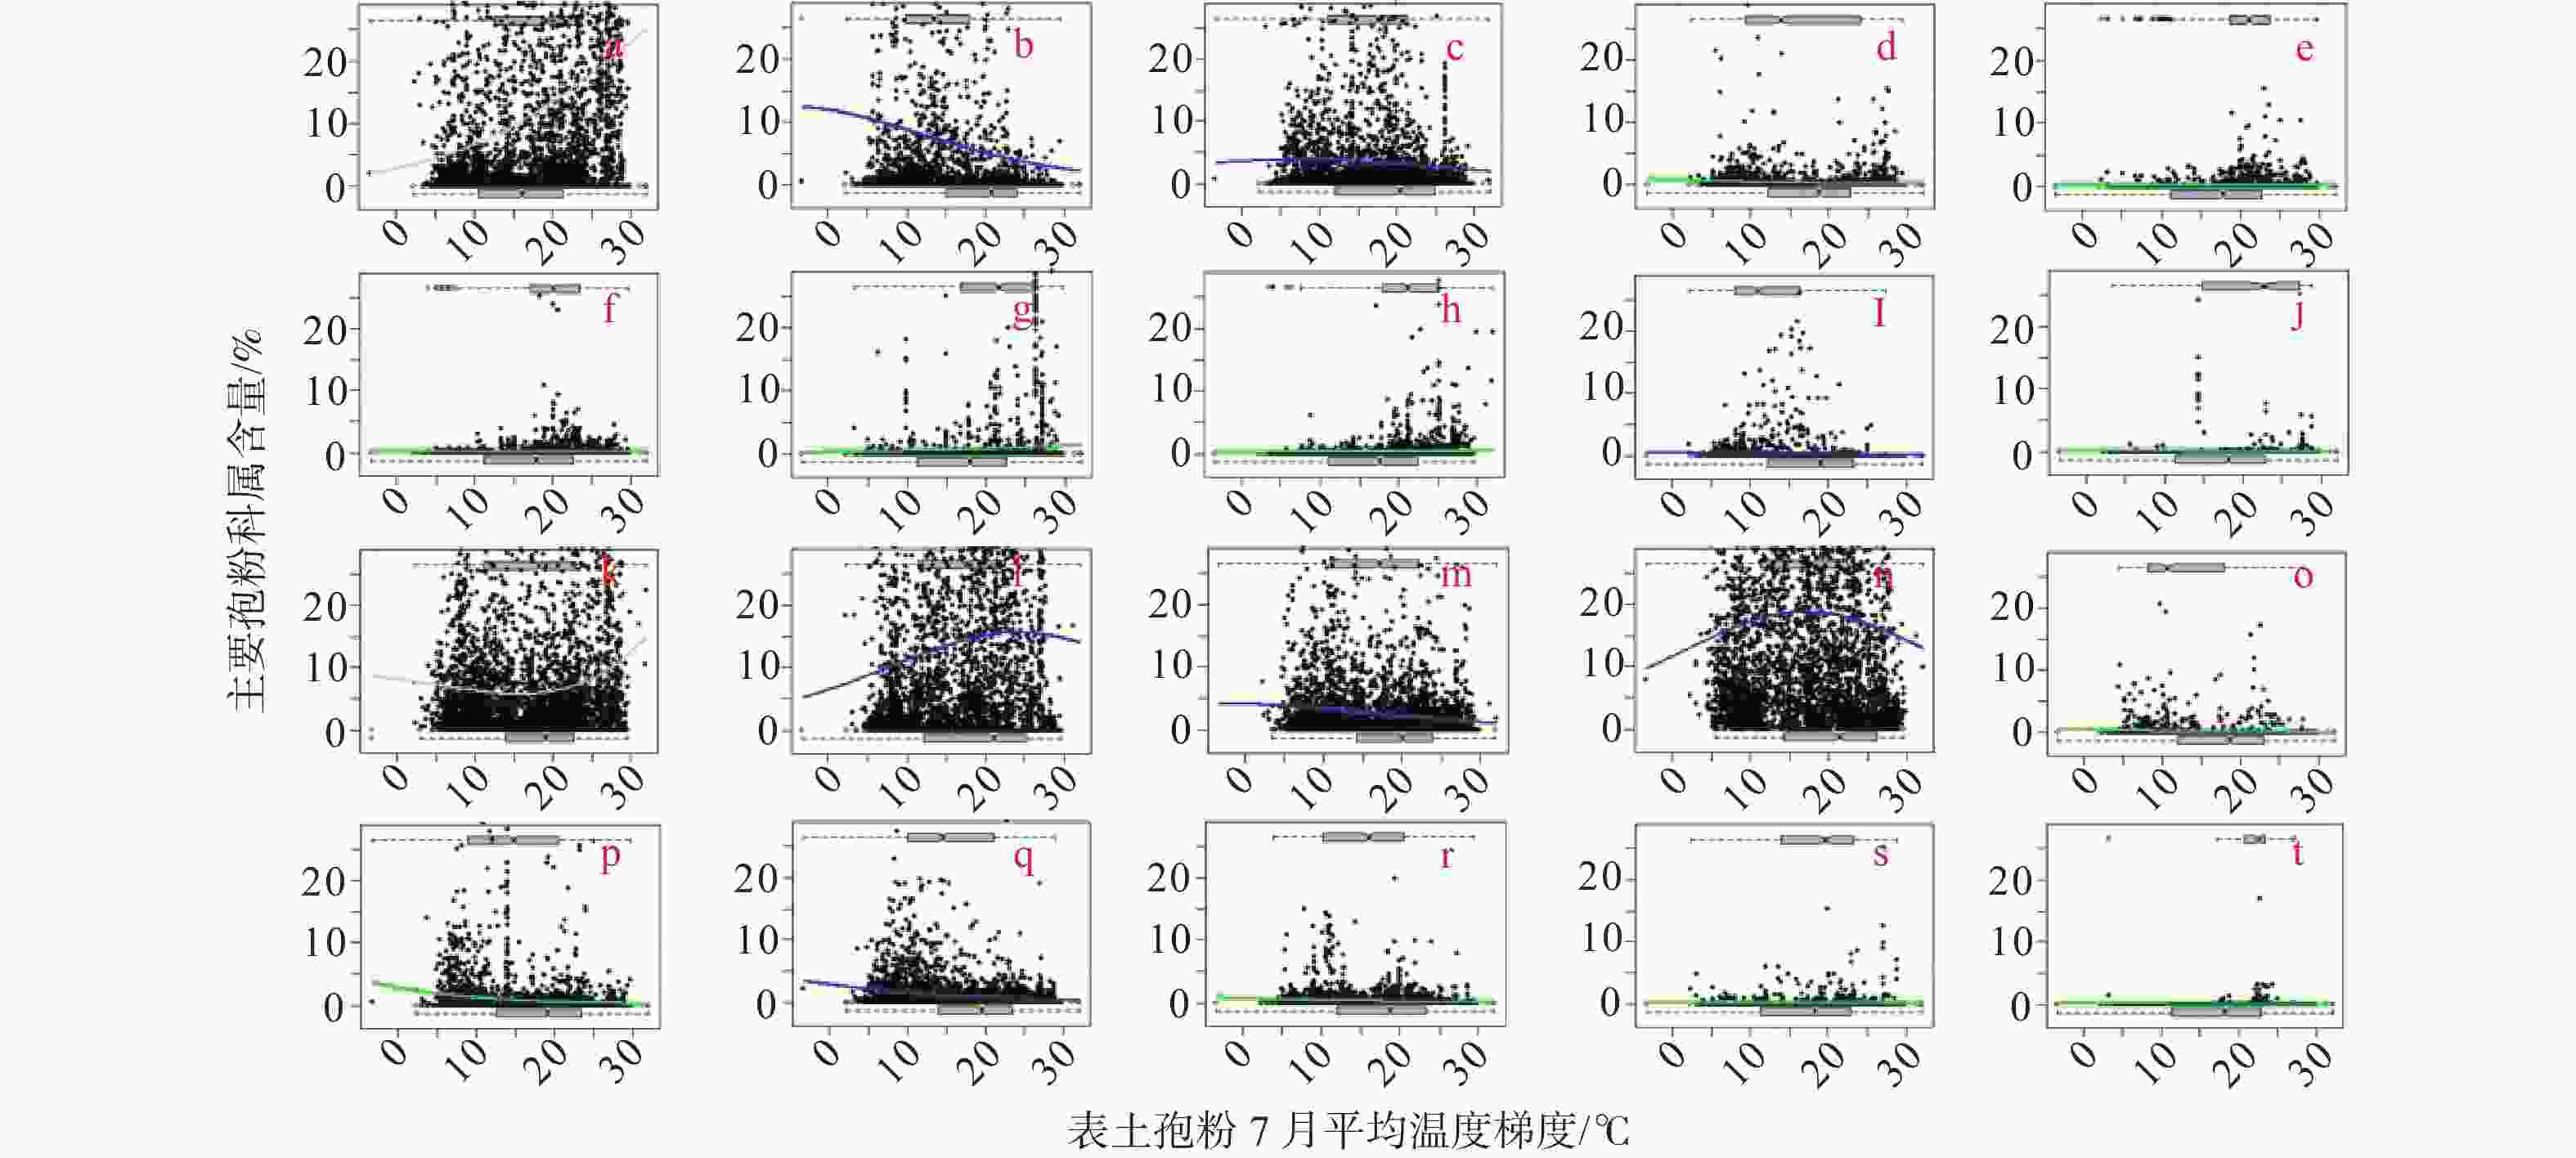
图 12 现代主要孢粉科属含量与7月平均温度HOF分析结果
a—Pinus;b—Picea;c—Betula;d—Cupressaceae;e—Carpinus;f—Juglans;g—Quercus deciduous;h—Ulmus;i—Hippophae;j—Elaeagnus;k—Poaceae;l—Chenopodiaceae;m—Asteraceae;n—Artemisia;o—Ranunculus;p—Polygonum;q—Rosaceae;r—Lamiaceae;s—Humulus;t—Tribulus
Figure 12. HOF results of main modern sopre–pollen species contents vs. mean temperature in July
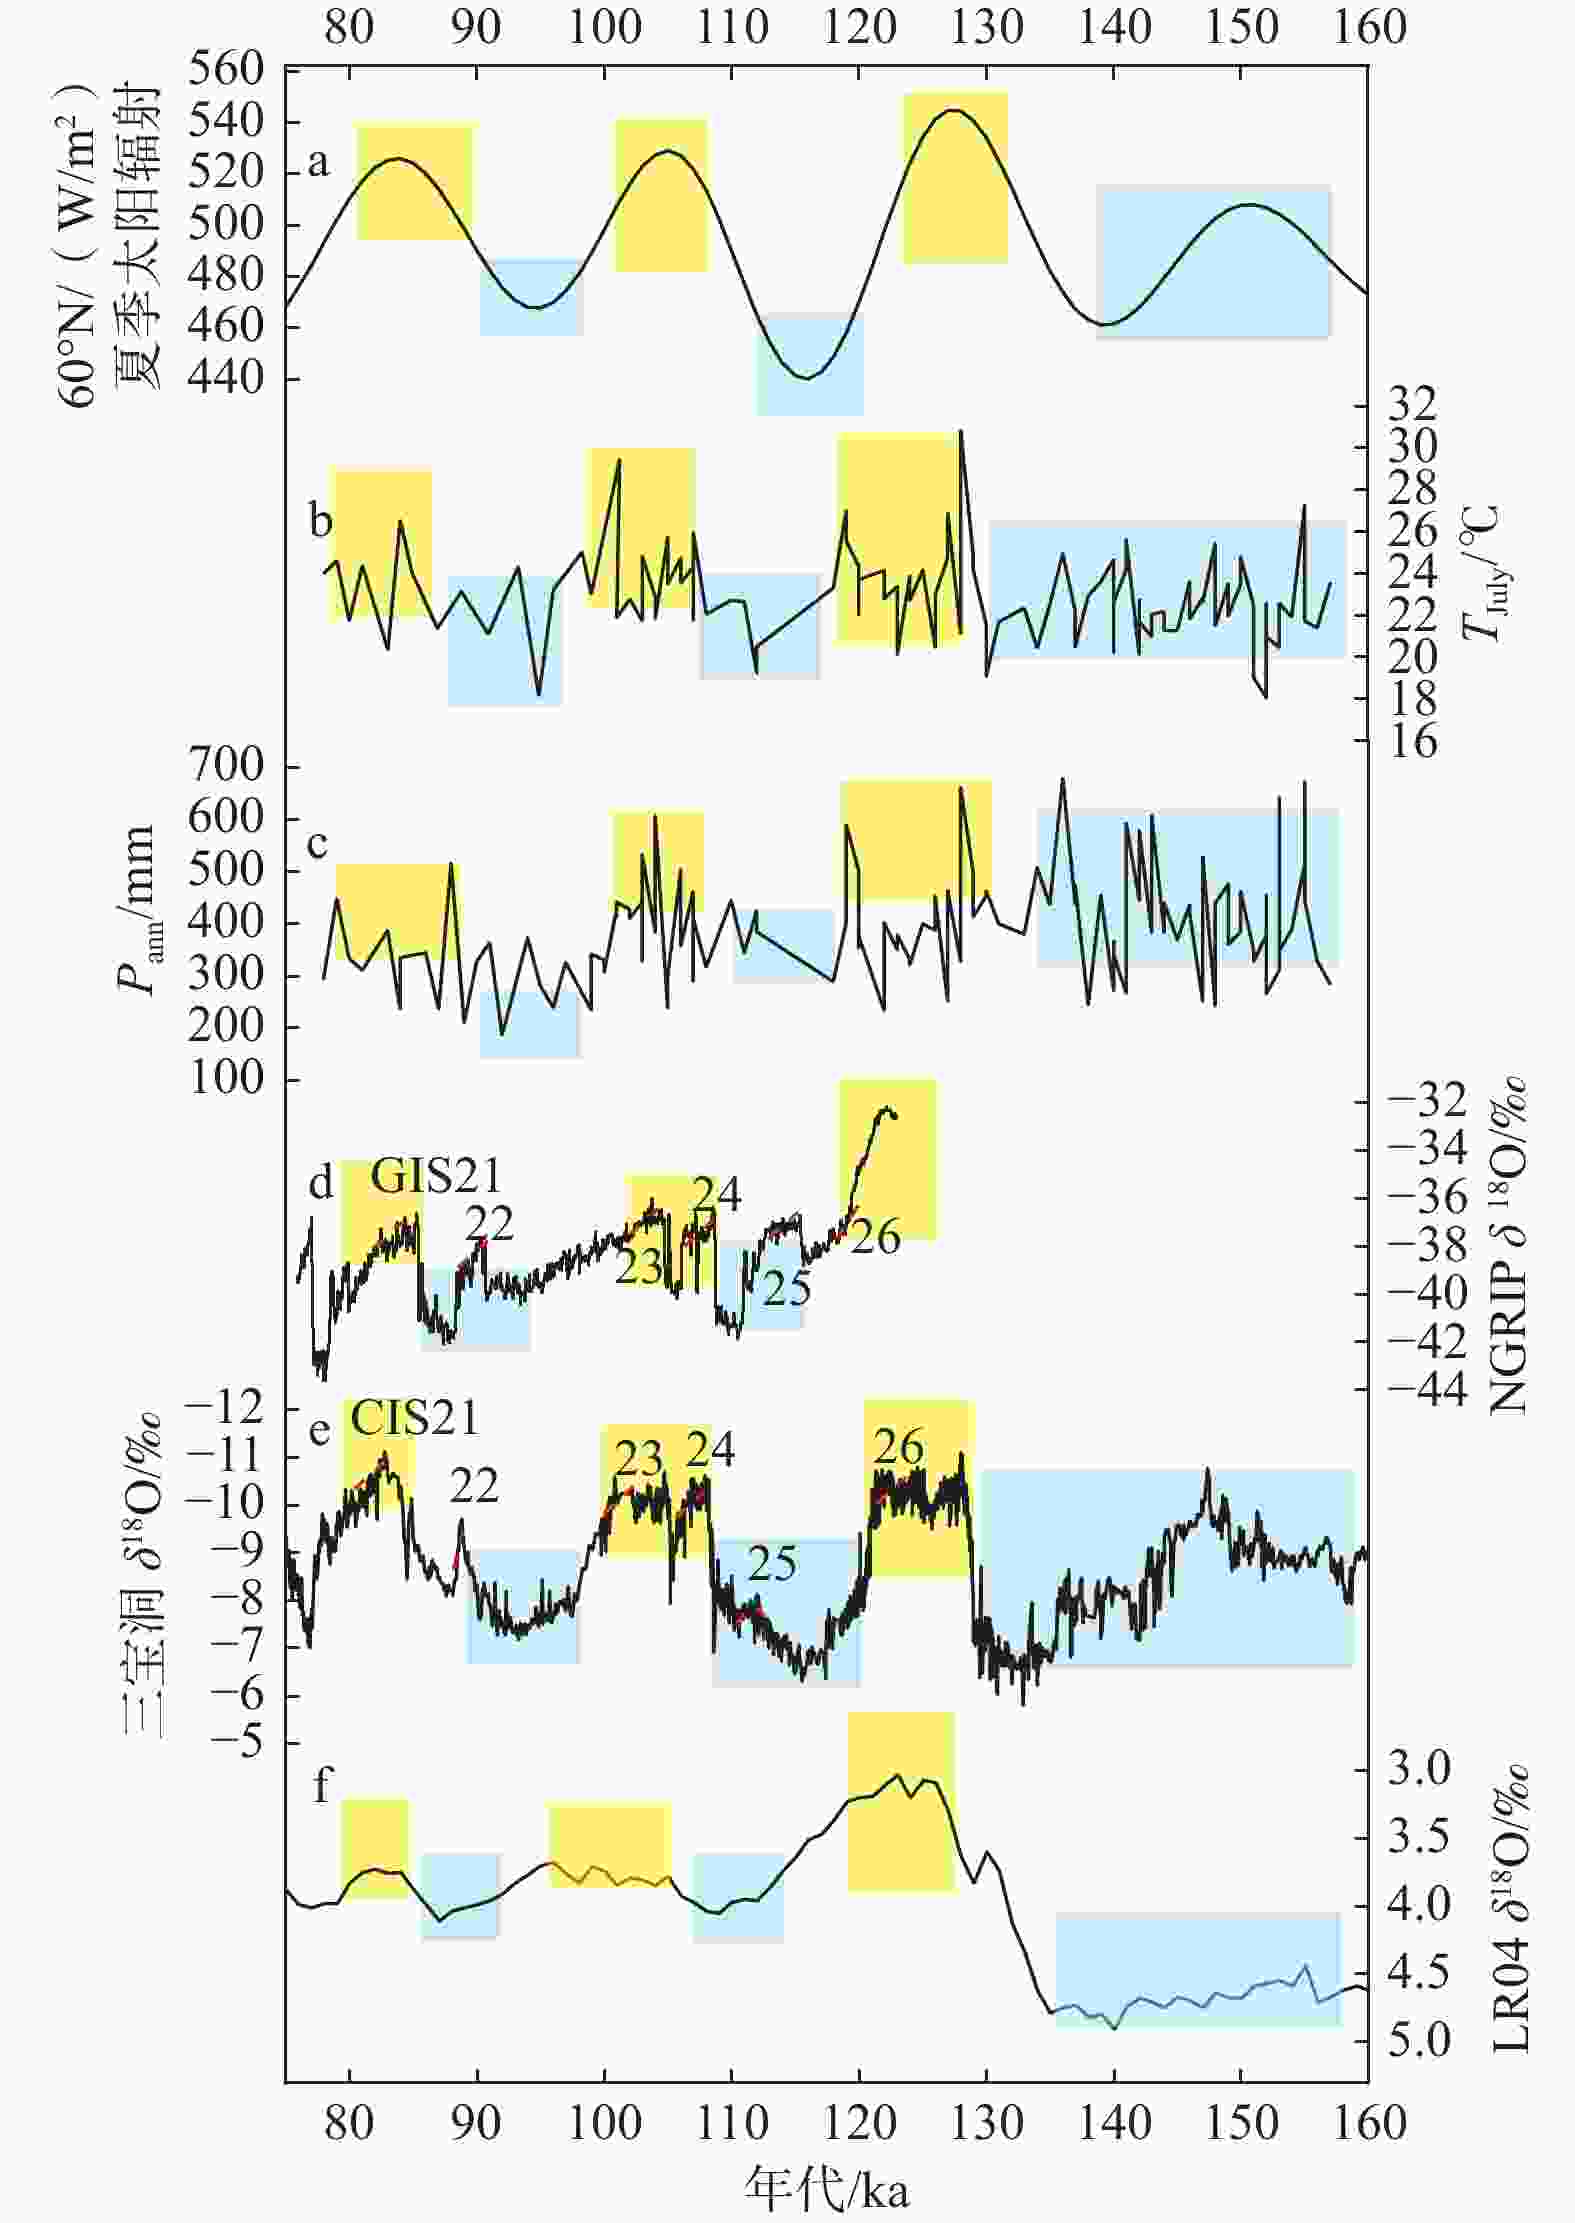
图 15 重建降水和温度与北半球中高纬度地质记录对比
黄色表示暖期;蓝色表示冷期;GIS为格陵兰冰芯记录的千尺度气候突变事件;CIS为亚洲季风记录的千年尺度气候突变事件a—北半球N60°夏季太阳辐射(Berger and Loutre,1991);b、c—文章重建的TJuly和Pann;d—NGRIP冰芯的δ18O (Veres et al., 2013;AICC 2012时标);e—三宝洞石笋的δ18O (Cheng et al.,2016);f—LR04全球深海地区生物的δ18O (Lisiecki and Raymo,2005)
Figure 15. Comparison of reconstructed precipitation and temperature with geologic records at mid- to high-latitudes in the Northern Hemisphere
(a) N65° summer insolution (Berger and Loutre, 1991); (b and c) Reconstructed TJuly and Pann in this research; (d) δ18O recorded by NGRIP ice core (Veres et al., 2013); (e) δ18O recorded by Sanbao Cave (Cheng et al.,2016); (f) LR04 δ18O record (Lisiecki and Raymo, 2005)Yellow–warm stage; Blue–cold stage; GIS–the abrupt climate change events at the kilo-scale recorded by Greenland ice core; CIS–the abrupt climate change events at the millennial scale recorded by the Asian monsoon
表 1 LS01钻孔光释光测年结果(许可可等,2021)
Table 1. OSL ages and dating parameters of Borehole LS01(Xu et al., 2021)
编号 α系数 深度/m U/×10−6 Th/×10−6 K/% 含水率/% 剂量率/(Gy/ka) 等效剂量/Gy 年龄/ka LS01-OSL-1 0.04±0.02 15.3 2.71 14.38 2.17 25±5 3.78±0.21 300.64±11.84 79.58±5.42 LS01-OSL-2 0.04±0.02 26.5 1.95 11.24 1.84 29±5 2.91±0.16 296.12±11.32 101.72±6.67 LS01-OSL-3 0.04±0.02 41.7 1.90 11.33 1.72 28±5 2.35±0.07 262.22±2.11 111.58±3.49 LS01-OSL-4 0.04±0.02 60.2 2.55 10.00 1.75 20±5 2.61±0.09 325.65±1.61 124.91±4.17 LS01-OSL-5 0.04±0.02 75.4 1.83 7.71 1.74 29±5 2.12±0.07 301.41±1.32 142.17±4.60 LS01-OSL-6 0.04±0.02 102.8 2.17 4.92 2.13 20±5 2.93±0.15 445.38±43.82 151.85±16.81 表 2 气候参数选择结果
Table 2. Selection of climatic variables
气候
参数所有
参数移除
Tann移除
TJan移除
TJuly单气候变量解释度 解释度 贡献率% P Pann 2.68 2.61 2.68 2.60 1.10 55.50 0.002 TJuly 104.15 3.08 4.66 — 0.50 24.50 0.002 Tann 260.41 — 7.70 5.08 0.30 14.00 0.002 TJan 69.49 1.35 — 6.99 0.10 6.00 0.002 表 3 不同重建模型交叉验证结果
Table 3. Cross-validation results of different reconstruction models
重建模型 Pann/mm TJuly/℃ 重建模型 Pann/mm TJuly/℃ RMSEP R2 RMSEP R2 RMSEP R2 RMSEP R2 MAT-500 km 75.46 0.77 1.96 0.77 LWWA(classical)-k=30 71.88 0.79 3.01 0.79 MAT-1000 km 95.71 0.89 2.68 0.82 LWWA(inverse)-k=40 66.19 0.82 2.61 0.84 MAT-1500 km 136.06 0.89 2.71 0.83 LWWA(classical)-k=40 74.44 0.78 3.14 0.78 WA(inverse)-500 km 94.61 0.61 2.51 0.62 LWWA(inverse)-k=50 67.17 0.81 2.63 0.84 WA(classical)-500 km 119.06 0.63 3.18 0.62 LWWA(classical)-k=50 76.21 0.78 3.23 0.77 WA(monotonic)-500 km 91.20 0.65 2.46 0.63 LWWA(inverse)-k=60 68.29 0.81 2.64 0.84 WA(expanded)-500 km 99.88 0.63 2.66 0.62 LWWA(classical)-k=60 78.64 0.77 3.32 0.77 WA(none)-500 km 114.62 0.63 2.97 0.62 LWWA(inverse)-k=70 68.85 0.80 2.69 0.83 WA(inverse)-1000 km 156.42 0.71 4.00 0.61 LWWA(classical)-k=70 78.60 0.78 3.45 0.75 WA(classical)-1000 km 184.77 0.71 5.11 0.61 LWWA(inverse)-k=80 69.74 0.80 2.71 0.83 WA(monotonic)-1000 km 151.50 0.73 3.78 0.65 LWWA(classical)-k=80 78.68 0.78 3.54 0.75 WA(expanded)-1000 km 162.79 0.71 4.23 0.61 LWWA(inverse)-k=90 70.48 0.79 2.74 0.83 WA(none)-1000 km 183.41 0.71 4.58 0.61 LWWA(classical)-k=90 79.86 0.77 3.66 0.73 WA(inverse)-1500 km 197.17 0.78 4.11 0.61 LWWA(inverse)-k=100 70.91 0.79 2.76 0.82 WA(classical)-1500 km 223.23 0.78 5.25 0.61 LWWA(classical)-k=100 80.19 0.77 3.73 0.73 WA(monotonic)-1500 km 193.36 0.78 3.91 0.64 LWW-PLS-k=20 58.89 0.86 1.67 0.85 WA(expanded)-1500 km 203.19 0.78 4.35 0.61 LWW-PLS-k=30 66.00 0.82 1.76 0.81 WA(none)-1500 km 231.71 0.78 4.67 0.61 LWW-PLS-k=40 66.22 0.82 1.78 0.81 WA-PLS(Comp5)-500 km 59.09 0.85 1.67 0.83 LWW-PLS-k=50 67.10 0.81 1.81 0.80 WA-PLS(Comp5)-1000 km 112.40 0.85 2.98 0.78 LWW-PLS-k=60 68.11 0.81 1.82 0.80 WA-PLS(Comp5)-1500 km 138.94 0.89 3.02 0.79 LWW-PLS-k=70 68.66 0.80 1.82 0.80 LWWA(inverse)-k=20 59.00 0.86 1.70 0.83 LWW-PLS-k=80 69.11 0.80 1.84 0.79 LWWA(classical)-k=20 68.29 0.81 2.86 0.81 LWW-PLS-k=90 70.21 0.79 1.86 0.79 LWWA(inverse)-k=30 66.22 0.82 2.59 0.84 LWW-PLS-k=100 70.60 0.79 1.89 0.78 表 4 与其他地区重建模型交叉验证结果对比
Table 4. Comparison of cross-validation results with other regional reconstruction models
文献来源 研究区 年代 最优模型 重建参数 RMSEP R2 梁琛等,2020 青藏高原若尔盖地区 全新世 WA-PLS TJuly 2.04 ℃ 0.83 青藏高原若尔盖地区 全新世 WA-PLS TJuly 2.04 ℃ 0.81 青藏高原若尔盖地区 全新世 WA-PLS TJuly 1.91 ℃ 0.82 Zhao et al.,2021 青藏高原若尔盖地区 1.74 Ma以来 LWWA-PLS TJuly 3.06 ℃ 0.81 青藏高原若尔盖地区 1.74 Ma以来 LWWA-PLS Pann 158 mm 0.67 Lu et al.,2011 青藏高原沉措地区 全新世 LWWA TJuly 2.1 ℃ 0.78 青藏高原沉措地区 全新世 LWWA Pann 109 mm 0.89 陈建徽等,2018 黄土高原公海 14 ka以来 WA-PLS Pann 85.85 mm 0.84 黄土高原六盘山天池 6.2 ka以来 WA-PLS Pann 74.70 mm 0.87 Wen et al.,2013 内蒙古呼伦湖 全新世 WA-PLS Pann 53.9 mm 0.88 内蒙古呼伦湖 全新世 WA-PLS TJuly 1.46 ℃ 0.69 Xu et al.,2010 河南安阳 全新世 MAT Pann 79.00 mm 0.83 河南安阳 全新世 MAT TJuly 2.6 ℃ 0.52 河南安阳 全新世 WA-PLS Pann 70.00 mm 0.87 河南安阳 全新世 WA-PLS TJuly 2.3 ℃ 0.61 文中 银川盆地 MIS6—MIS5 LWWA-PLS Pann 58.89 mm 0.86 银川盆地 MIS6—MIS5 LWWA-PLS TJuly 1.67 ℃ 0.85 银川盆地 MIS6—MIS5 LWWA Pann 68.29 mm 0.81 银川盆地 MIS6—MIS5 LWWA TJuly 2.86 ℃ 0.81 银川盆地 MIS6—MIS5 WA-PLS Pann 59.09 mm 0.85 银川盆地 MIS6—MIS5 WA-PLS TJuly 1.67 ℃ 0.83 银川盆地 MIS6—MIS5 MAT Pann 75.46 mm 0.77 银川盆地 MIS6—MIS5 MAT TJuly 1.96 ℃ 0.77 表 5 重建温度和降水量的IMF贡献率
Table 5. IMF (Intrinsic Mode Function) contribution rate of reconstructed temperature and precipitation
气候参数 特征 IMF1 IMF2 IMF3 IMF4 IMF5 TJuly 周期/ka 1.1 2.3 12 11 45 贡献率/% 0.2 0.3 55 43 1.5 排名 5 4 1 2 3 Pann 周期/ka 0.9 5 12 25 27 贡献率/% 0.1 0.2 55 42 2.7 排名 5 4 1 2 3 -
[1] BAUCH H A, KANDIANO E S, 2007. Evidence for early warming and cooling in North Atlantic surface waters during the last interglacial[J]. Paleoceanography, 22(1): PA1201. [2] BAUCH H A, ERLENKEUSER H, 2008. A “critical” climatic evaluation of last interglacial (MIS 5e) records from the Norwegian Sea[J]. Polar Research, 27(2): 135-151. doi: 10.1111/j.1751-8369.2008.00059.x [3] BAUCH H A, KANDIANO E S, HELMKE J, et al. , 2011. Climatic bisection of the last interglacial warm period in the Polar North Atlantic[J]. Quaternary Science Reviews, 30(15-16): 1813-1818. doi: 10.1016/j.quascirev.2011.05.012 [4] BERGER A, LOUTRE M F, 1991. Insolation values for the climate of the last 10 million years[J]. Quaternary Science Reviews, 10(4): 297-317. doi: 10.1016/0277-3791(91)90033-Q [5] BIRKS H J B, GORDON A D, 1985. Numerical methods in quaternary pollen analysis[M]. London: Academic Press. [6] BIRKS H J B, TER BRAAK C J F, LINE J M, et al. , 1990. Diatoms and pH reconstruction[J]. Philosophical Transactions of the Royal Society B: Biological Sciences, 327(1240): 263-278. [7] BIRKS H J B, LOTTER A F, JUGGINS S, et al. , 2012. Tracking environmental change using lake sediments volume 5: data handling and numerical techniques[M]. Dordrecht: Springer: 123-141. DOI: 10.1007/978-94-007-2745-8. [8] BLAAUW M, CHRISTEN J A, 2011. Flexible paleoclimate age-depth models using an autoregressive gamma process[J]. Bayesian Analysis, 6(3): 457-474. doi: 10.1214/ba/1339616472 [9] CAI M T, WEI M J, XU D N, et al. , 2013. Vegetation and climate changes during three interglacial periods represented in the Luochuan loess-paleosol section, on the Chinese Loess Plateau[J]. Quaternary International, 296: 131-140. doi: 10.1016/j.quaint.2012.06.041 [10] CAO X Y, HERZSCHUH U, TELFORD R J, et al. , 2014. A modern pollen–climate dataset from China and Mongolia: Assessing its potential for climate reconstruction[J]. Review of Palaeobotany and Palynology, 211: 87-96. doi: 10.1016/j.revpalbo.2014.08.007 [11] CAO X Y, TIAN F, TELFORD R J, et al. , 2017. Impacts of the spatial extent of pollen-climate calibration-set on the absolute values, range and trends of reconstructed Holocene precipitation[J]. Quaternary Science Reviews, 178: 37-53. doi: 10.1016/j.quascirev.2017.10.030 [12] CHEN H Y, XU D Y, LIAO M N, et al. , 2021. A modern pollen dataset of China[J]. Chinese Journal of Plant Ecology, 45(7): 799-808. (in Chinese with English abstract) doi: 10.17521/cjpe.2021.0024 [13] CHEN J H, LV F Y, HUANG X Z, et al. , 2018. A novel procedure for pollen-based quantitative paleoclimate reconstructions and its application in China. Science China Earth Sciences, 60(11): 2059-2066,doi: 10.1007/s11430-017-9095-1 [14] CHENG H, EDWARDS R L, SINHA A, et al. , 2016. The Asian monsoon over the past 640, 000 years and Ice Age terminations[J]. Nature, 534(7609): 640-646. doi: 10.1038/nature18591 [15] CHI C T, TIAN Y Y, ZHOU Z, et al. , 2021. Palaeoclimate and palaeoenvironmental evolution during the late Pliocene (3.04-2.88 Ma) based on pollen records from the Yinchuan Basin, Northwest China[J]. Quaternary International, 598: 15-23. doi: 10.1016/j.quaint.2021.04.036 [16] DING Z L, LIU D S, LIU D S, et al. , 1989. The 37 climatic cycles in the past 250×104 years [J]. Chinese Science Bulletin, 34(19): 1494-1496. (in Chinese) doi: 10.1360/csb1989-34-19-1494 [17] DU S H, LI B S, NIU D F, et al. , 2011. Age of the MGS5 segment of the Milanggouwan stratigraphical section and evolution of the desert environment on a kiloyear scale during the Last Interglacial in China's Salawusu River Valley: Evidence from Rb and Sr contents and ratios[J]. Geochemistry, 71(1): 87-95. doi: 10.1016/j.chemer.2010.07.002 [18] DUAN W H, CHENG H, TAN M, et al. , 2016. Onset and duration of transitions into Greenland Interstadials 15.2 and 14 in northern China constrained by an annually laminated stalagmite[J]. Scientific Reports, 6(1): 20844,doi: 10.1038/srep20844. [19] FAN S X, ZHENG H R, LIU P G, et al. , 2002. Late quaternary sporopollen records ad rapid climatic fluctuation events in the Yinchuan Basin[J]. Geology in China, 29(4): 431-434. (in Chinese with English abstract) [20] GE Y G, WEI M J, 2014. Comparison of climate and environment change of the Last Interglacial Period and Holocene in Beijing Area, China[J]. International Journal of Geosciences, 5(8): 852-862. doi: 10.4236/ijg.2014.58075 [21] GRIMM E C, 1987. CONISS: A FORTRAN 77 program for stratigraphically constrained cluster analysis by the method of incremental sum of squares[J]. Computers & Geosciences, 13(1): 13-35. [22] GUAN D H, XI X X, HAO Y P, et al. , 1996. Climate instability revealed in the Beiyuan CaCO3 record during the Last Interglacial Age[J]. Journal of Glaciology and Geocryology, 18(2): 119-124. (in Chinese with English abstract) [23] HERZSCHUH U, BIRKS H J B, MISCHKE S, et al. , 2010. A modern pollen-climate calibration set based on lake sediments from the Tibetan Plateau and its application to a Late Quaternary pollen record from the Qilian Mountains[J]. Journal of Biogeography, 37(4): 752-766. doi: 10.1111/j.1365-2699.2009.02245.x [24] HEUSSER L, MORLEY J, 1997. Monsoon fluctuations over the past 350 kyr: High-resolution evidence from northeast asia/northwest Pacific climate proxies (marine pollen and radiolarians)[J]. Quaternary Science Reviews, 16(6): 565-581. doi: 10.1016/S0277-3791(96)00079-0 [25] HEUSSER L E, 1990. Northeast Asian pollen records for the last 150, 000 years from deep-sea cores V28-304 and RC14-99 taken off the Pacific coast of Japan[J]. Review of Palaeobotany and Palynology, 65(1-4): 1-8. doi: 10.1016/0034-6667(90)90050-S [26] HUANG K Y, WEI J H, CHEN B S, 2013. Research progress of pollen-based quantitative paleoclimate reconstruction using modern analogue technique[J]. Quaternary Sciences, 33(6): 1069-1079. (in Chinese with English abstract) [27] HUANG X Z, XIANG L X, ZHANG E Y, et al. , 2019. Mid-holocene cold event at ca. 7 ka and its impact on vegetation ecology in Northern China[J]. Quaternary Sciences, 39(3): 687-700. (in Chinese with English abstract) [28] JANSEN F, OKSANEN J, 2013. How to model species responses along ecological gradients: Huisman-Olff-Fresco models revisited[J]. Journal of Vegetation Science, 24(6): 1108-1117. doi: 10.1111/jvs.12050 [29] JIANG X Y, KONG X G, WANG Y J, et al. , 2011. A high-resolution stalagmite δ13C record from Sanbao cave over the penultimate glaciation[J]. Quaternary Sciences, 31(1): 1-7. (in Chinese with English abstract) [30] JIANG X Y, WANG X Y, HE Y Q, et al. , 2016. Precisely dated multidecadally resolved Asian summer monsoon dynamics 113.5-86.6 thousand years ago[J]. Quaternary Science Reviews, 143: 1-12. doi: 10.1016/j.quascirev.2016.05.003 [31] JOUZEL J, LORIUS C, PETIT J R, et al. , 1987. Vostok ice core: a continuous isotope temperature record over the last climatic cycle (160, 000 years)[J]. Nature, 329(6138): 403-408. doi: 10.1038/329403a0 [32] JUGGINS S, 2001. The European diatom database[EB/OL]. [2001-10]https://www.researchgate.net/publication/228722952_The_European_diatom_database [33] JUGGINS S, BIRKS H J B, 2012. Quantitative environmental reconstructions from biological data[M]//BIRKS H J B, LOTTER A F, JUGGINS S, et al. Tracking environmental change using lake sediments: data handling and numerical techniques. Dordrecht: Springer: 431-494,doi: 10.1007/978-94-007-2745-8_14. [34] JUGGINS S, 2013. Quantitative reconstructions in palaeolimnology: new paradigm or sick science?[J]. Quaternary Science Reviews, 64: 20-32. doi: 10.1016/j.quascirev.2012.12.014 [35] JUGGINS S, 2022. Rioja: analysis of quaternary science data[EB/OL]. [2022-10-31].https://cran.r-project.org/package=rioja. [36] KELLY M J, EDWARDS R L, CHENG H, et al. , 2006. High resolution characterization of the Asian Monsoon between 146, 000 and 99, 000 years B. P. from Dongge Cave, China and global correlation of events surrounding Termination II[J]. Palaeogeography, Palaeoclimatology, Palaeoecology, 236(1-2): 20-38. doi: 10.1016/j.palaeo.2005.11.042 [37] KUKLA G J, 1977. Pleistocene land-sea correlations I. Europe[J]. Earth-Science Reviews, 13(4): 307-374. doi: 10.1016/0012-8252(77)90125-8 [38] LAI J S, ZOU Y, ZHANG J L, et al. , 2022. Generalizing hierarchical and variation partitioning in multiple regression and canonical analyses using the rdacca. hp R package[J]. Methods in Ecology and Evolution, 13(4): 782-788. doi: 10.1111/2041-210X.13800 [39] LEGENDRE P, GALLAGHER E D, 2001. Ecologically meaningful transformations for ordination of species data[J]. Oecologia, 129(2): 271-280. doi: 10.1007/s004420100716 [40] LI X L, HAO Q Z, WEI M J, et al. , 2017. Phased uplift of the northeastern Tibetan Plateau inferred from a pollen record from Yinchuan Basin, Northwestern China[J]. Scientific Reports, 7(1): 18023,doi: 10.1038/s41598-017-16915-z. [41] LI Y C, XU Q H, LIU J S, et al. , 2007. A transfer-function model developed from an extensive surface-pollen data set in northern China and its potential for palaeoclimate reconstructions[J]. The Holocene, 17(7): 897-905. doi: 10.1177/0959683607082404 [42] LIANG C, ZHAO Y, QIN F, et al. , 2020. Pollen-based Holocene quantitative temperature reconstruction on the eastern Tibetan Plateau using a comprehensive method framework[J]. Science China: Earth Sciences, 63(8): 1144-1160. doi: 10.1007/s11430-019-9599-y [43] LISIECKI L E, RAYMO M E, 2005. A pliocene-pleistocene stack of 57 globally distributed benthic δ18O records[J]. Paleoceanography, 20(1): PA1003,doi: 10.1029/2004PA001071. [44] LIU P G, FAN S X, LI X J, 2000. The geochemical element characteristics and paleosedimentary environment of the quaternary deposits in Yinchuan Basin[J]. Journal of Geomechanics, 6(4): 43-50, 94. (in Chinese with English abstract) [45] LU H, JIA J, XIA D S, et al. , 2015. East asian summer monsoon evolution during MIS 6.5 record in Chinese Loess Plateau and its implications[J]. Quaternary Sciences, 35(6): 1402-1411. (in Chinese with English abstract) [46] LU H Y, WU N Q, LIU K B, et al. , 2011. Modern pollen distributions in Qinghai-Tibetan Plateau and the development of transfer functions for reconstructing Holocene environmental changes[J]. Quaternary Science Reviews, 30(7-8): 947-966. doi: 10.1016/j.quascirev.2011.01.008 [47] MANGERUD J, SØNSTEGAARD E, SEJRUP H P, 1978. Correlation of the Eemian (interglacial) stage and the deep-sea oxygen-isotope stratigraphy[J]. Nature, 277(5693): 189-192. [48] MCMANUS J F, OPPO D W, CULLEN J L, 1999. A 0.5-million-year record of millennial-scale climate variability in the North Atlantic[J]. Science, 283(5404): 971-975. doi: 10.1126/science.283.5404.971 [49] MING Y F, 2004. Preliminary study of MIS6 East Asian summer monsoon suborbital scale climate change[D] Nanjing: Nanjing Normal University. (in Chinese) [50] MUHS D R, SIMMONS K R, STEINKE B, 2002. Timing and warmth of the Last Interglacial period: new U-series evidence from Hawaii and Bermuda and a new fossil compilation for North America[J]. Quaternary Science Reviews, 21(12-13): 1355-1383. doi: 10.1016/S0277-3791(01)00114-7 [51] OKSANEN J, BLANCHET F G, FRIENDLY M, et al. , 2020. Vegan community ecology package version 2.5-7 November 2020[EB/OL]. [2020-11-28].https://cran.r-project.org/package=vegan [52] OVERPECK J T, WEBB T, PRENTICE I C, 1985. Quantitative interpretation of fossil pollen spectra: Dissimilarity coefficients and the method of modern analogs[J]. Quaternary Research, 23(1): 87-108. doi: 10.1016/0033-5894(85)90074-2 [53] PEI Q M, MA Y Z, HU C L, et al. , 2016. Climatic character of Marine Isotope Stage (MIS) 5e in the representative regions of the world: A review[J]. Advances in Earth Science, 31(11): 1182-1196. (in Chinese with English abstract) [54] PETIT J R, JOUZEL J, RAYNAUD D, et al. , 1999. Climate and atmospheric history of the past 420, ;000 years from the Vostok ice core, Antarctica[J]. Nature, 399(6735): 429-436. doi: 10.1038/20859 [55] QIN F, ZHAO Y, 2013. Methods of quantitative climate reconstruction based on palynological data and their applications in China[J]. Quaternary Sciences, 33(6): 1054-1068. (in Chinese with English abstract) [56] QIN F, 2021. Modern pollen assemblages of the surface lake sediments from the steppe and desert zones of the Tibetan Plateau[J]. Science China Earth Sciences, 64(3): 425-439. doi: 10.1007/s11430-020-9693-y [57] REGATTIERI E, ISOLA I, ZANCHETTA G, et al. , 2012. Stratigraphy, petrography and chronology of speleothem deposition at Tana che Urla (Lucca, Italy): Paleoclimatic implications[J]. Geografia Fisica e Dinamica Quaternaria, 35(2): 141-152. [58] SIMPSON G L, OKSANEN J, 2021. Analogue: analogue matching and modern analogue technique transfer function models(R package version 0. 17-6)[EB/OL]. [2021-06-20].https://cran.r-project.org/package=analogue. [59] SUN J M, DING Z L, 1998. Deposits and soils of the past 130, 000 years at the desert–loess transition in Northern China[J]. Quaternary Research, 50(2): 148-156. doi: 10.1006/qres.1998.1989 [60] SUN X J, DU N Q, WONG C Y, et al. , 1994. Paleovegetation and paleoenvironment of Manasi Lake, Xinjiang, N. W. China during the last 14000 years[J]. Quaternary Sciences, 14(3): 239-248. (in Chinese with English abstract) [61] SUN X J, LUO Y L, 2001. Pollen record of the last 280 ka from deep sea sediments of the northern South China Sea[J]. Science in China Series D: Earth Sciences, 44(10): 879-888. doi: 10.1007/BF02907079 [62] TANG Z H, DU S S, LIU F L, 2017. Late Pleistocene changes in vegetation and the associated human activity at Beiyao Site, Central China[J]. Review of Palaeobotany and Palynology, 244: 107-112. doi: 10.1016/j.revpalbo.2017.04.002 [63] TER BRAAK C J F, BARENDREGT L G, 1986. Weighted averaging of species indicator values: Its efficiency in environmental calibration[J]. Mathematical Biosciences, 78(1): 57-72. doi: 10.1016/0025-5564(86)90031-3 [64] TER BRAAK C J F, LOOMAN C W N, 1986. Weighted averaging, logistic regression and the Gaussian response model[J]. Vegetatio, 65(1): 3-11. doi: 10.1007/BF00032121 [65] TER BRAAK C J F, JUGGINS S, 1993. Weighted averaging partial least squares regression (WA-PLS): an improved method for reconstructing environmental variables from species assemblages[J]. Hydrobiologia, 269(1): 485-502. [66] TIAN Y Y, ZHOU Z, CHI C T, et al. , 2020. The paleoclimate change period of the Late Pliocene-Early Pleistocene recorded by pollen from core PL02 in Yinchuan Basin[J]. Quaternary Sciences, 40(6): 1418-1430. (in Chinese with English abstract) [67] TONG G B, SHI Y, FAN S X, et al. , 1995a. Environment features of Yinchuan Basin in Late Quaternary period[J]. Earth Science, 4(4): 421-426. (in Chinese with English abstract) [68] TONG G B, ZHENG H R, YANG Z J, et al. , 1995b. Multicyclic model of palynoflora climate since 4 Ma in China[J]. Marine Geology & Quaternary Geology, 15(4): 81-96. (in Chinese with English abstract) [69] VERES D, BAZIN L, LANDAIS A, et al. , 2013. The Antarctic ice core chronology (AICC2012): an optimized multi-parameter and multi-site dating approach for the last 120 thousand years[J]. Climate of the Past, 9(4): 1733-1748. doi: 10.5194/cp-9-1733-2013 [70] WANG F X, QIAN N F, ZHANG Y L, et al. , 1995. Pollen flora of China[M]. 2nd ed. Beijing: Science Press. (in Chinese) [71] WANG H C, 2022. Variation of Asian summer monsoon intensity in late MIS6 derived from grayscale and Mg/Ca, Sr/Ca, Ba/Ca records of a stalagmite in Wanxiang Cave, eastern Qinghai-Tibet Plateau[D]. Lanzhou: Lanzhou University. (in Chinese with English abstract) [72] WANG Y J, CHENG H, EDWARDS R L, et al. , 2008. Millennial- and orbital-scale changes in the East Asian monsoon over the past 224, 000 years[J]. Nature, 451(7182): 1090-1093. doi: 10.1038/nature06692 [73] WANG Y J, LIU D B, 2016. Speleothem records of Asian paleomonsoon variability and mechanisms[J]. Chinese Science Bulletin, 61(9): 938-951. (in Chinese with English abstract) doi: 10.1360/N972015-01022 [74] WANG Z B, WANG J Y, HE L L, et al. , 2021. Characteristics and evolution process of the ridge-groove sequence of the Jiulongtan glacial accumulation in Mengshan, Shandong: with the discussion on the difference of accumulation sequence of glacier and debris flow[J]. Journal of Geomechanics, 27(1): 105-116,doi: 10.12090/j.issn.1006-6616.2021.27.01.011. (in Chinese with English abstract) [75] WEI L J, 2021. Cenozoic paleontological characteristics and paleoenvironment of King George Island, West Antarctica[J]. Journal of Geomechanics, 27(5): 855-866,doi: 10.12090/j.issn.1006-6616.2021.27.05.069. (in Chinese with English abstract) [76] WEI L J, LI Z H, LI M T, et al. , 2023. Palynological records and paleoclimatic significance during the middle and late Late Pleistocene in the Qingshuihe Basin, Ningxia[J]. Journal of Geomechanics,doi: 10.12090/j.issn.1006-6616.2023015. (in Chinese with English abstract) [77] WEN R L, XIAO J L, MA Y Z, et al. , 2013. Pollen–climate transfer functions intended for temperate eastern Asia[J]. Quaternary International, 311: 3-11. doi: 10.1016/j.quaint.2013.04.025 [78] XU K K, YANG Z J, NING K, et al. , 2021. MIS6—MIS5 climate change of Yinchuan Basin based on end-member method[J]. Geoscience, 35(5): 1311-1322. (in Chinese with English abstract) [79] XU Q H, LI Y C, BUNTING M J, et al. , 2010. The effects of training set selection on the relationship between pollen assemblages and climate parameters: Implications for reconstructing past climate[J]. Palaeogeography, Palaeoclimatology, Palaeoecology, 289(1-4): 123-133. doi: 10.1016/j.palaeo.2010.02.024 [80] XUE C F, HOU W, ZHAO J H, et al. , 2013. The application of ensemble empirical mode decomposition method in multiscale analysis of region precipitation and its response to the climate change[J]. Acta Physica Sinica, 62(10): 109203. (in Chinese with English abstract) doi: 10.7498/aps.62.109203 [81] YANG X D, WANG S M, TONG G B, et al. , 1998. The Late Pleistocene pollen record in the lake sediments from ancient Heqing Lake and its significance for palaeoclimate[J]. Quaternary Sciences, 18(4): 335-343. (in Chinese with English abstract) [82] YANG Z J, LIU Z M, ZHANG J P, et al. , 2001a. Sporopollen records and paleocl imate study of Yinchuan Basin since mid-Pleistocene[J]. Marine Geology & Quaternary Geology, 21(3): 43-49. (in Chinese with English abstract) [83] YANG Z J, ZHENG H R, TONG G B, et al. , 2001b. Study on palynoflora and paleoclimatic cycles since Mid-Pleistocene in Yinchuan Basin[J]. Journal of Changchun University of Science and Technology, 31(3): 213-216. (in Chinese with English abstract) [84] YAO T D, 1999. Abrupt climatic changes on the Tibetan Plateau during the Last Ice Age: comparative study of the Guliya ice core with the Greenland GRIP ice core[J]. Science China Earth Sciences, 42(4): 358-368. [85] ZHANG Q, HAN Y X, SONG L C, 2005. The summarize of development of global climate change and its effect factors[J]. Advances in Earth Science, 20(9): 990-998. (in Chinese with English abstract) [86] ZHANG X F, LI J J, ZHANG X B, et al. , 2021. Evolution of the climate and sedimentary environment since the Middle Pleistocene on the Northwestern Coast of the Bohai Bay[J]. Acta Geologica Sinica, 95(6): 1868-1888. (in Chinese with English abstract) [87] ZHAO H, HUANG W, XIE T T, et al. , 2019. Optimization and evaluation of a monthly air temperature and precipitation gridded dataset with a 0.025° spatial resolution in China during 1951-2011[J]. Theoretical and Applied Climatology, 138(1-2): 491-507. doi: 10.1007/s00704-019-02830-y [88] ZHAO Y, TZEDAKIS P C, LI Q, et al. , 2020. Evolution of vegetation and climate variability on the Tibetan Plateau over the past 1.74 million years[J]. Science Advances, 6(19): eaay6193,doi: 10.1126/sciadv.aay6193. [89] ZHAO Y, LIANG C, CUI Q Y, et al. , 2021. Temperature reconstructions for the last 1.74-Ma on the eastern Tibetan Plateau based on a novel pollen-based quantitative method[J]. Global and Planetary Change, 199: 103433,doi: 10.1016/j.gloplacha.2021.103433. [90] 陈海燕, 徐德宇, 廖梦娜, 等, 2021. 中国现代花粉数据集[J]. 植物生态学报, 45(7): 799-808. [91] 陈建徽, 吕飞亚, 黄小忠, 等, 2018. 基于孢粉的古气候参数定量重建: 一种新思路及其在中国的应用实例[J]. 中国科学: 地球科学, 48(1): 42-50. [92] 丁仲礼, 刘东生, 刘秀铭, 等, 1989. 250万年以来的37个气候旋迴[J]. 科学通报, 34(19): 1494-1496. [93] 范淑贤, 郑宏瑞, 刘平贵, 等, 2002. 银川盆地晚第四纪孢粉记录的快速气候波动事件[J]. 中国地质, 29(4): 431-434. [94] 管东红, 奚晓霞, 郝永萍, 等, 1996. 北塬剖面碳酸钙记录的末次间冰期气候不稳定性[J]. 冰川冻土, 18(2): 119-124. [95] 黄康有, 魏金辉, 陈碧珊, 2013. 最佳类比法的孢粉-古气候定量重建研究进展[J]. 第四纪研究, 33(6): 1069-1079. [96] 黄小忠, 向丽雄, 张恩源, 等, 2019. 全新世中期7ka前后降温事件对中国北方植被生态的影响[J]. 第四纪研究, 39(3): 687-700. [97] 姜修洋, 孔兴功, 汪永进, 等, 2011. 神农架三宝洞倒数第二次冰期高分辨率石笋δ13C记录[J]. 第四纪研究, 31(1): 1-7. [98] 梁琛, 赵艳, 秦锋, 等, 2020. 孢粉—气候定量重建方法体系的建立及其应用: 以青藏高原东部全新世温度重建为例[J]. 中国科学: 地球科学, 50(7): 977-994. [99] 刘平贵, 范淑贤, 李雪菊, 2000. 银川盆地第四纪地球化学元素特征及沉积环境[J]. 地质力学学报, 6(4): 43-50, 94. [100] 陆浩, 贾佳, 夏敦胜, 等, 2015. 黄土高原记录的MIS 6.5期东亚夏季风信号及其古气候意义[J]. 第四纪研究, 35(6): 1402-1411. doi: 10.11928/j.issn.1001-7410.2015.06.09 [101] 明艳芳, 2004. 初探MIS6东亚夏季风亚轨道尺度气候变化[D]. 南京: 南京师范大学. [102] 裴巧敏, 马玉贞, 胡彩莉, 等, 2016. 全球典型地区MIS5e阶段气候特征研究进展[J]. 地球科学进展, 31(11): 1182-1196. doi: 10.11867/j.issn.1001-8166.2016.11.1182 [103] 秦锋, 赵艳, 2013. 基于孢粉组合定量重建古气候的方法在中国的运用及思考[J]. 第四纪研究, 33(6): 1054-1068. doi: 10.3969/j.issn.1001-7410.2013.06.02 [104] 秦锋, 2021. 青藏高原草原带和荒漠带湖泊表层沉积物现代花粉研究[J]. 中国科学: 地球科学, 51(3): 437-452. [105] 孙湘君, 杜乃秋, 翁成郁, 等, 1994. 新疆玛纳斯湖盆周围近14000年以来的古植被古环境[J]. 第四纪研究, 14(3): 239-248. doi: 10.3321/j.issn:1001-7410.1994.03.005 [106] 田晏嫣, 周助, 迟长婷, 等, 2020. 银川盆地PL02钻孔孢粉记录的晚上新世-早更新世时期的古气候变化周期[J]. 第四纪研究, 40(6): 1418-1430. doi: 10.11928/j.issn.1001-7410.2020.06.04 [107] 童国榜, 石英, 范淑贤, 等, 1995a. 银川盆地晚第四纪环境特征[J]. 地球科学, 4(4): 421-426. [108] 童国榜, 郑宏瑞, 杨振京, 等, 1995b. 中国4 Ma来孢粉植物群气候的多重旋回模型[J]. 海洋地质与第四纪地质, 15(4): 81-96. [109] 王伏雄, 钱南芬, 张玉龙等, 1995. 中国植物花粉形态[M]. 2版. 北京: 科学出版社. [110] 王海川, 2022. 青藏高原东部万象洞石笋灰度与Mg/Ca、Sr/Ca、Ba/Ca记录推演的MIS6晚期亚洲夏季风变化[D]. 兰州: 兰州大学. [111] 汪永进, 刘殿兵, 2016. 亚洲古季风变率和机制的洞穴石笋档案[J]. 科学通报, 61(9): 938-951. [112] 王照波, 王江月, 何乐龙, 等, 2021. 山东蒙山九龙潭冰川堆积“垄槽序列”的特征及演化过程研究: 兼论冰川、泥石流堆积序列的差异性[J]. 地质力学学报, 27(1): 105-116,doi: 10.12090/j.issn.1006-6616.2021.27.01.011. [113] 韦利杰, 2021. 西南极乔治王岛新生代古生物特征及古环境探讨[J]. 地质力学学报, 27(5): 855-866,doi: 10.12090/j.issn.1006-6616.2021.27.05.069. [114] 韦利杰, 李振宏, 李明涛, 等, 2023. 宁夏清水河盆地晚更新世中晚期孢粉记录及古气候意义[J]. 地质力学学报, doi: 10.12090/j.issn.1006-6616.2023015. [115] 许可可, 杨振京, 宁凯, 等, 2021. 基于端元法的银川盆地MIS6—MIS5气候变化探究[J]. 现代地质, 35(5): 1311-1322. [116] 薛春芳, 侯威, 赵俊虎, 等, 2013. 集合经验模态分解在区域降水变化多尺度分析及气候变化响应研究中的应用[J]. 物理学报, 62(10): 109203. doi: 10.7498/aps.62.109203 [117] 羊向东, 王苏民, 童国榜, 等, 1998. 云南鹤庆古湖晚更新世的孢粉记录及其古气候学意义[J]. 第四纪研究, 18(4): 335-343. doi: 10.3321/j.issn:1001-7410.1998.04.006 [118] 杨振京, 刘志明, 张俊牌, 等, 2001a. 银川盆地中更新世以来的孢粉记录及古气候研究[J]. 海洋地质与第四纪地质, 21(3): 43-49. [119] 杨振京, 郑宏瑞, 童国榜, 等, 2001b. 银川盆地中更新世以来的孢粉植物群古气候旋回探讨[J]. 长春科技大学学报, 31(3): 213-216. [120] 姚檀栋, 1999. 末次冰期青藏高原的气候突变: 古里雅冰芯与格陵兰GRIP冰芯对比研究[J]. 中国科学(D辑), 29(2): 175-180. [121] 张强, 韩永翔, 宋连春, 2005. 全球气候变化及其影响因素研究进展综述[J]. 地球科学进展, 20(9): 990-998. [122] 张晓飞, 李继军, 张学斌, 等, 2021. 渤海湾西北岸中更新世中期以来的气候环境和沉积环境演变[J]. 地质学报, 95(6): 1868-1888. doi: 10.3969/j.issn.0001-5717.2021.06.014 -


 下载:
下载:


