

InSAR deformation observation and regional severe earthquake hazard analysis of the 2016 and 2022 strong earthquake activities in Menyuan, Qinghai
-
摘要: 30多年来青海省门源县先后经历了3次强震,显现出活跃的地震活动。3次地震的震源机制存在显著差异,且震中均位于冷龙岭断层附近。为定量分析门源地震序列的活动特征,利用InSAR技术测量2016年和2022年门源地震引发的地表形变,详细分析了同震形变场的空间特征及发震断层,并据此建立了断层模型,通过最速下降法(SDM)获得2次地震的精细滑动分布,最后基于静态库仑应力变化评估了2022年门源MW 6.6地震对该区域及周边断层的应力扰动。研究发现2016年地震同震形变场表现为单一的椭圆隆升中心,运动属性以逆冲为主;而2022年地震形变场空间分布较为复杂,呈Y型分布,破裂走向自西向东有轻微变化,以水平形变为主。2次地震的滑动模式和深浅构造样式也存在明显差异:2016年地震活动性弱,在深部8~12 km存在一个滑动区,最大滑动量仅有0.23 m,断层面倾角低,具有深部滑动特点;而2022年地震为典型的浅源地震,存在3个明显的滑动区域,主破裂发生在冷龙岭段,集中在浅部1~7 km,最大位错量为3.22 m,冷龙岭断层向西延伸段也发生了明显滑动,最大滑动量达到2.59 m,托莱山段破裂深度集中在3~8 km,最大滑动量为2.1 m。结合1986年门源地震活动分析,推断门源地震序列受冷龙岭断层活动支配,冷龙岭断层在北东向扩展以及挤压缩短的活动趋势中,不断适应新的构造和应力调整。2022年门源MW 6.6地震位错影响范围较大,地震危险性需持续关注和深入研究,尤其是静态库仑应力变化超过了危险性阈值的部分。Abstract:
Objective Over the past 30 years, Menyuan Country, Qinghai, has experienced three strong earthquakes, demonstrating active seismic activity. The focal mechanisms of these earthquakes showed remarkable differences and the epicenters were all located near the Lenglongling fault. Methods In order to quantitatively analyze the activity characteristics of the Menyuan seismic sequence using InSAR technology to obtain the coseismic deformation field of the Menyuan earthquake of 2016 and 2022 and establish an appropriate fault model, the fine slip distributions of the two earthquakes were obtained through steepest decent method (SDM). Furthermore, the static Coulomb stress changes on the faults in the region and its surroundings caused by the Menyuan Mw 6.6 earthquake in 2022 were evaluated. Results The coseismic deformation field in 2016 exhibited a single elliptical uplift center, with predominantly thrust motion. In contrast, the spatial distribution of the deformation field in 2022 was more complex, showing a Y-shaped distribution, and there was a slight variation in the rupture direction from west to east, with primarily horizontal deformation. Conclusion The two earthquakes also differed in their slip patterns and shallow and deep structural styles. In 2016, the seismic activity was weak, with a slip zone existing at depths between 8 km and 12 km, where the maximum slip was only 0.23 m. The fault plane had a low inclination angle, which is a characteristic of deep-seated slip. By contrast, the 2022 earthquake was a typical shallow-focus earthquake featuring three distinct slip areas. The primary rupture occurred in the Lenglongling section, concentrated in the shallow part from 1 km to 7 km, with a maximum displacement of 3.22 m. A significant slip also occurred along the western extension of the Lenglongling fault, reaching a maximum slip of 2.59 m. The Tuolaishan section experienced rupturing mainly between 3 km and 8 km, with the maximum slip recorded as 2.1 m. Significance Combined with the analysis of the Menyuan earthquake activity in 1986, it is inferred that the Menyuan earthquake sequence is dominated by the activity of the Lenglongling fault, which is continuously adapting to new structures and stress adjustments in its northeast extension and shows compressive-shortening activity trend. The 2022 Menyuan Mw 6.6 earthquake had a significant impact range, and earthquake hazards need to be continuously monitored and studied further, especially in areas where static Coulomb stress changes exceed the hazard threshold. -
Key words:
- Menyuan earthquake sequence /
- Lenlongling fault /
- InSAR /
- activity characteristics /
- coulomb stress
-
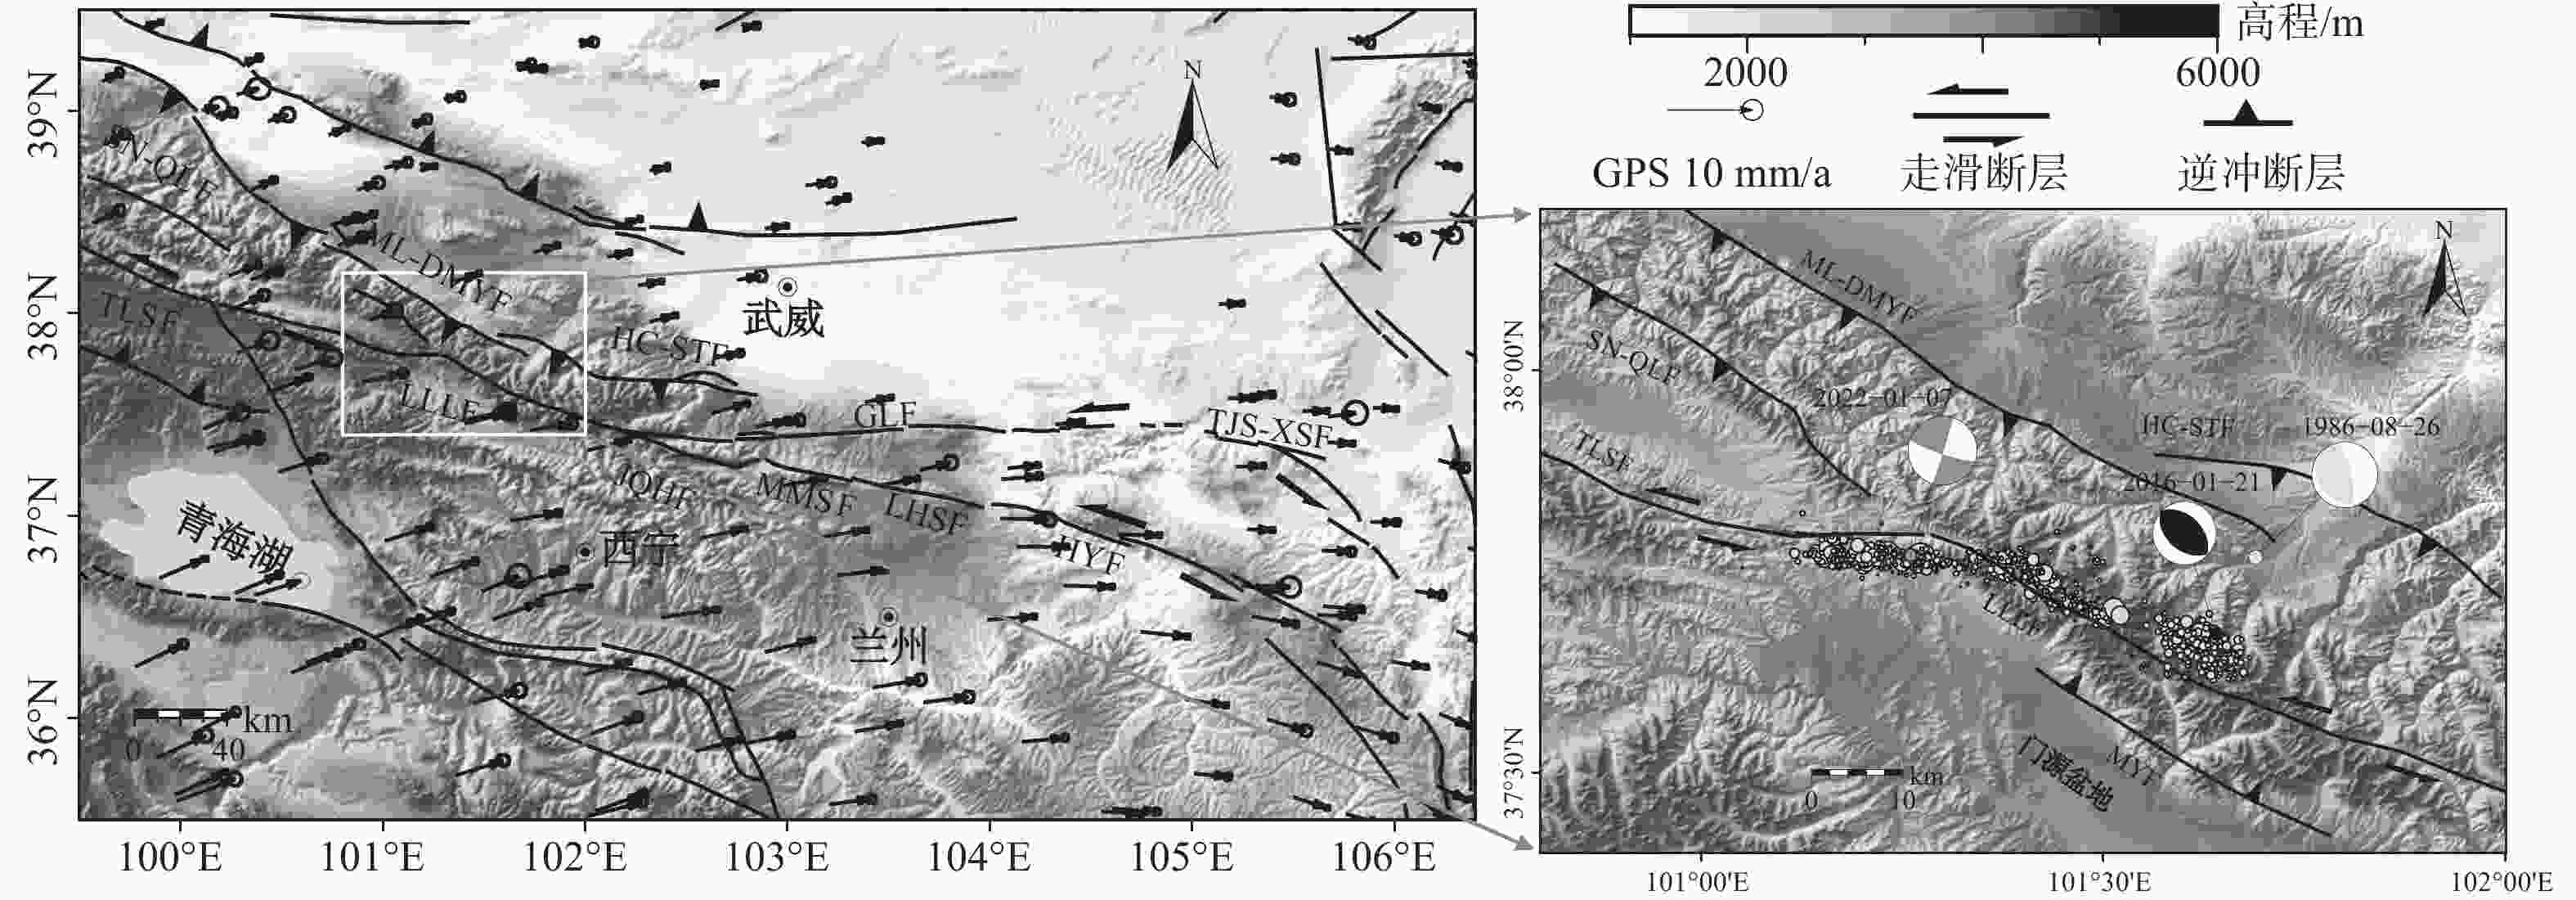
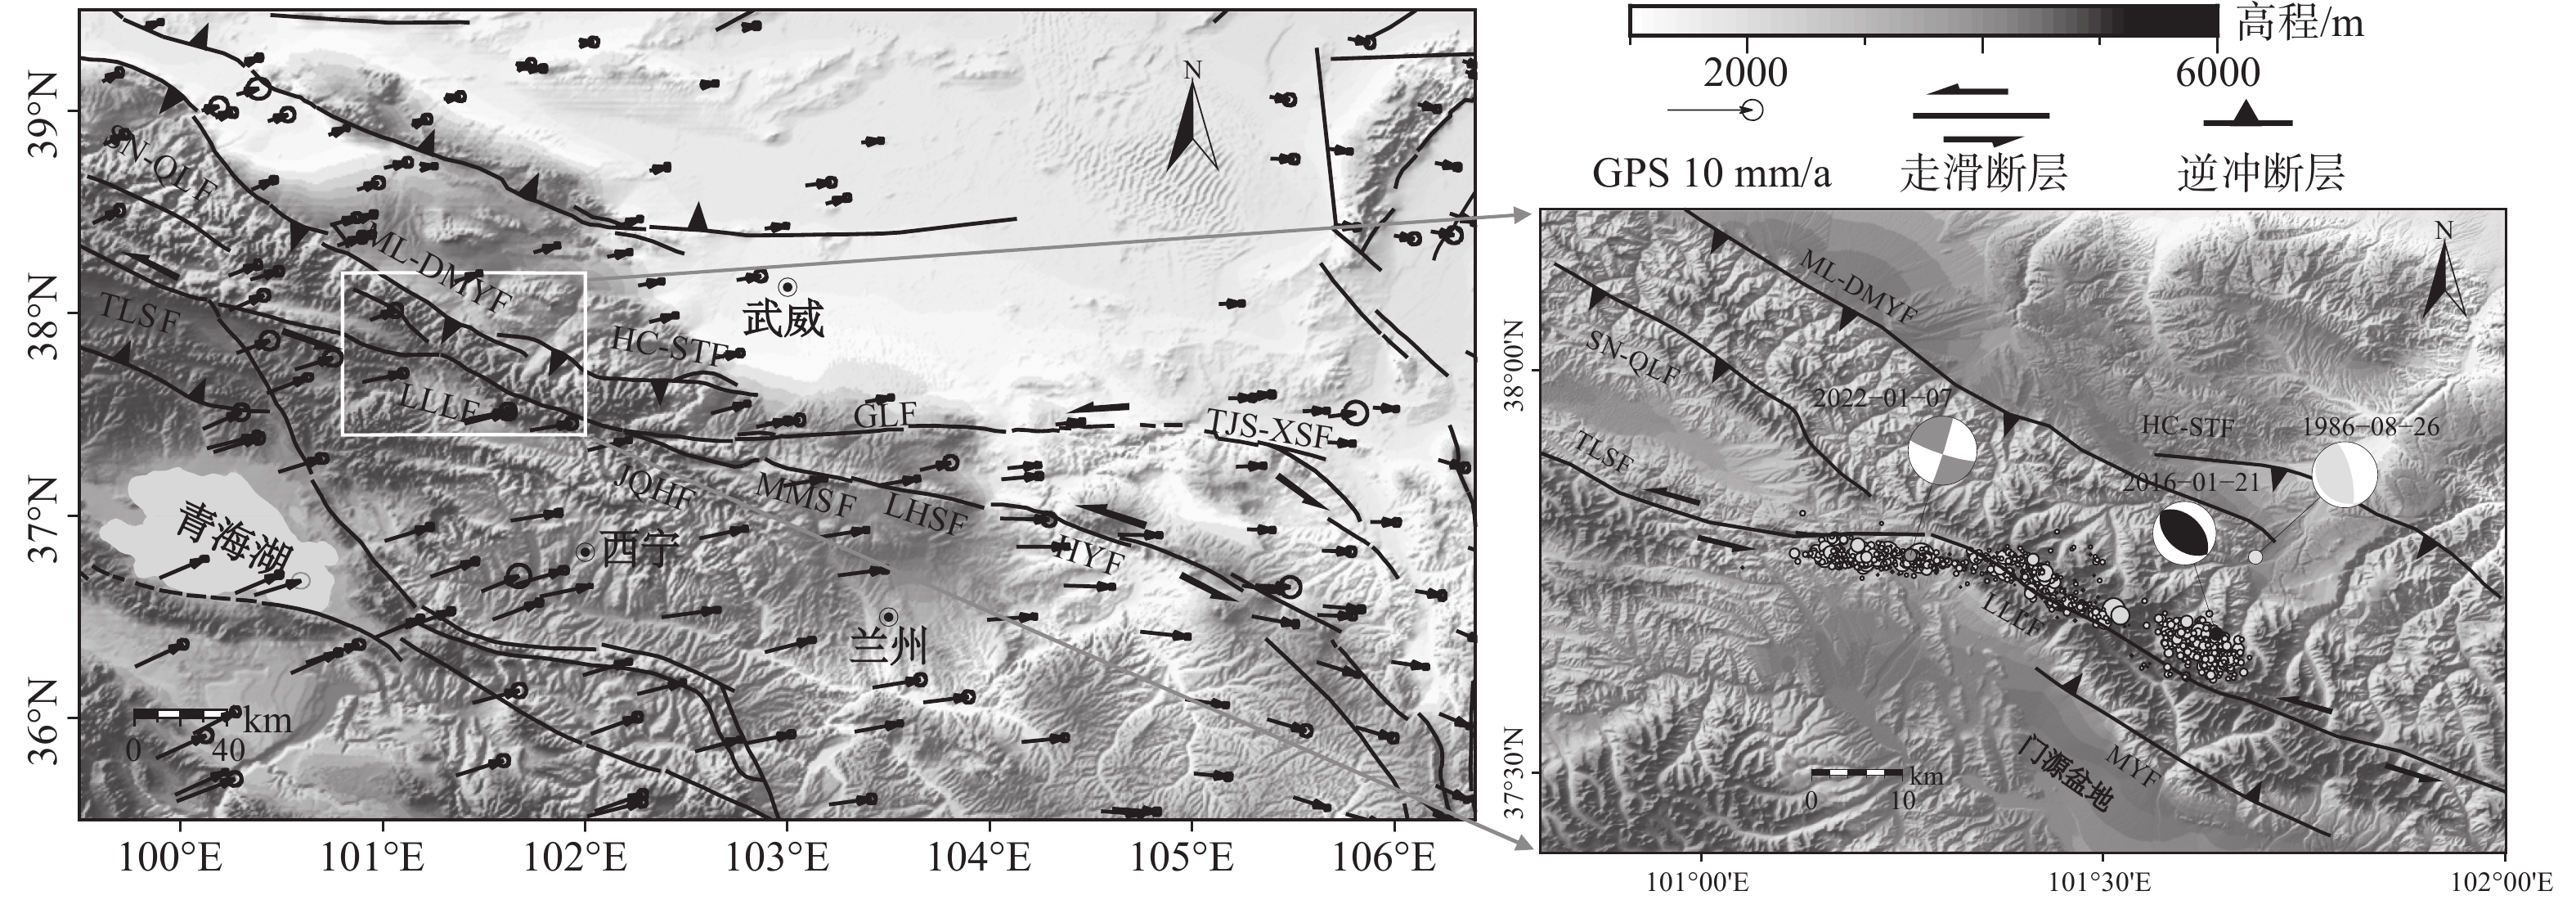
图 1 冷龙岭断层带及周边活动构造
箭头表示GPS速度场(数据来自Wang and Shen, 2020);3个沙滩球分别代表 2022年MW 6.6、2016年MW 5.9和1986年MW 5.9地震;圆点分别是Fan et al.(2022)和Liu et al.(2019)在2022和2016年地震中重新定位的余震TLSF—托莱山断层;LLLF—冷龙岭断层;JQHF—金强河断层;MMSF—毛毛山断层;HYF—海原断层;LHSF—老虎山断层;GLF—古浪断层 ;MYF—门源断层;SN-QLF—肃南−祁连断层;ML-DMY—民乐−大马营断层;HC-STF—皇城−双塔断层;TJS-XSF—天景山−香山断层
Figure 1. Lenglongling fault and surrounding active structures
The arrows represent the GPS velocity field (from Wang and Shen, 2020). Three colored beach balls represent the 2022 MW 6.6, 2016 MW 5.9, and 1986 MW 5.9 earthquakes; dots are the relocated aftershocks of the 2022 and 2016 earthquakes from Fan et al. (2022) and Liu et al. (2019) respectively. TLSF−Tuolaishan fault; LLLF−Lenglongling fault; JQHF−Jinqianghe fault; MMSF−Maomaoshan fault; HYF−Haiyuan fault; LHSF−Laohushan fault; GLF−Gulang fault; MYF−Menyuan fault; SN-QLF−Sunan-Qilian fault; ML-DMYF−Minle-Damayin fault; HC-STF− Huangcheng-Shuangta fault; TJS-XSF−Tianjingshan-Xiangshan fault
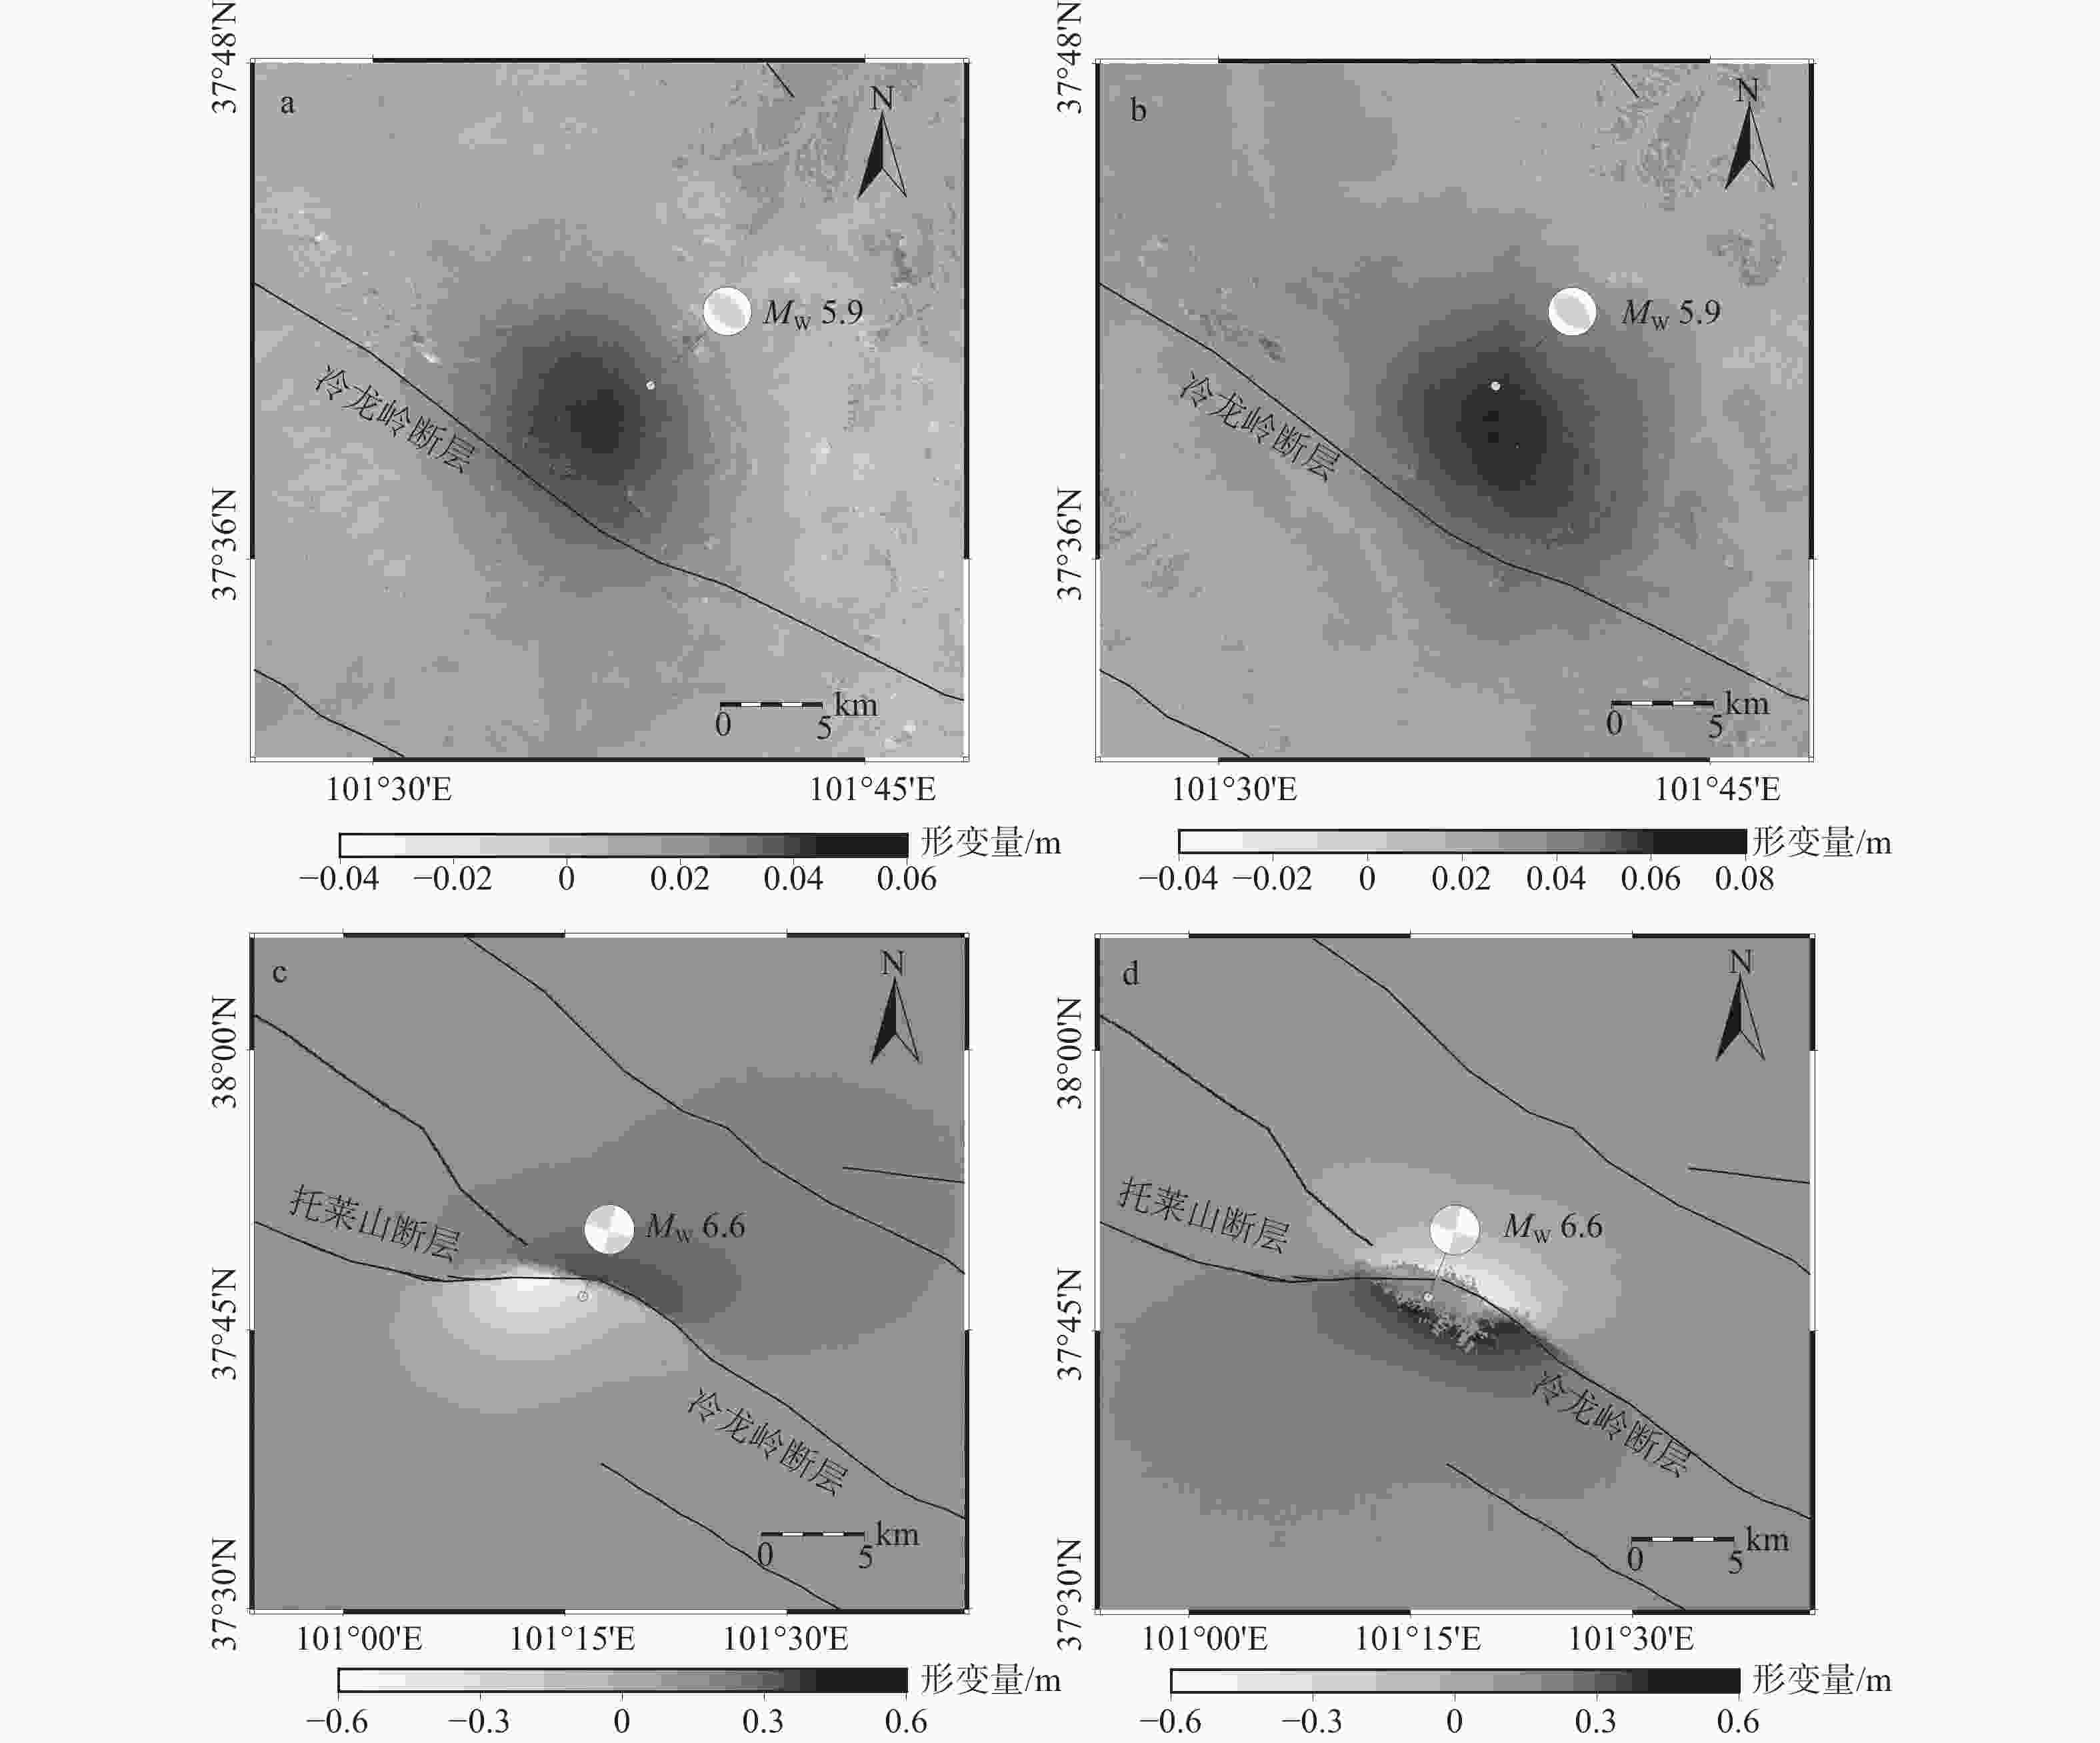
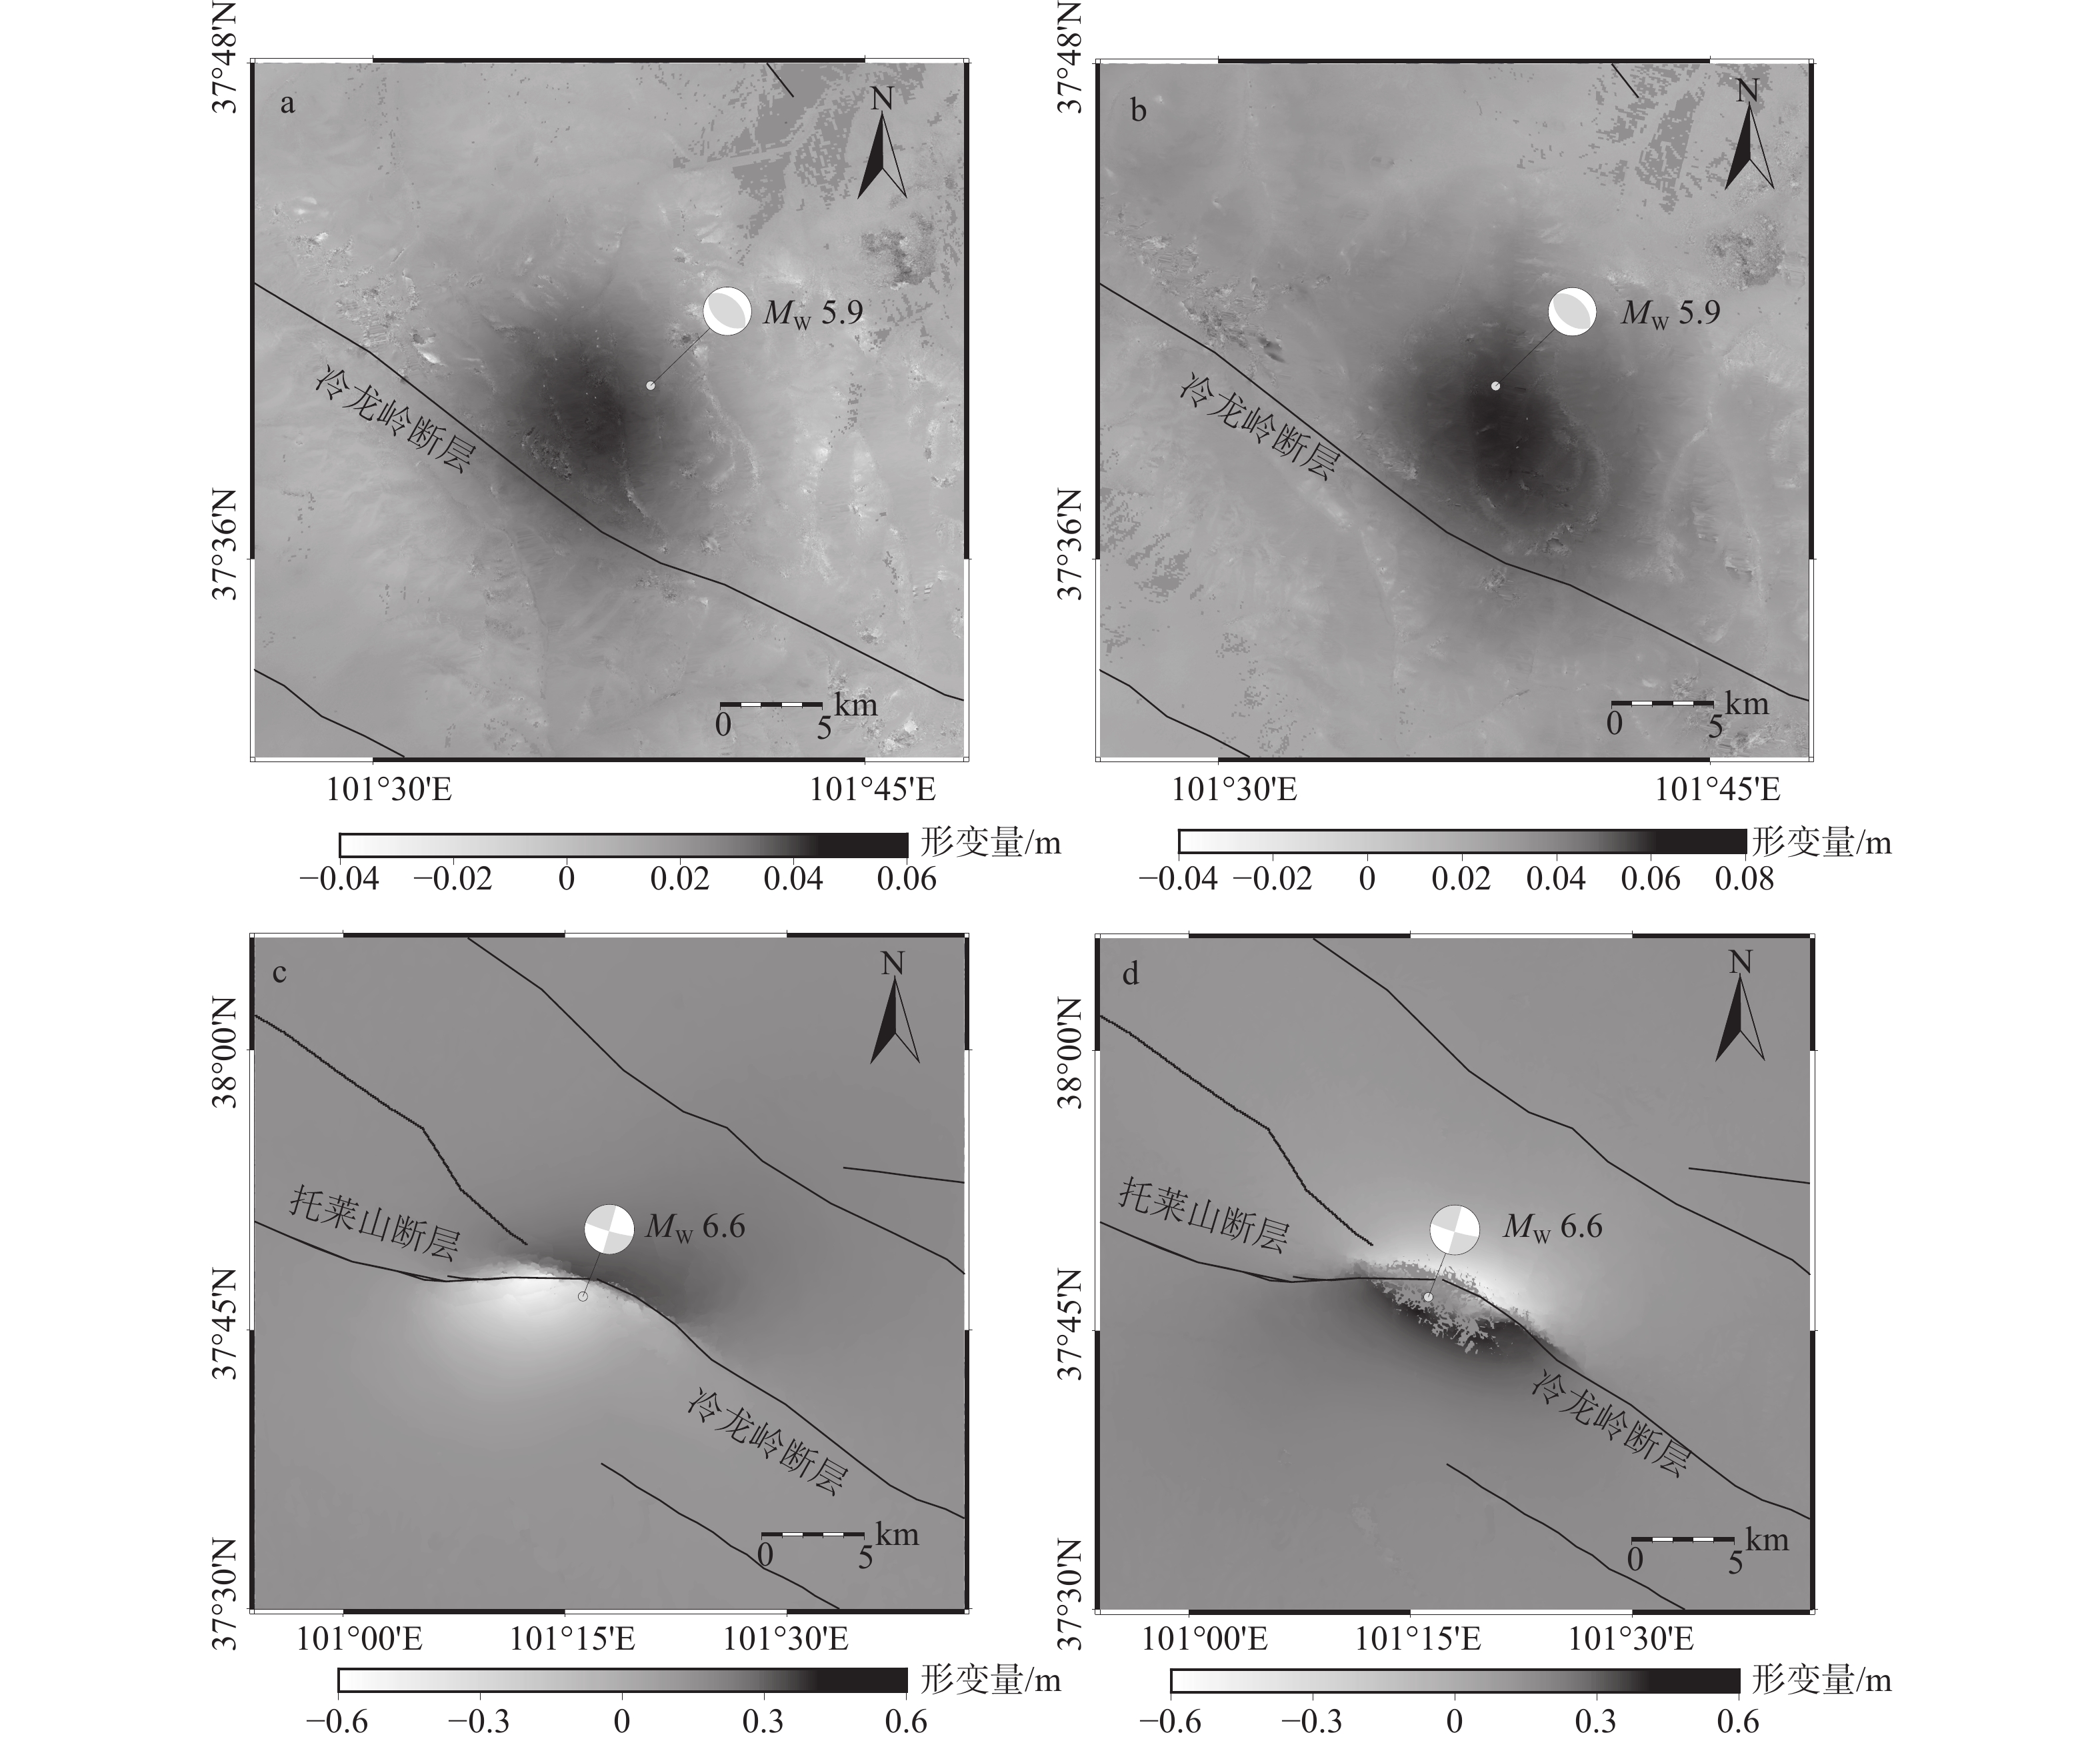
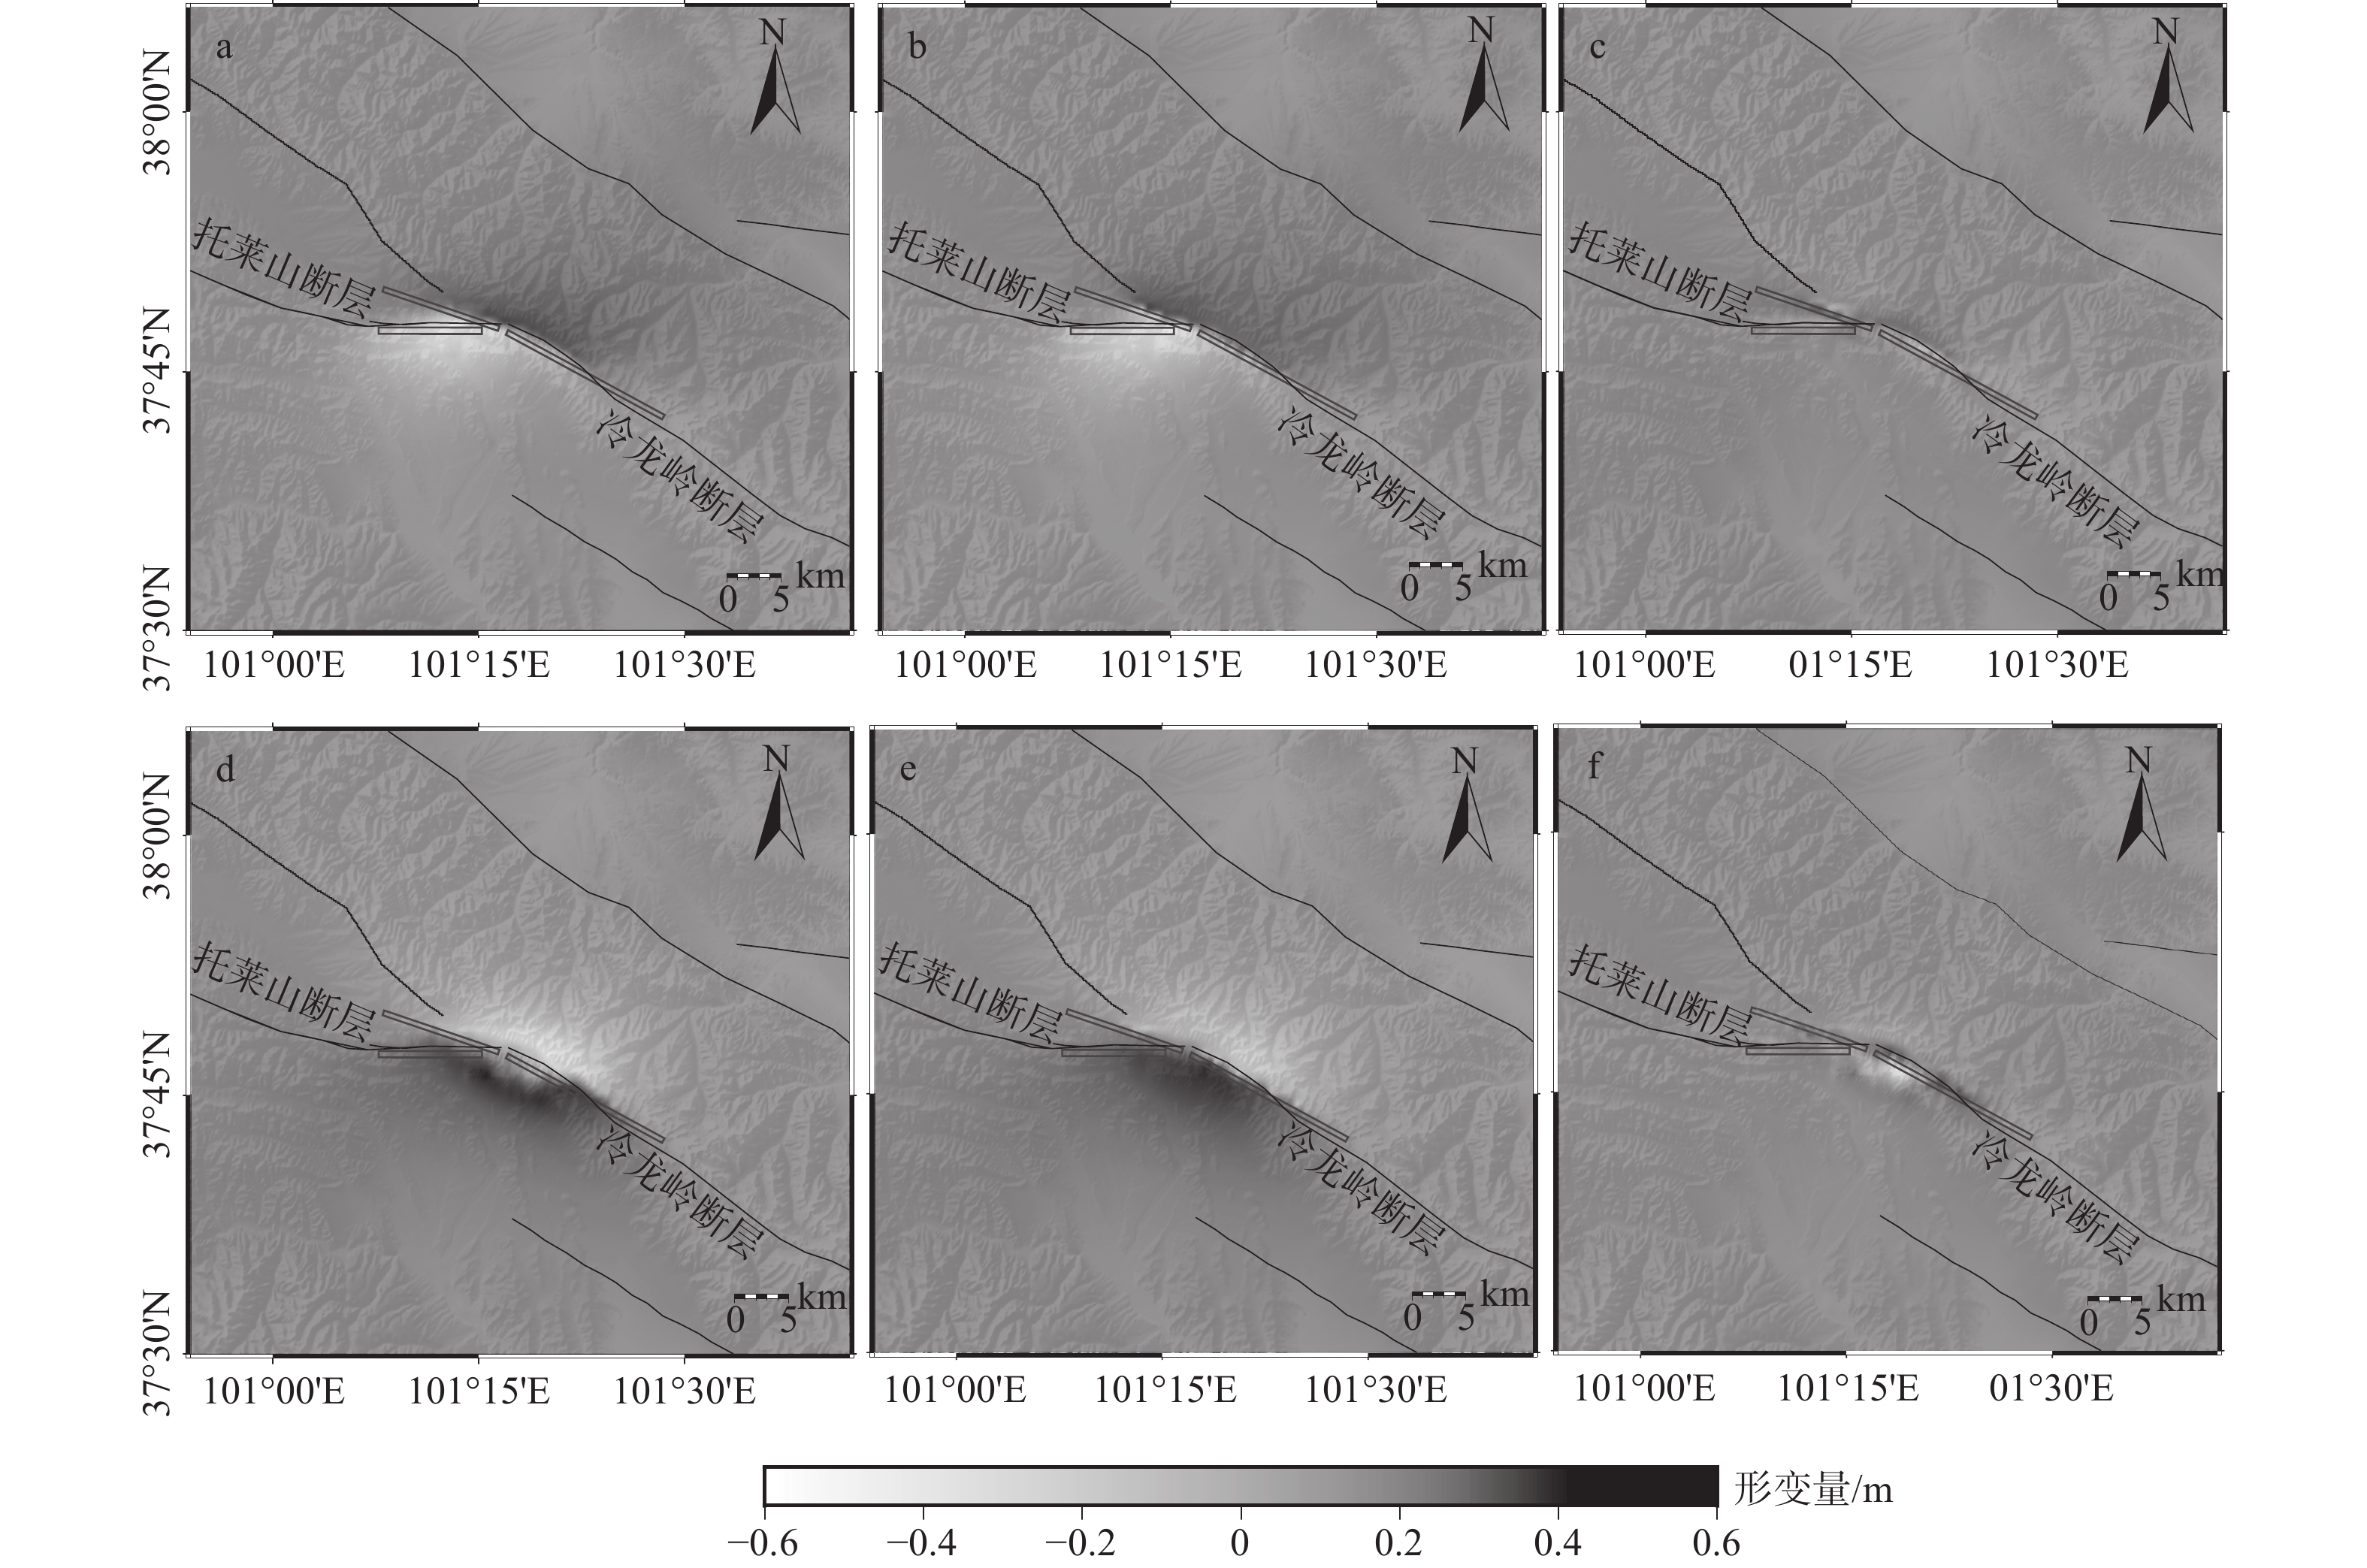
图 2 2016年MW 5.9和2022年MW 6.6同震形变场
黑色线段代表断层a—2016年升轨形变场;b— 2016年降轨形变场;c—2022年升轨形变场;d—2022年降轨形变场
Figure 2. Coseismic deformations of the 2016 MW 5.9 and 2022 MW 6.6 Menyuan earthquakes
(a) Coseismic deformations of ascending orbits in 2016; (b) Coseismic deformations of descending orbits in 2016; (c) Coseismic deformations of ascending orbits in 2022; (d) Coseismic deformations of descending orbits in 2022 Beach balls represent the 2016 MW 5.9 and 2022 MW 6.6 earthquakes, and black lines denote active faults.
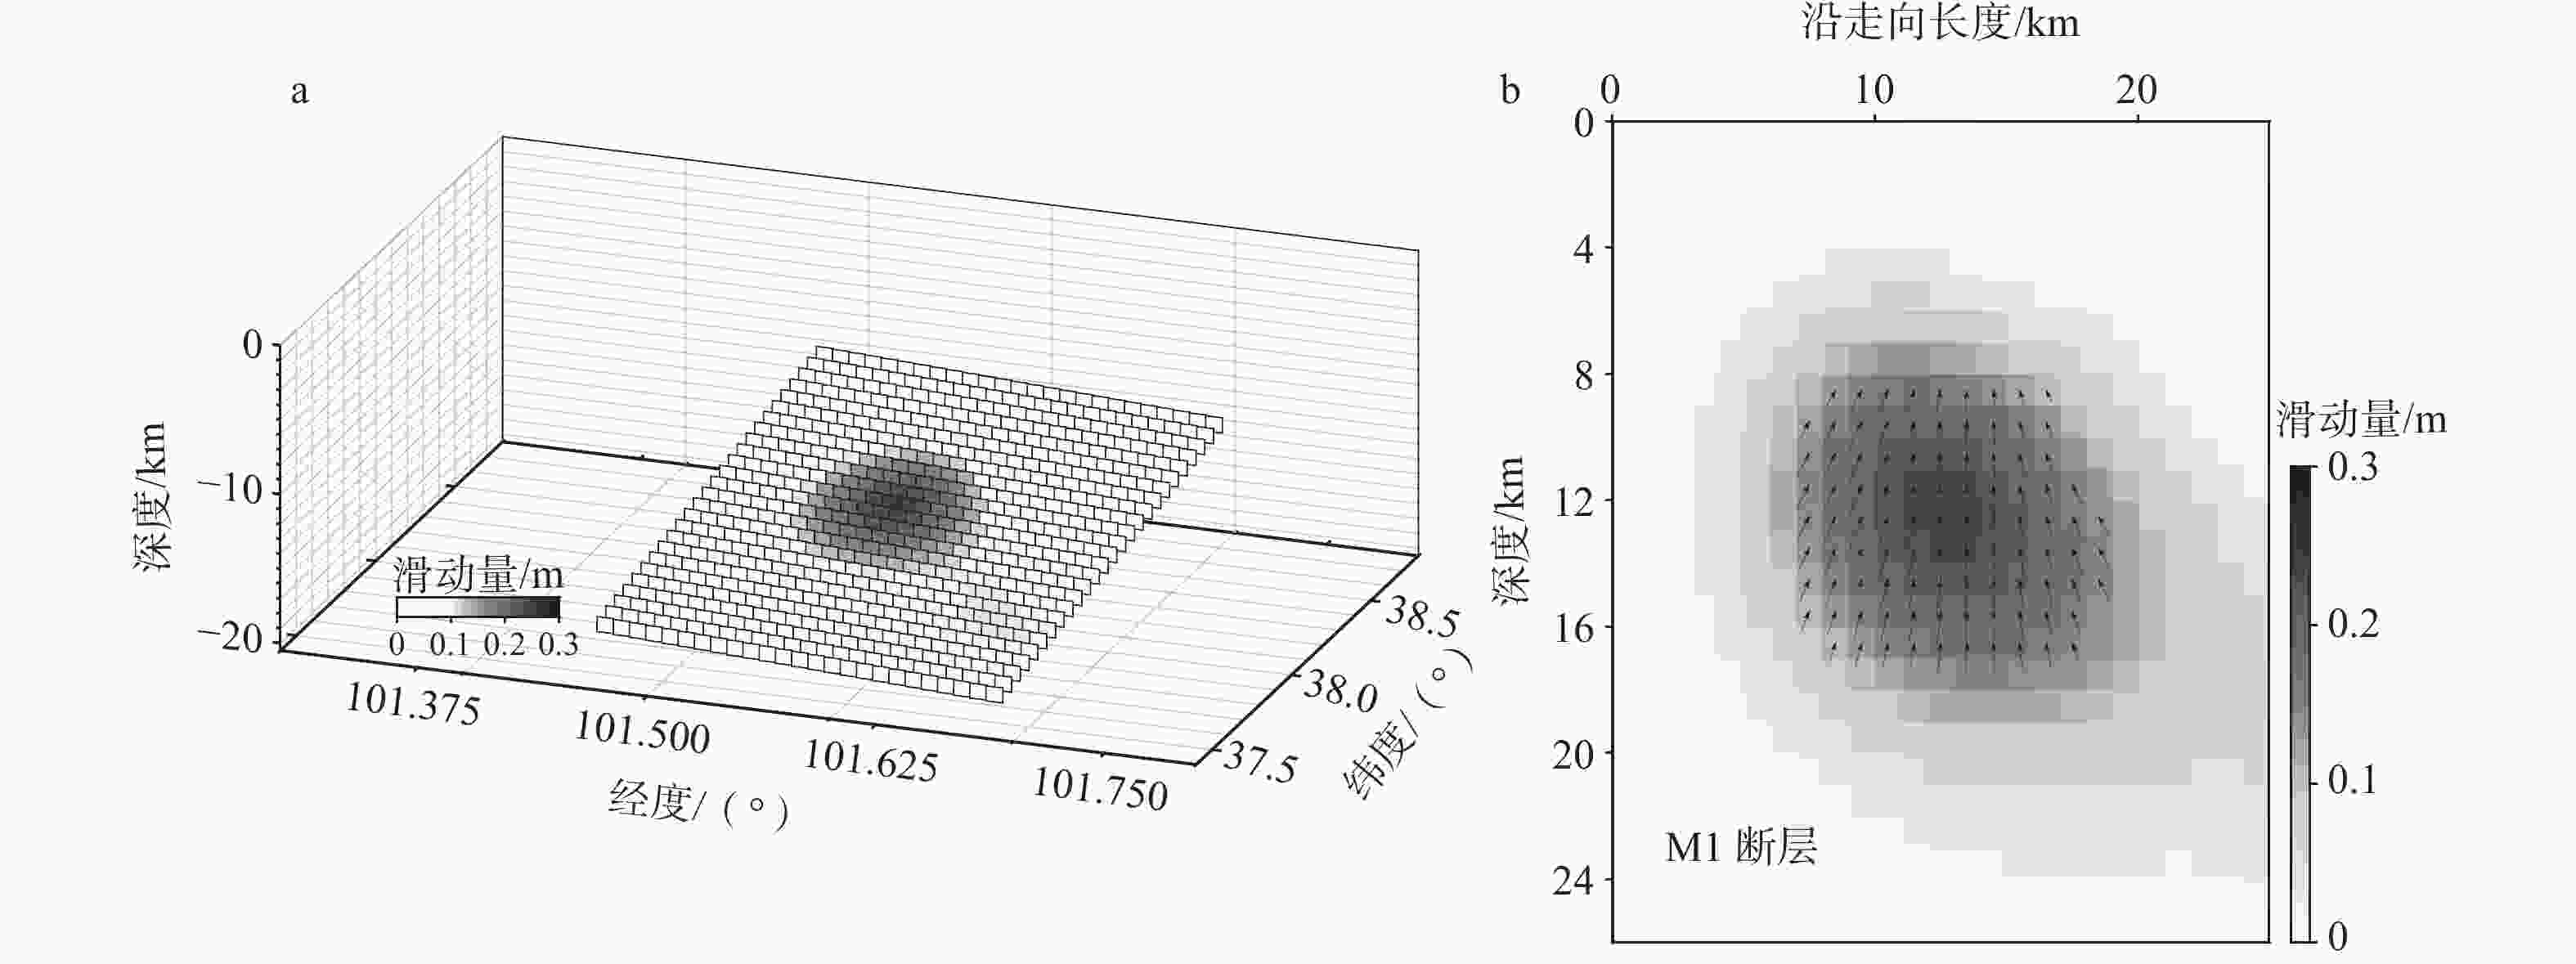
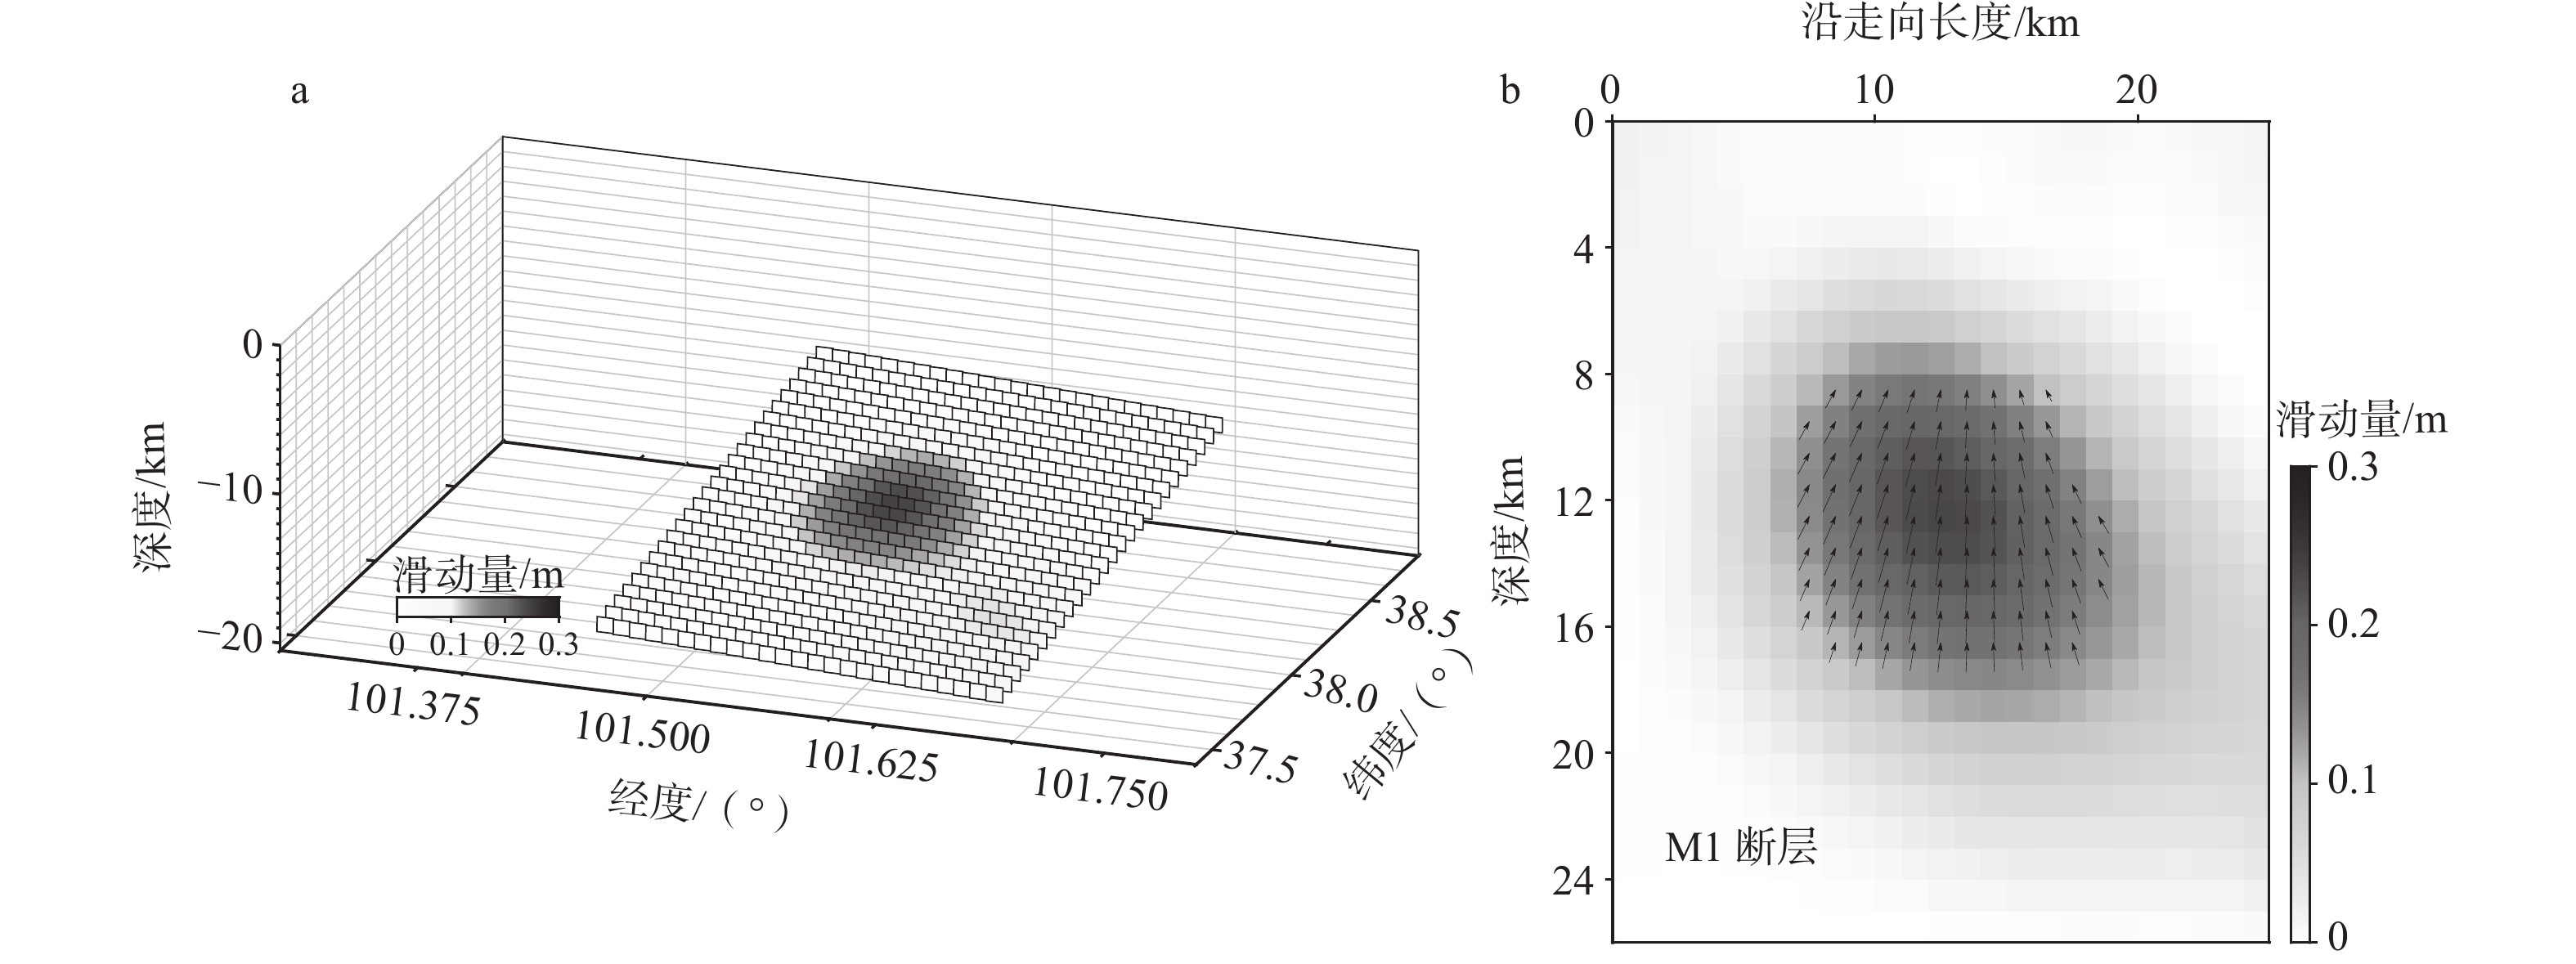
图 3 2016年MW 5.9门源地震断层滑动分布图
a—三维滑动分布模型;b—二维滑动分布模型
Figure 3. Slip distribution models of the 2016 MW 5.9 earthquake
(a) Three-dimensional (3D) slip distribution; (b) Two-dimensional (2D) slip distribution
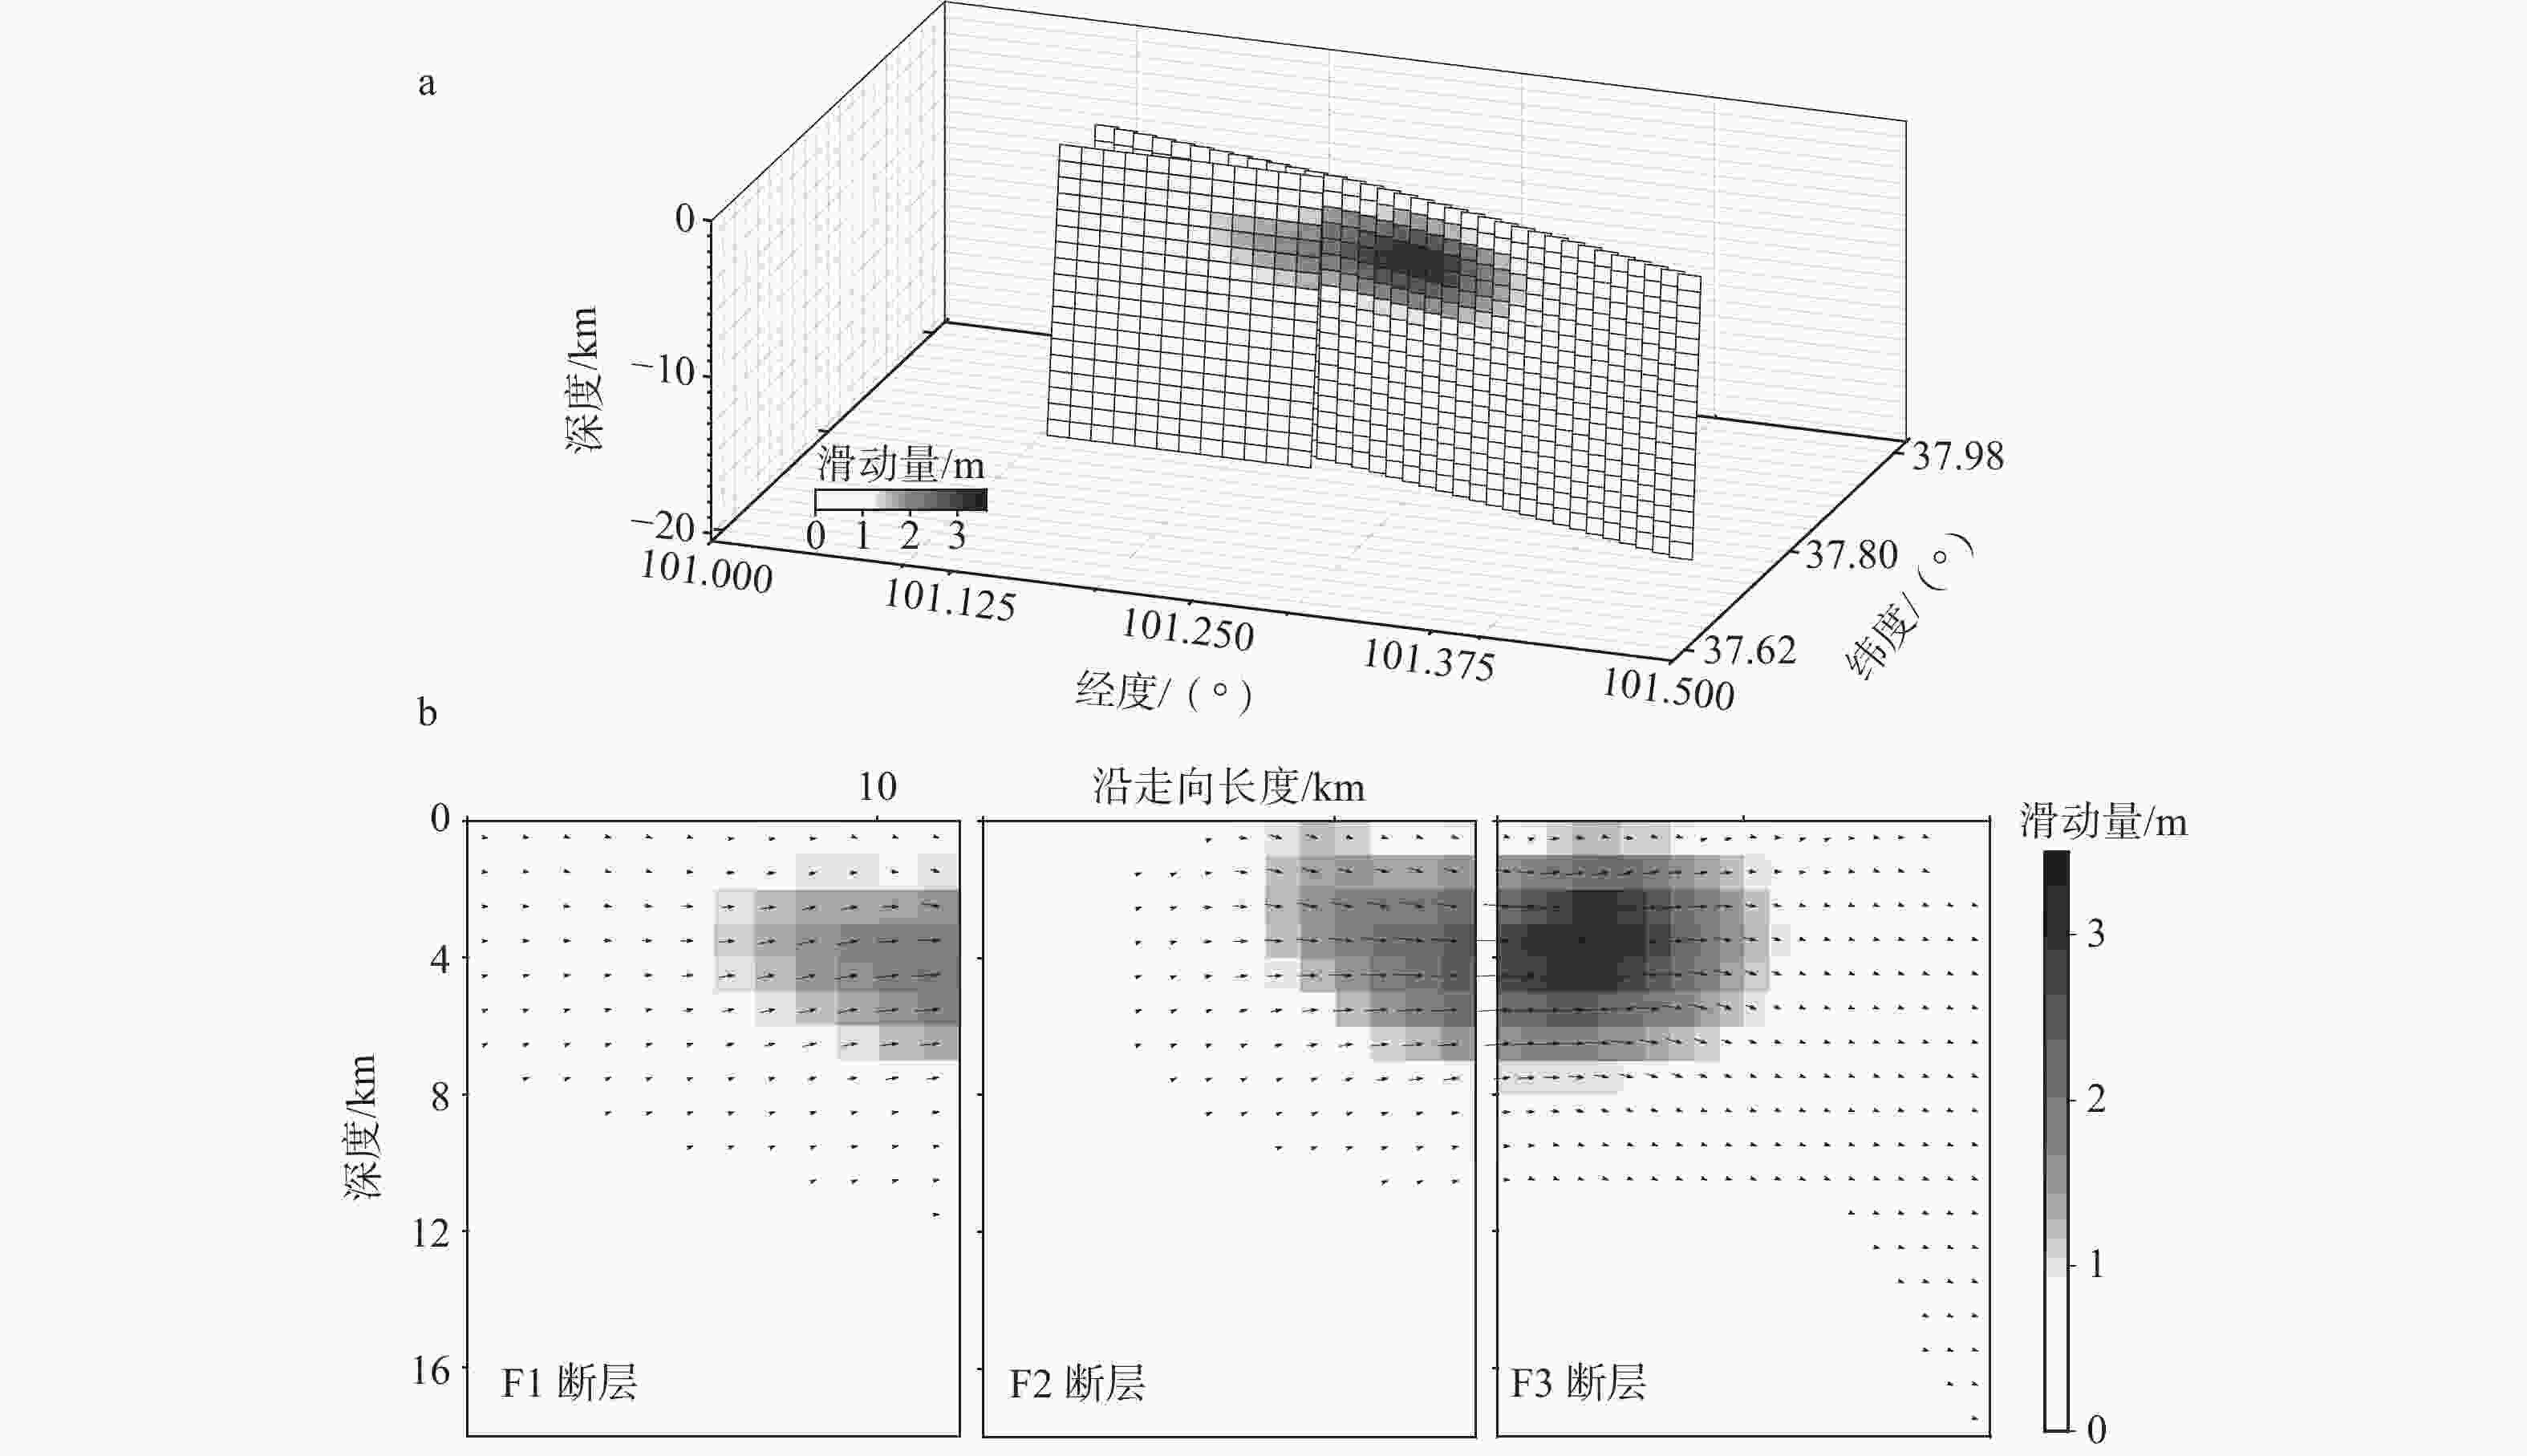
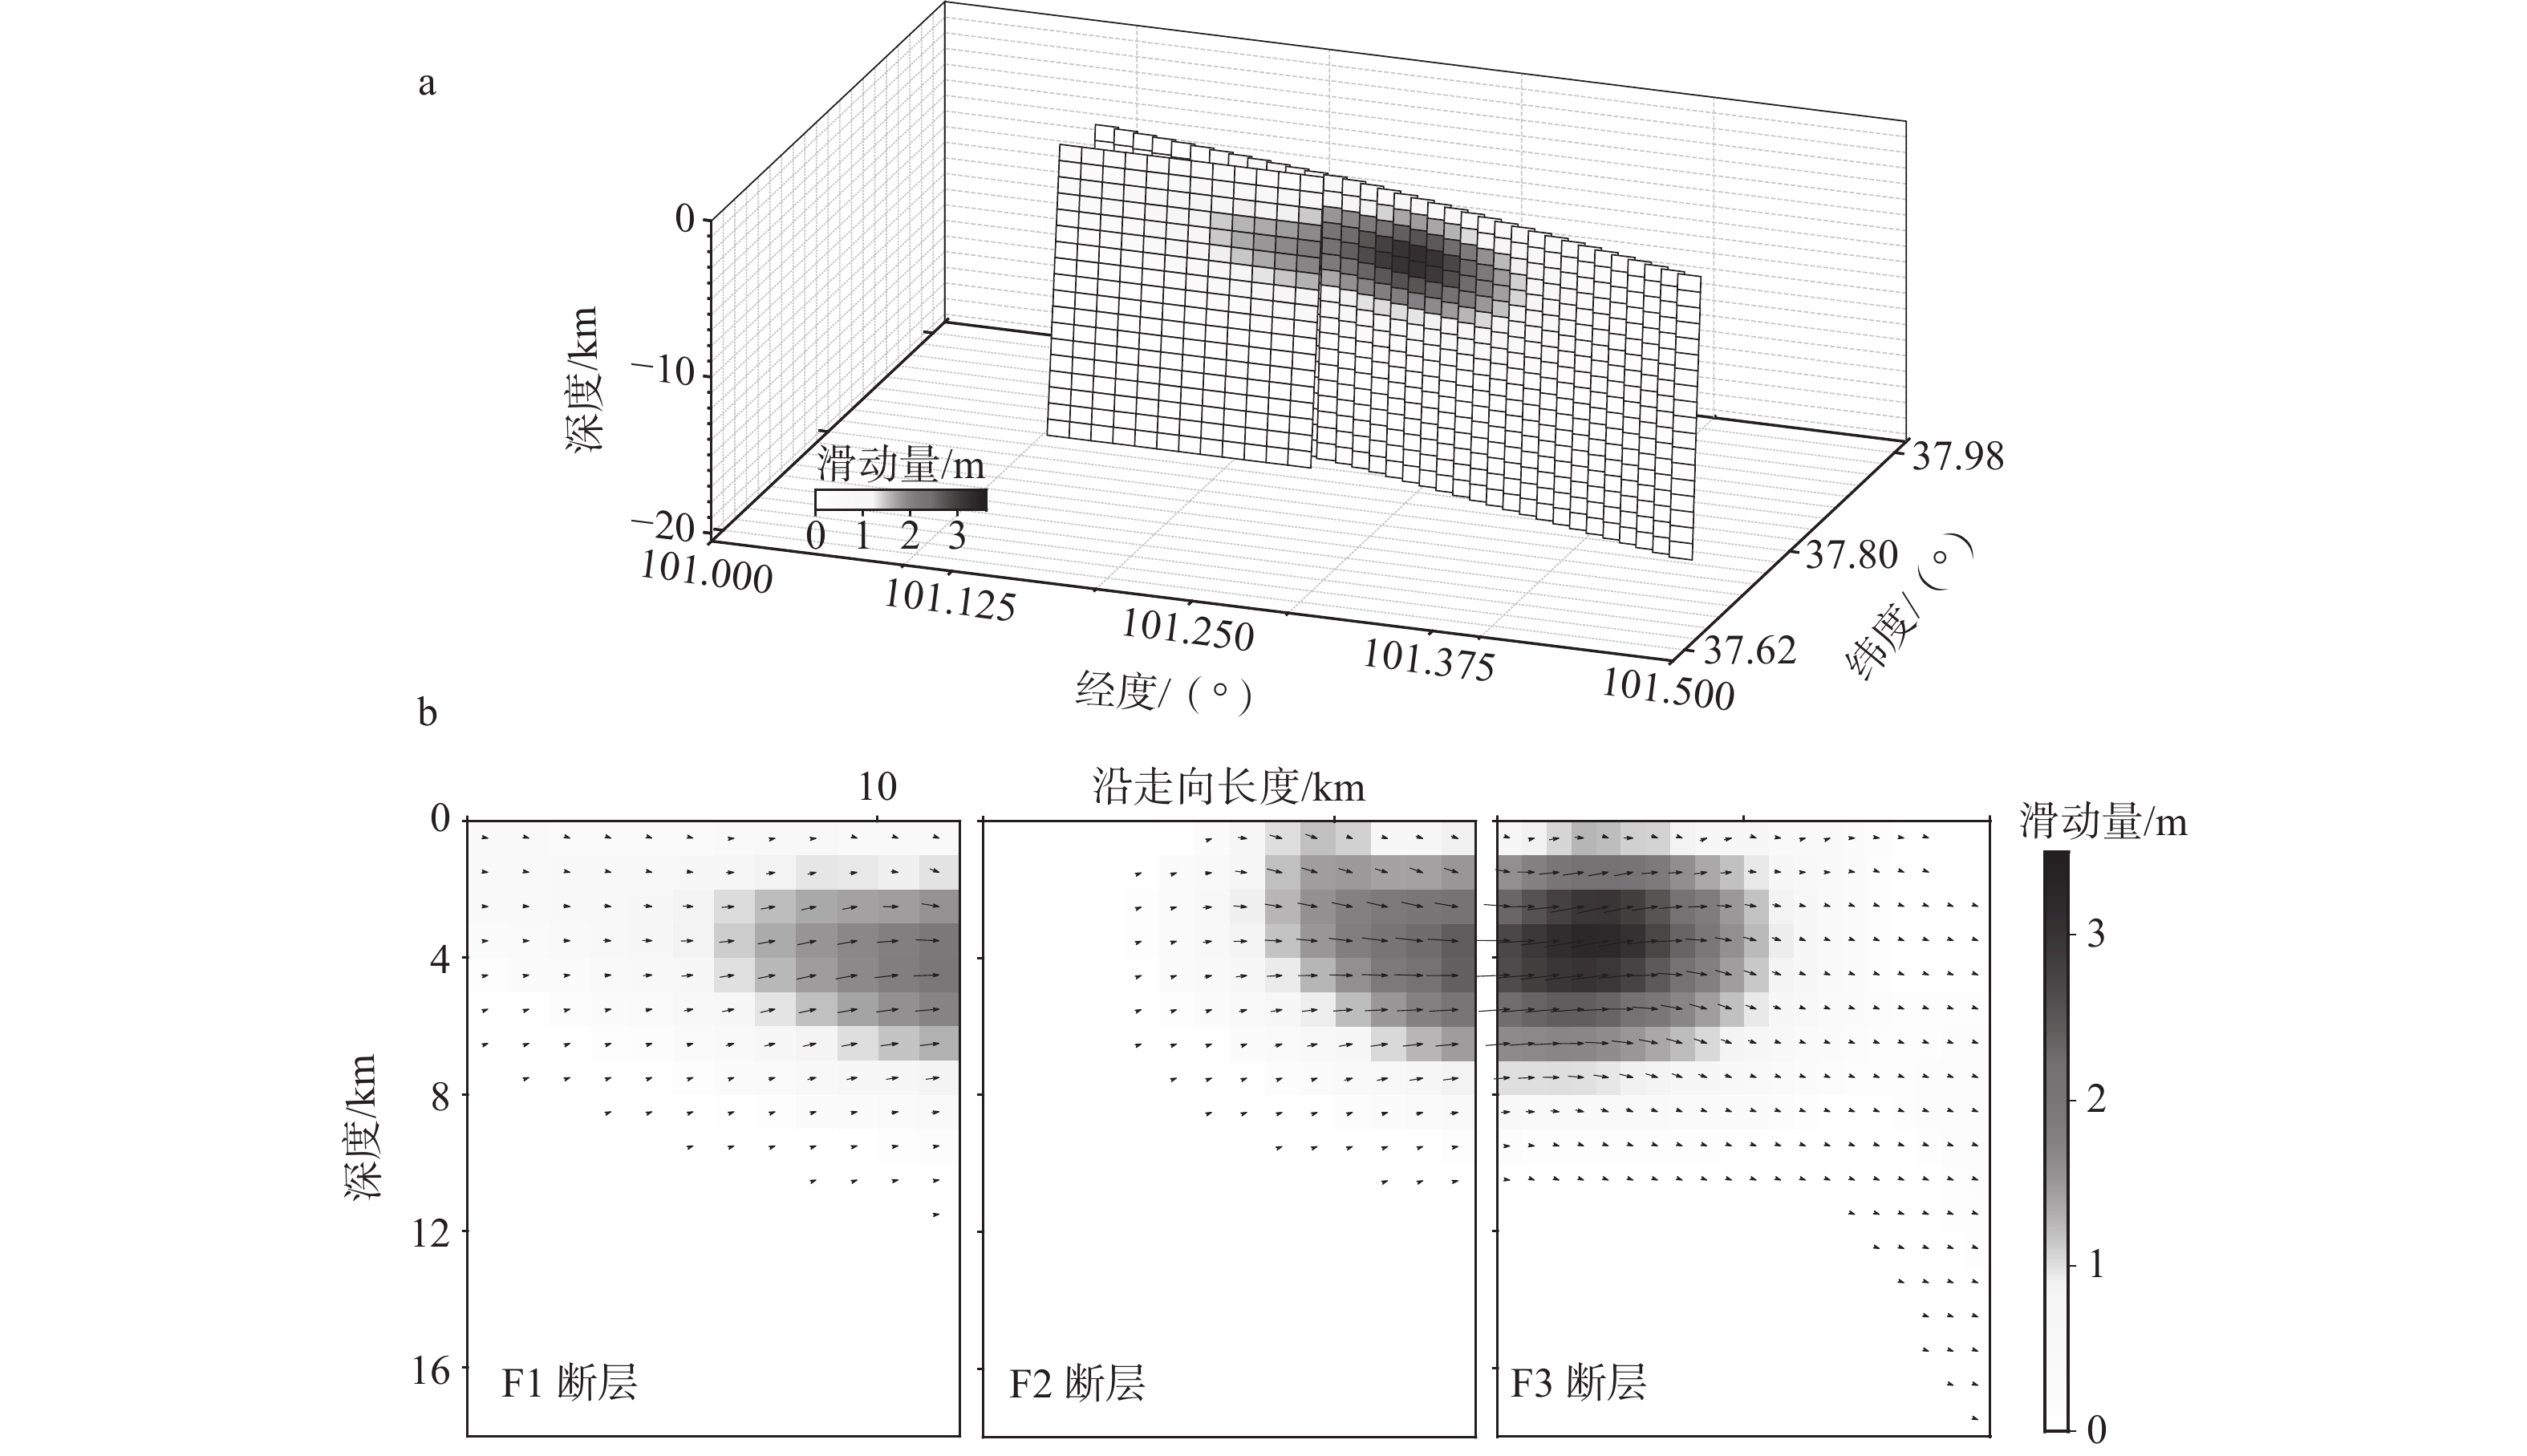
图 4 2022年MW 6.6门源地震断层滑动分布图
a—三维滑动分布模型;b—二维滑动分布模型
Figure 4. Slip distribution models of the 2022 MW 6.6 earthquake
(a) 3D slip distribution; (b) 2D slip distribution
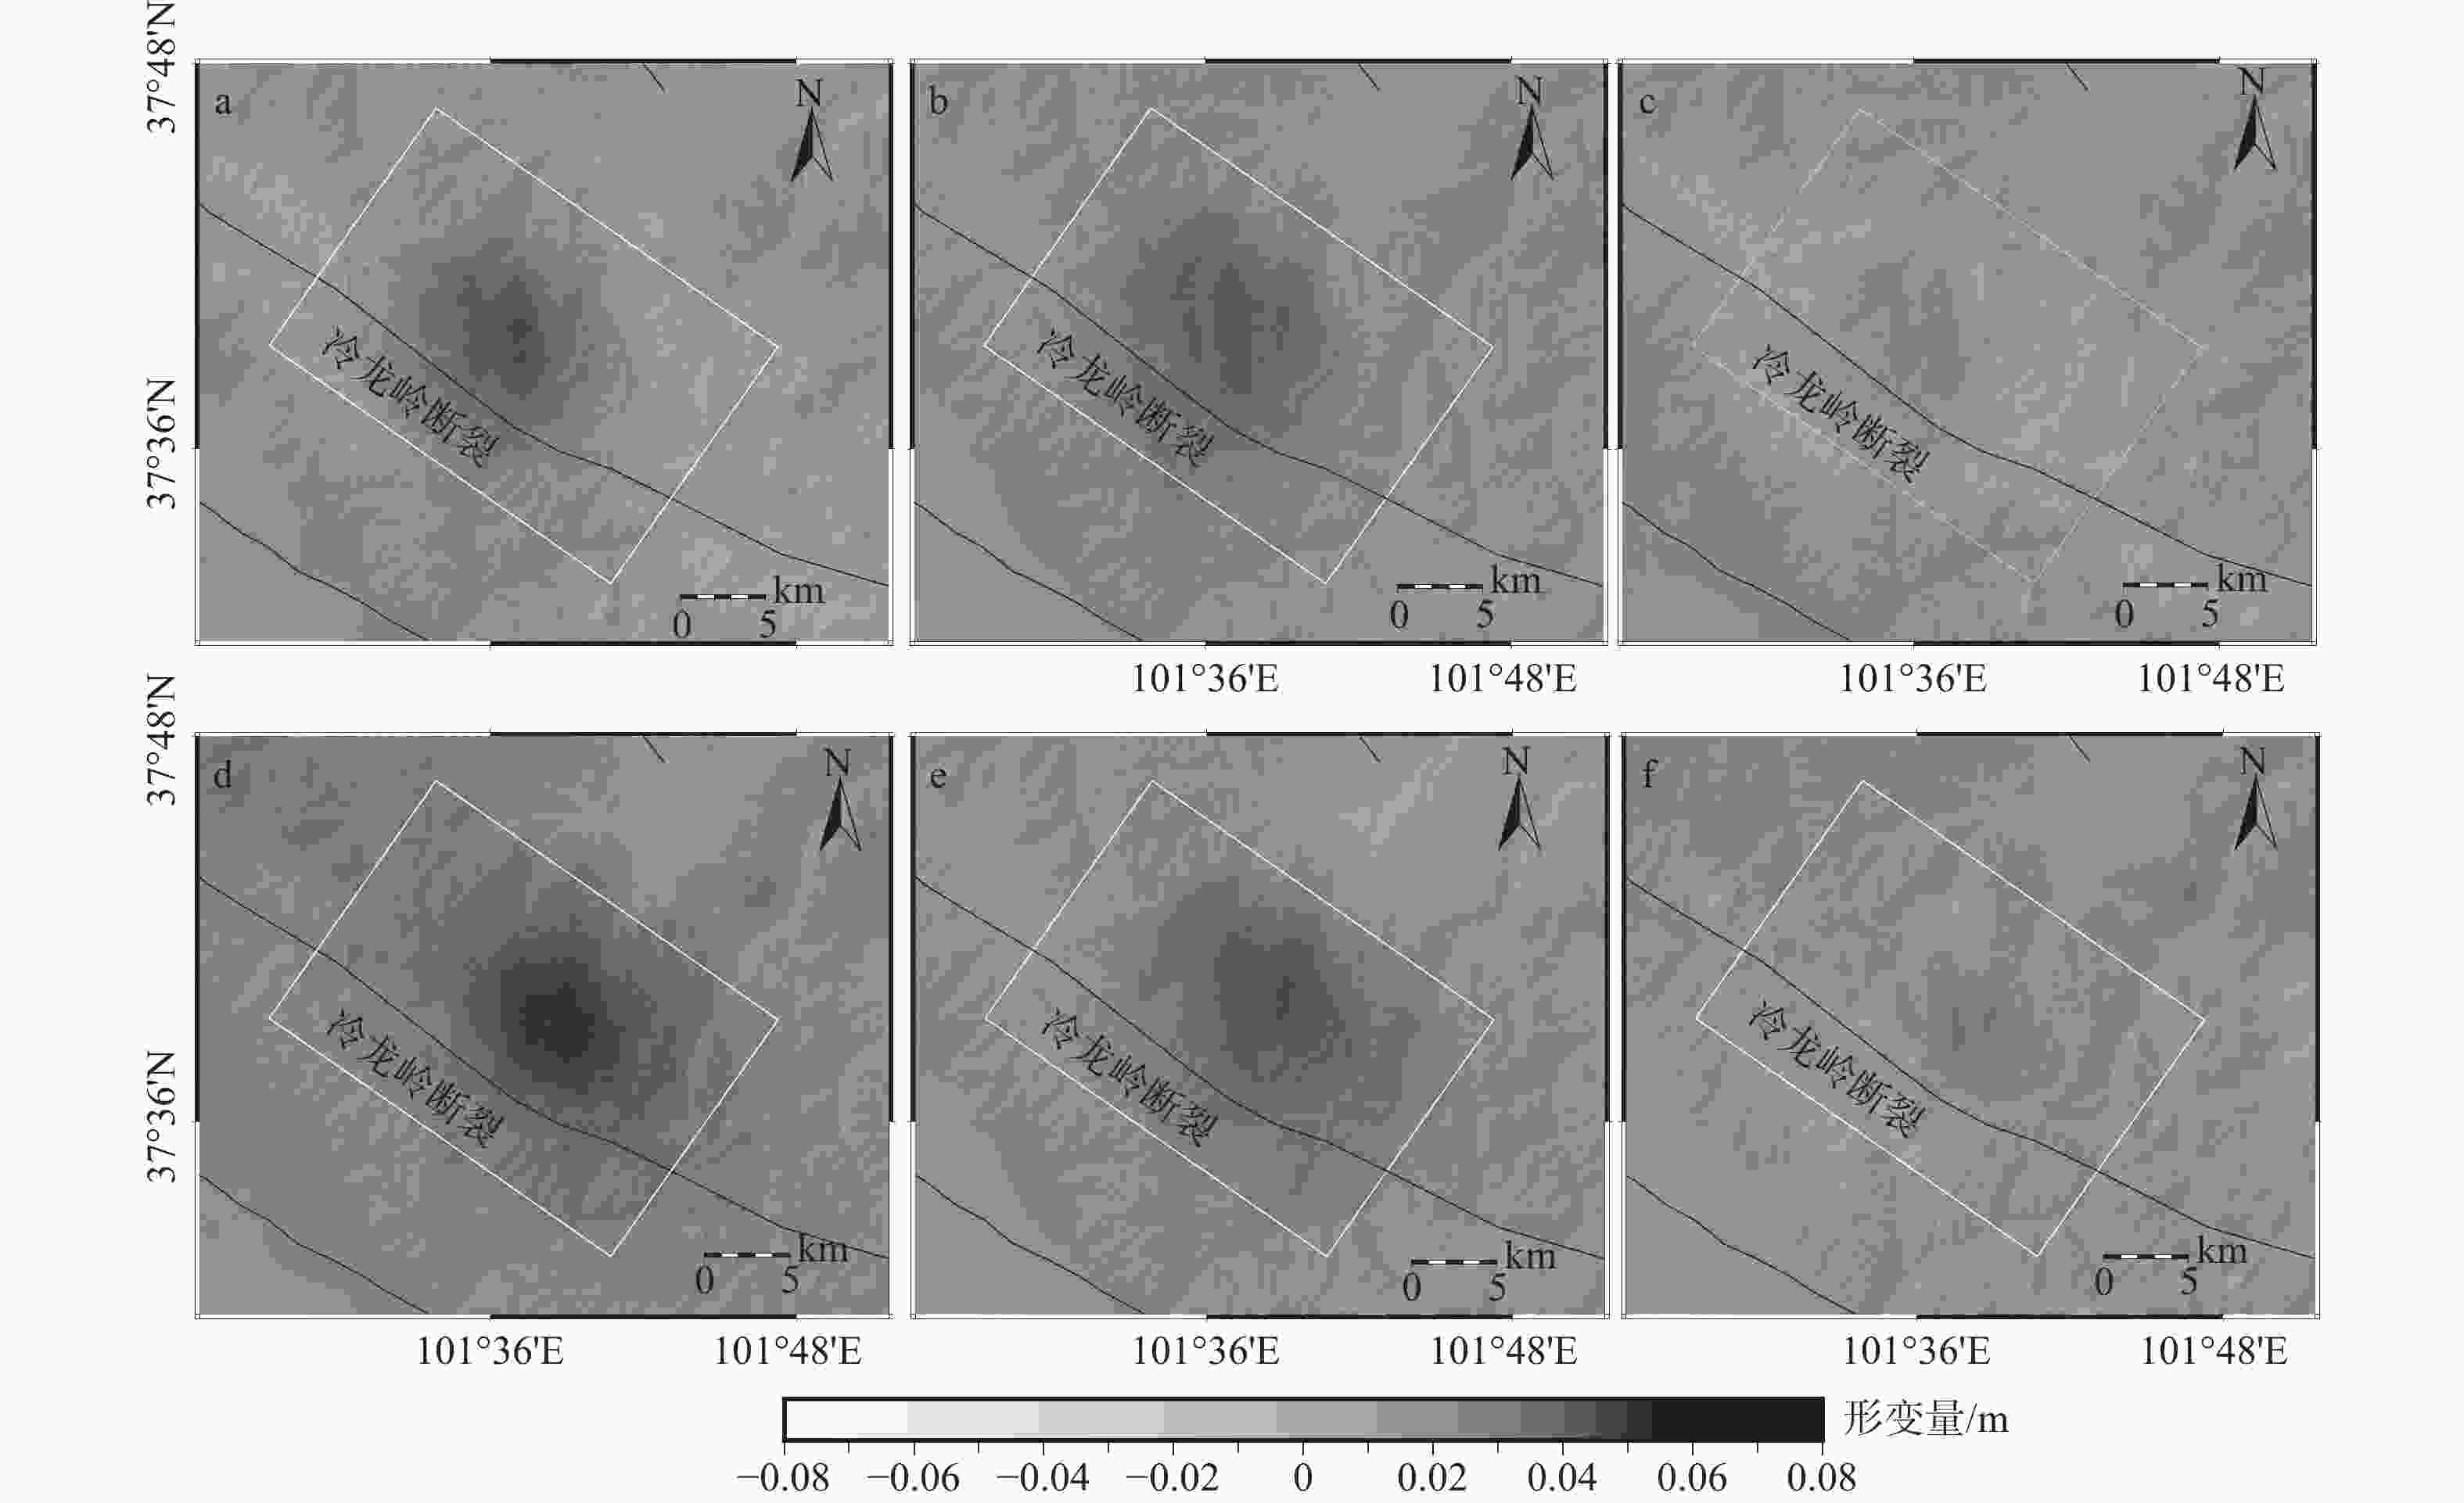
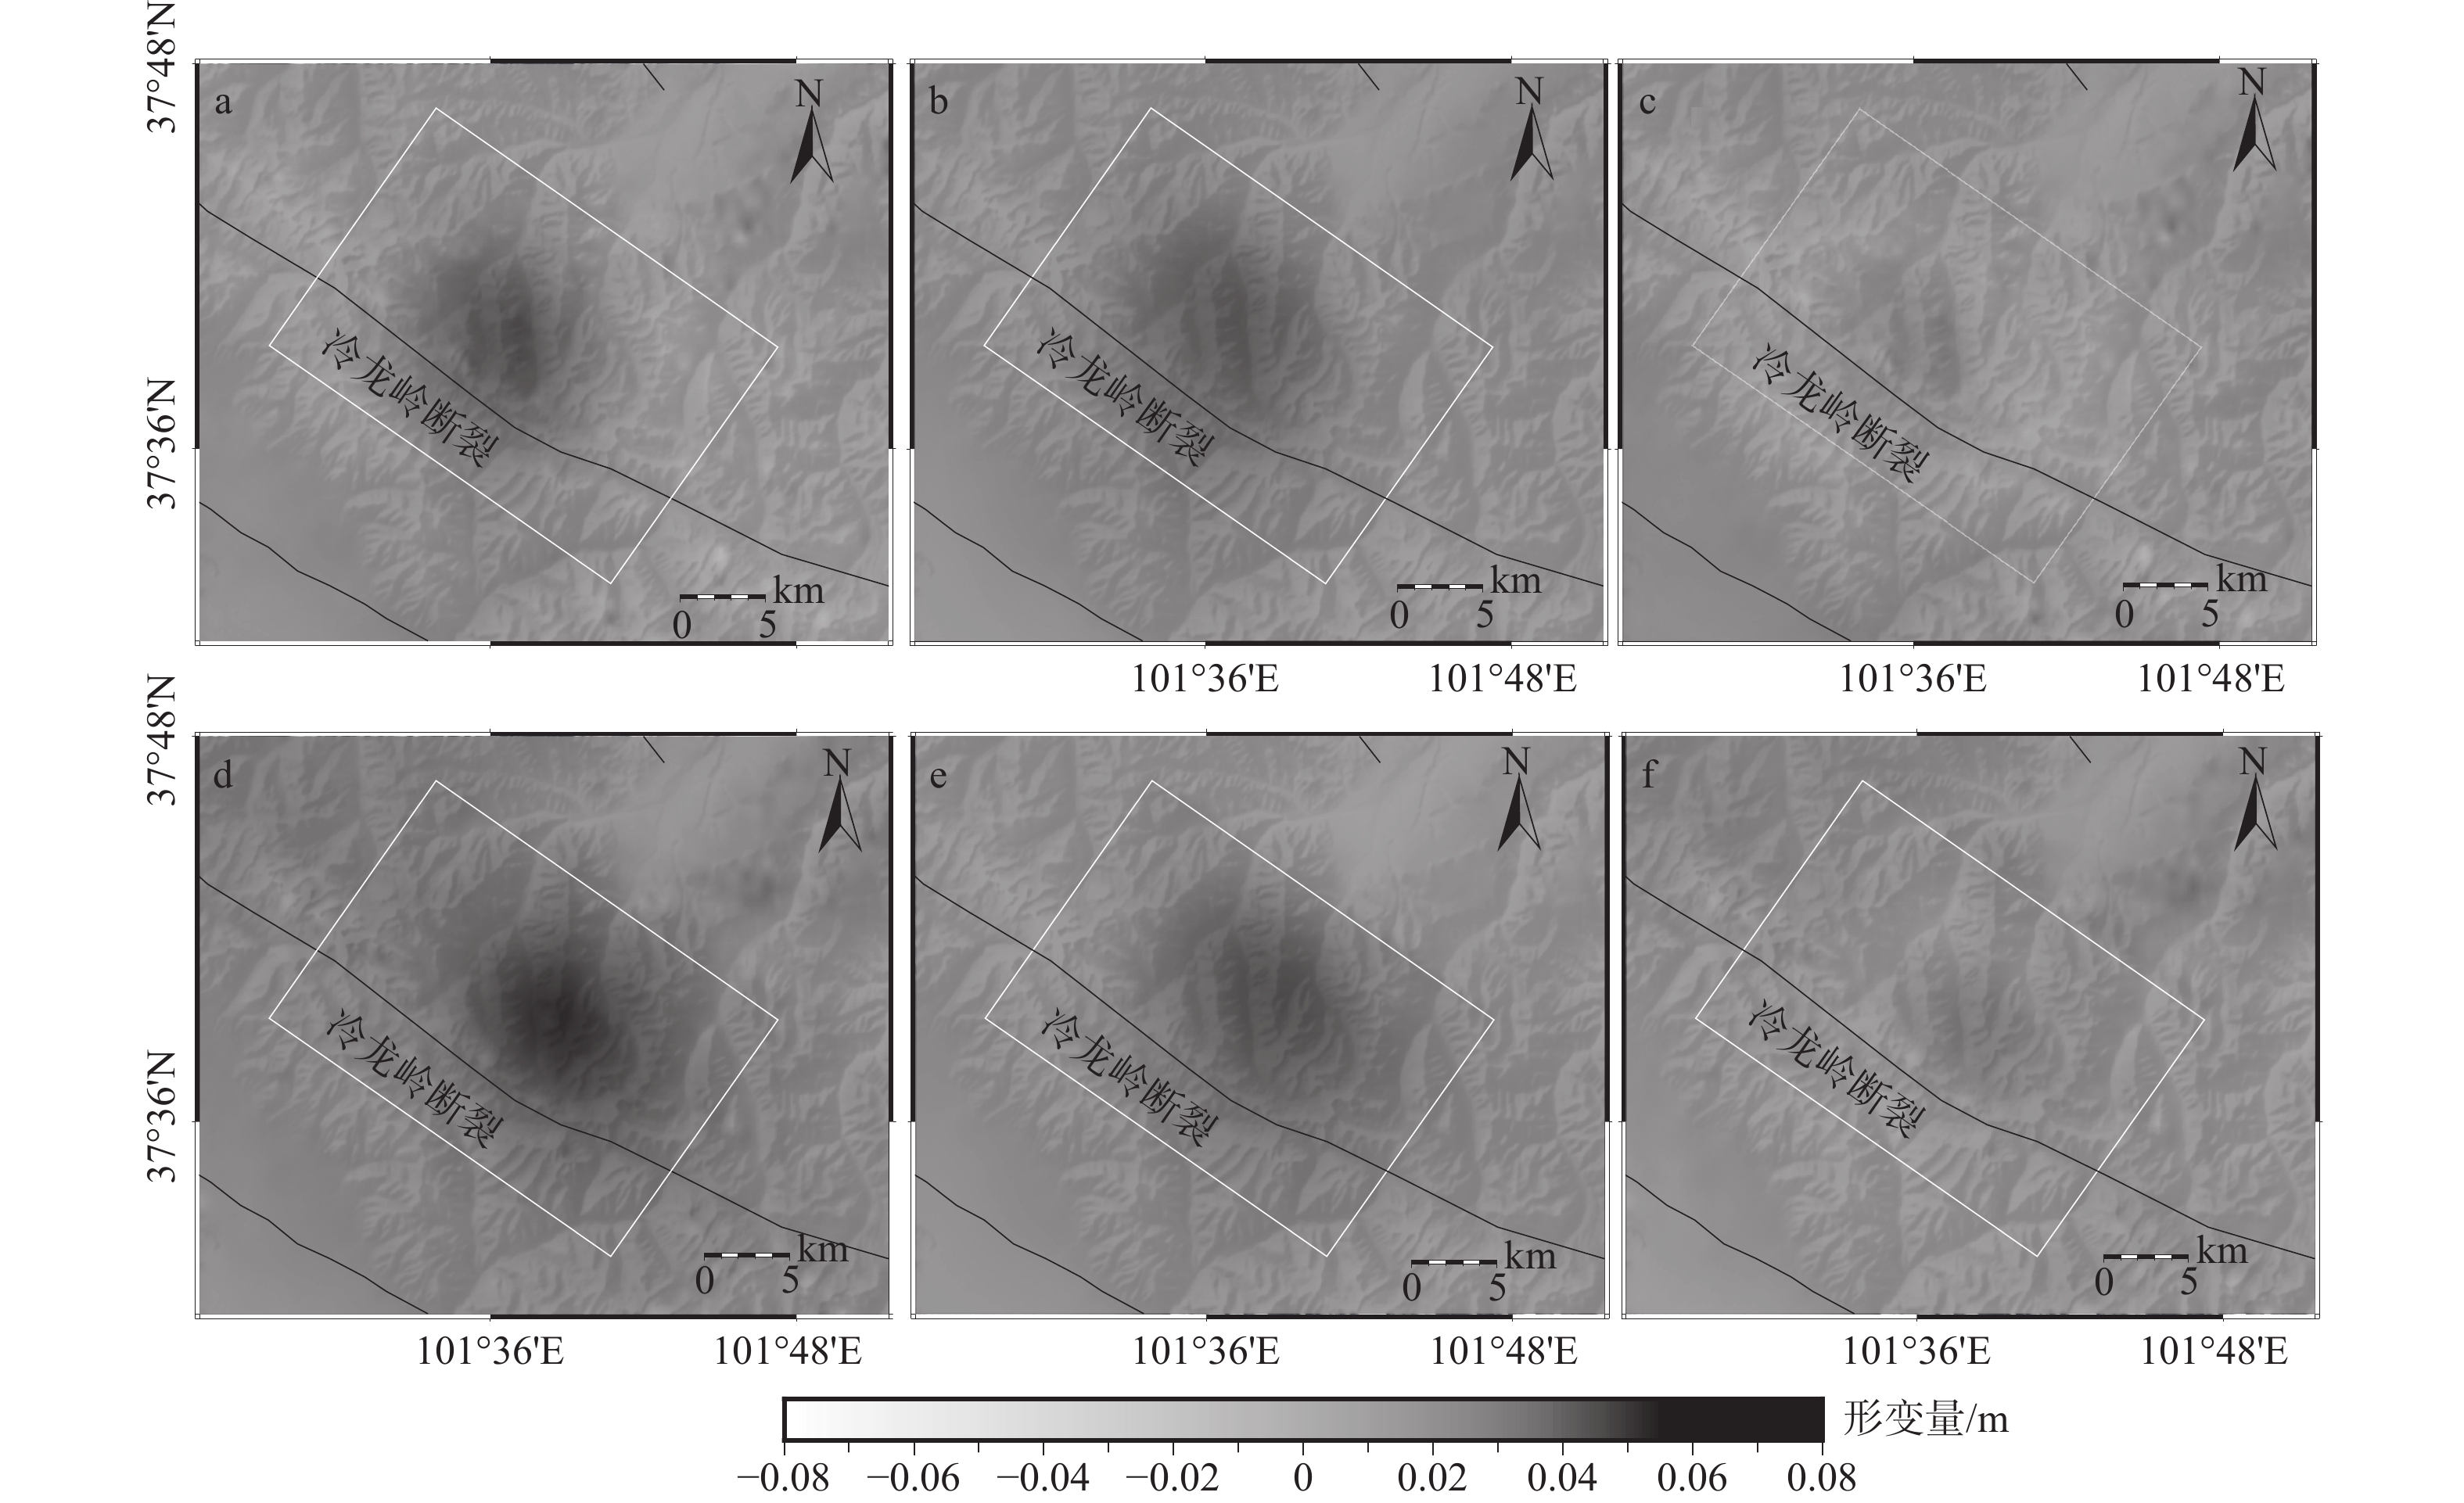
图 5 2016年门源地震反演拟合情况
矩形表示断层面的表面投影a—升轨数据观测值;b—升轨数据模拟值;c—升轨数据残差; d—降轨数据观测值;e—降轨数据模拟值;f—降轨数据残差
Figure 5. Inversion and fitting status of the 2016 Menyuan earthquake
(a) InSAR observation from ascent; (b) InSAR simulationfrom ascent; (c) InSAR residual from ascent; (d) InSAR observation, simulation and residual from descent; (e) InSAR simulation from descent; (f) InSAR residual from descent The rectangle represents the surface projection of the fault plane.
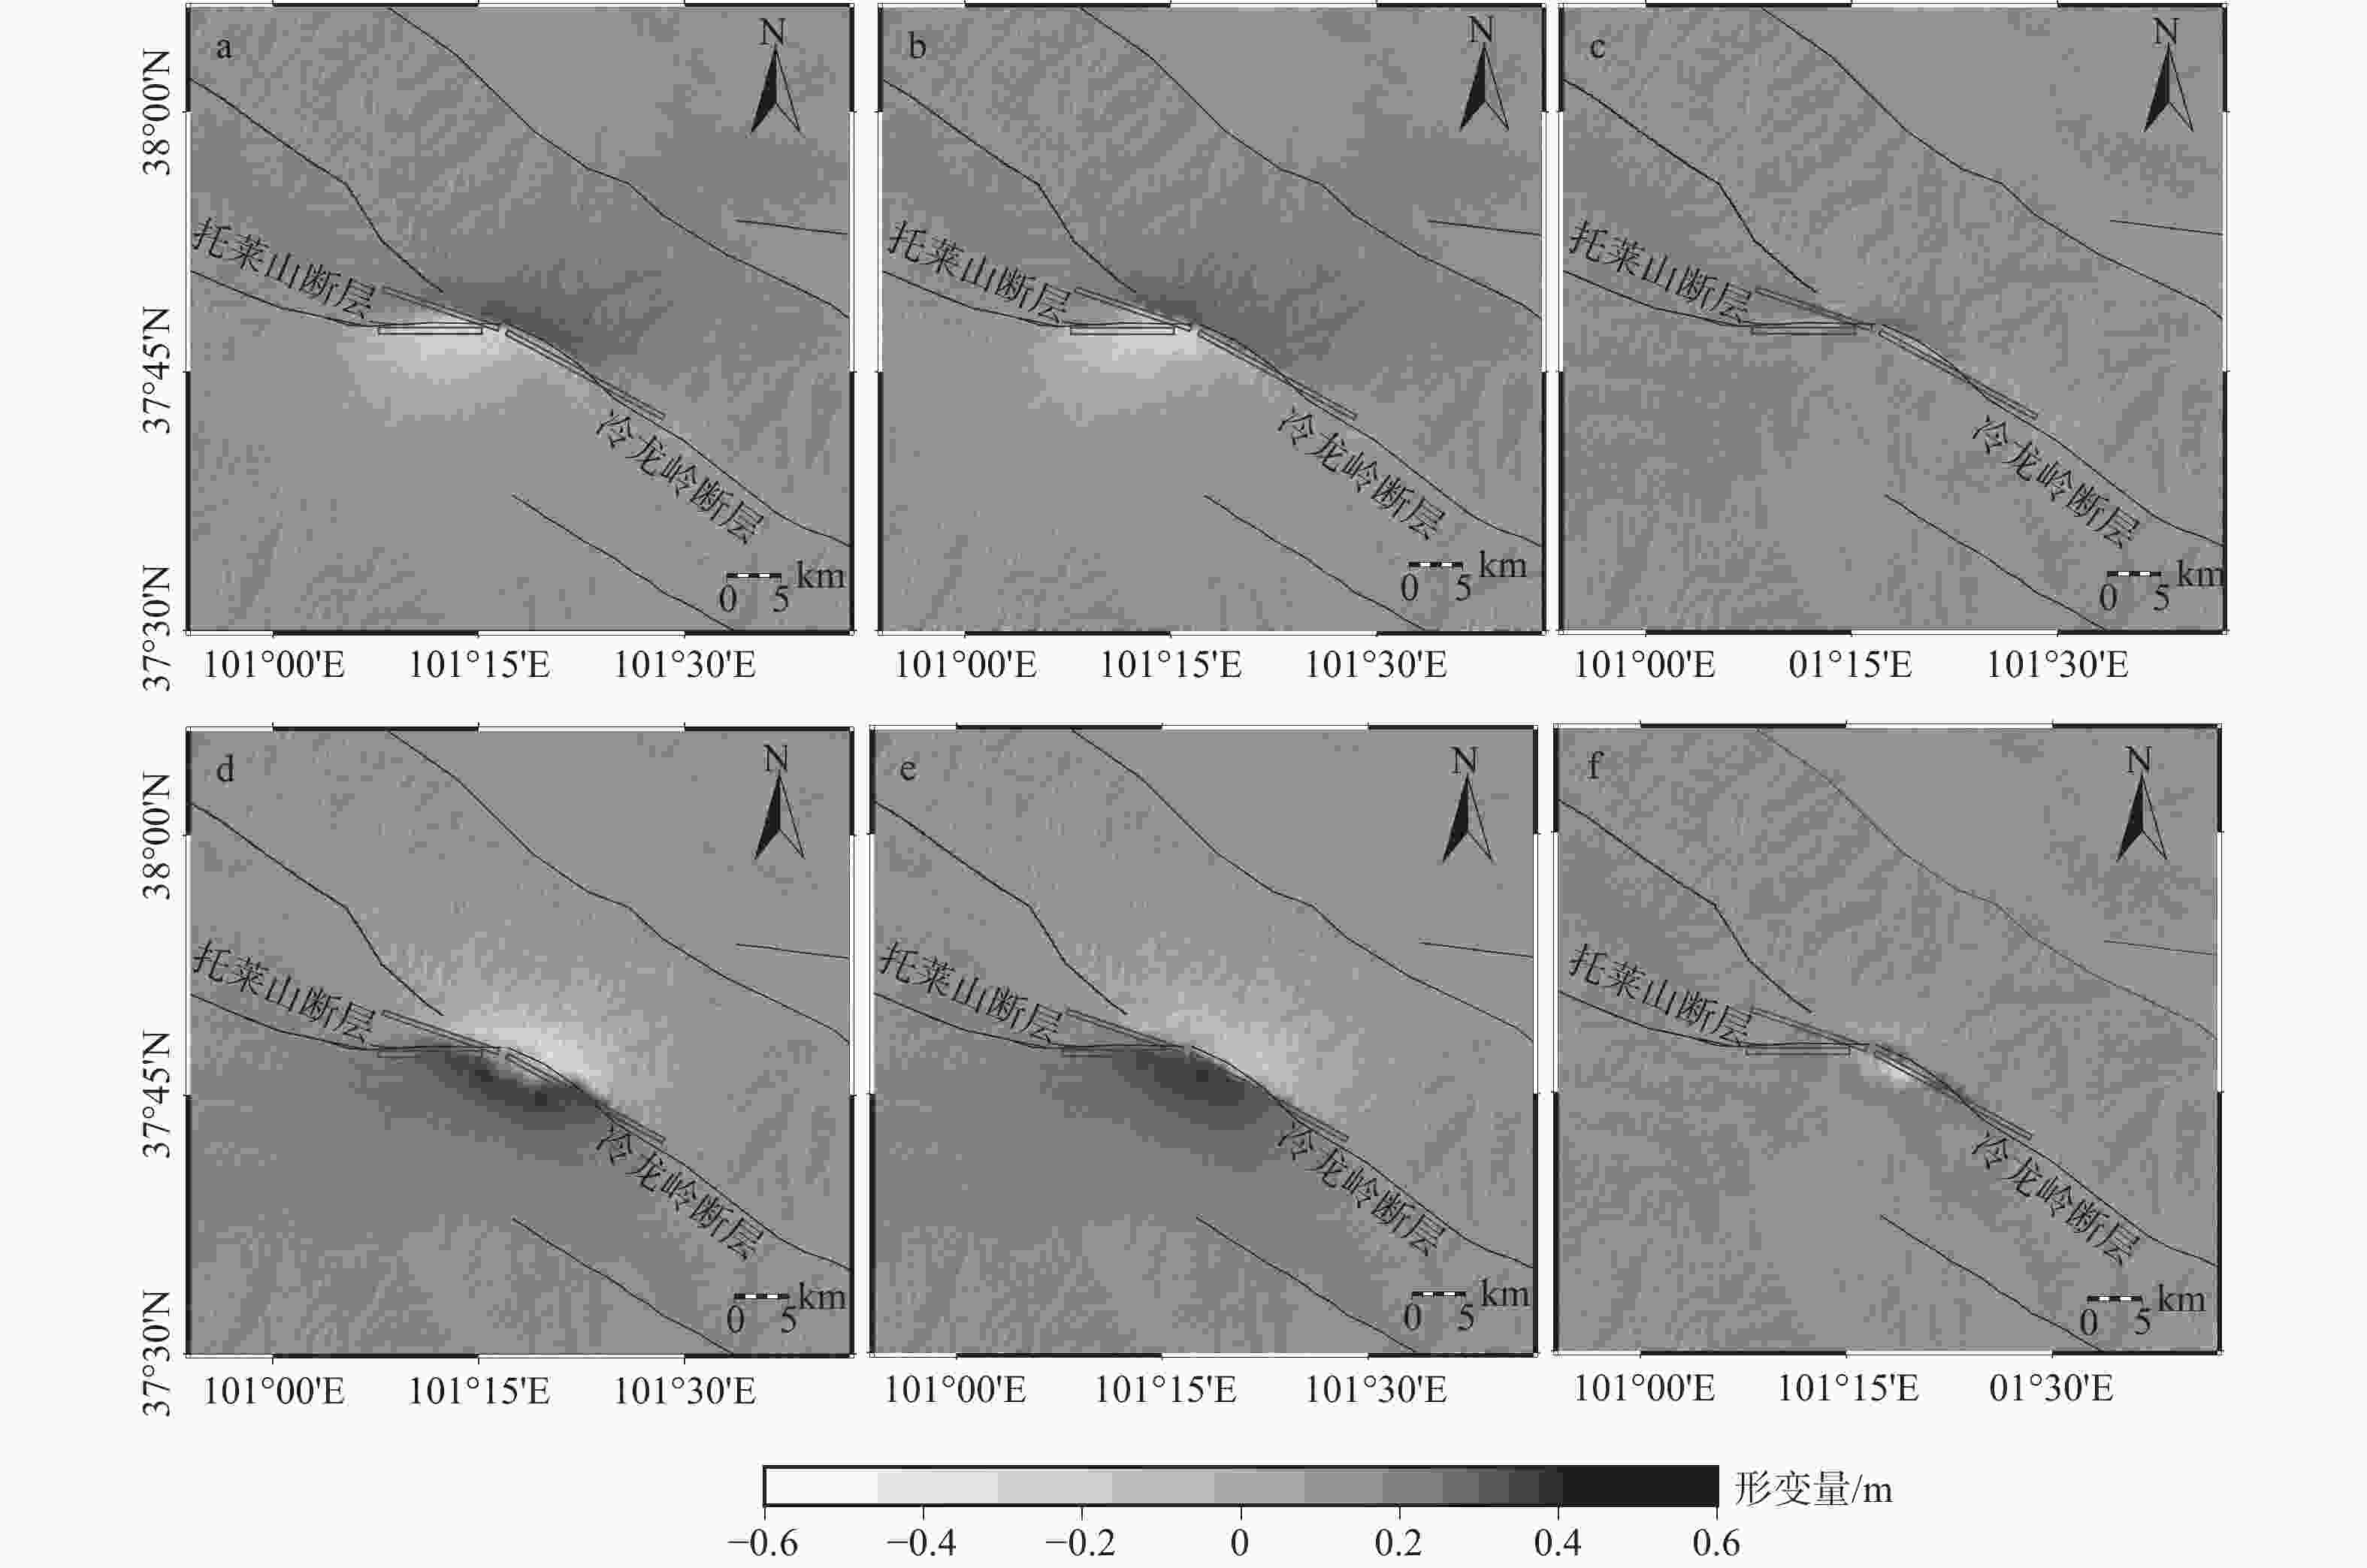
图 6 2022年门源地震反演拟合情况
矩形表示断层面的表面投影a—升轨数据观测值;b—升轨数据模拟值;c—升轨数据残差; d—降轨数据观测值;e—降轨数据模拟值;f—降轨数据残差
Figure 6. Inversion and fitting status of the 2022 Menyuan earthquake
(a) InSAR observation from ascent; (b) InSAR simulationfrom ascent; (c) InSAR residual from ascent; (d) InSAR observation, simulation and residual from descent; (e) InSAR simulation from descent; (f) InSAR residual from descentThe rectangle represents the surface projection of the fault plane.
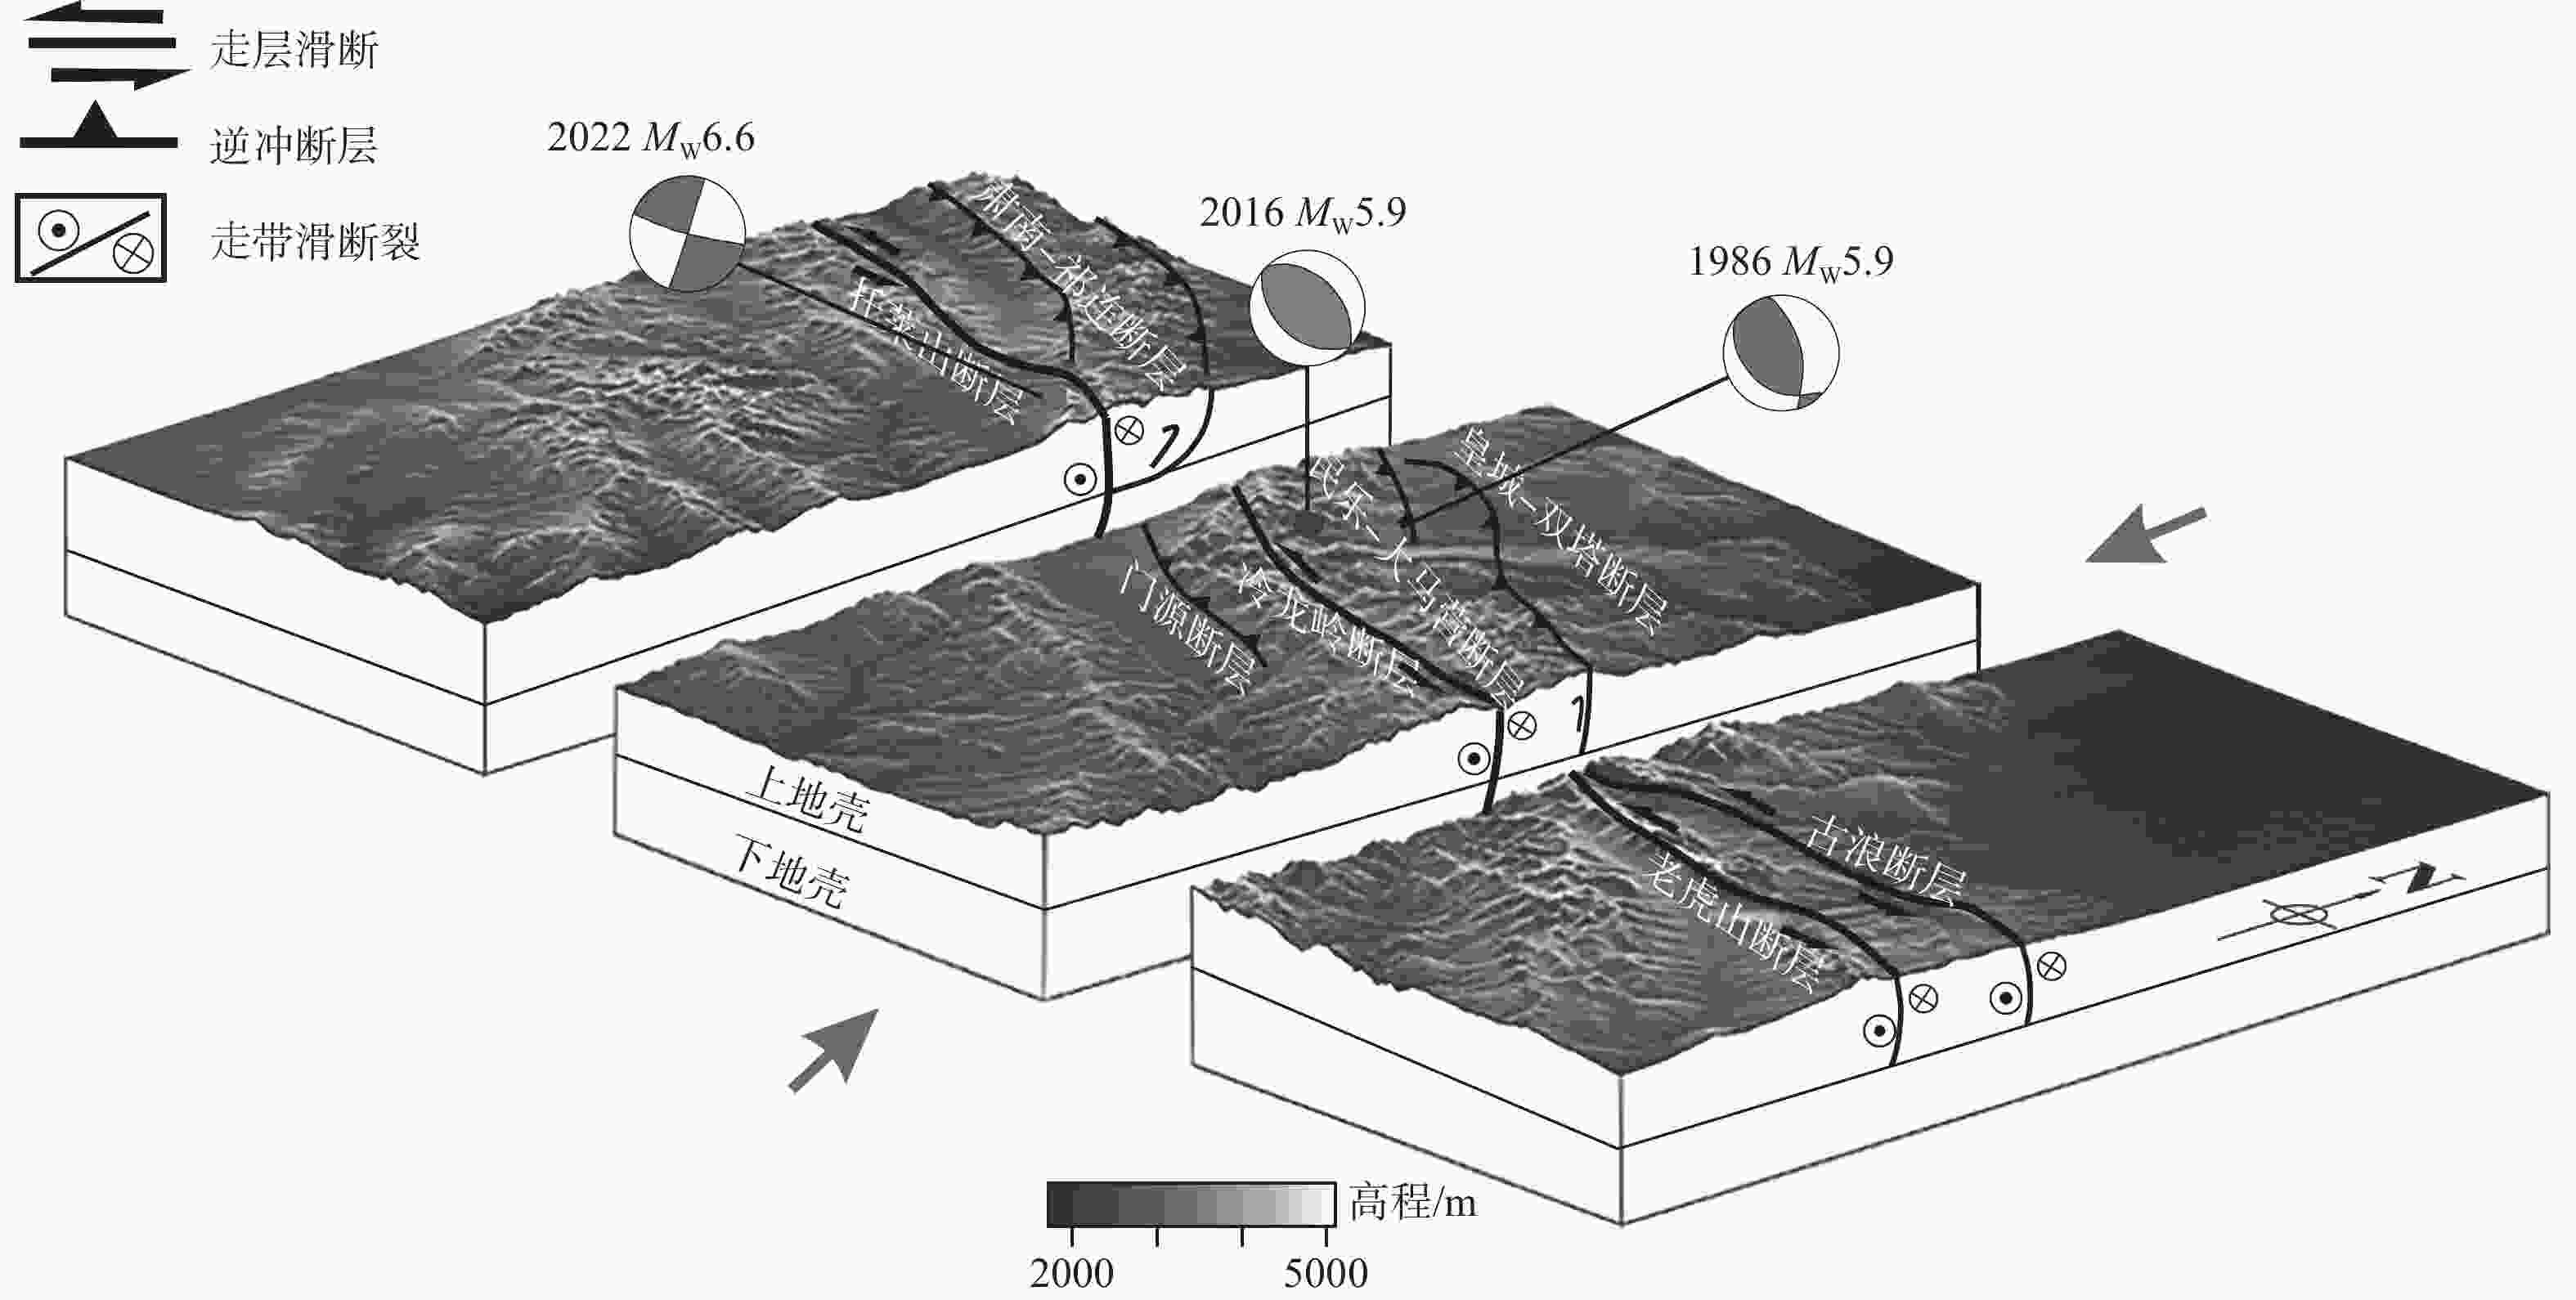
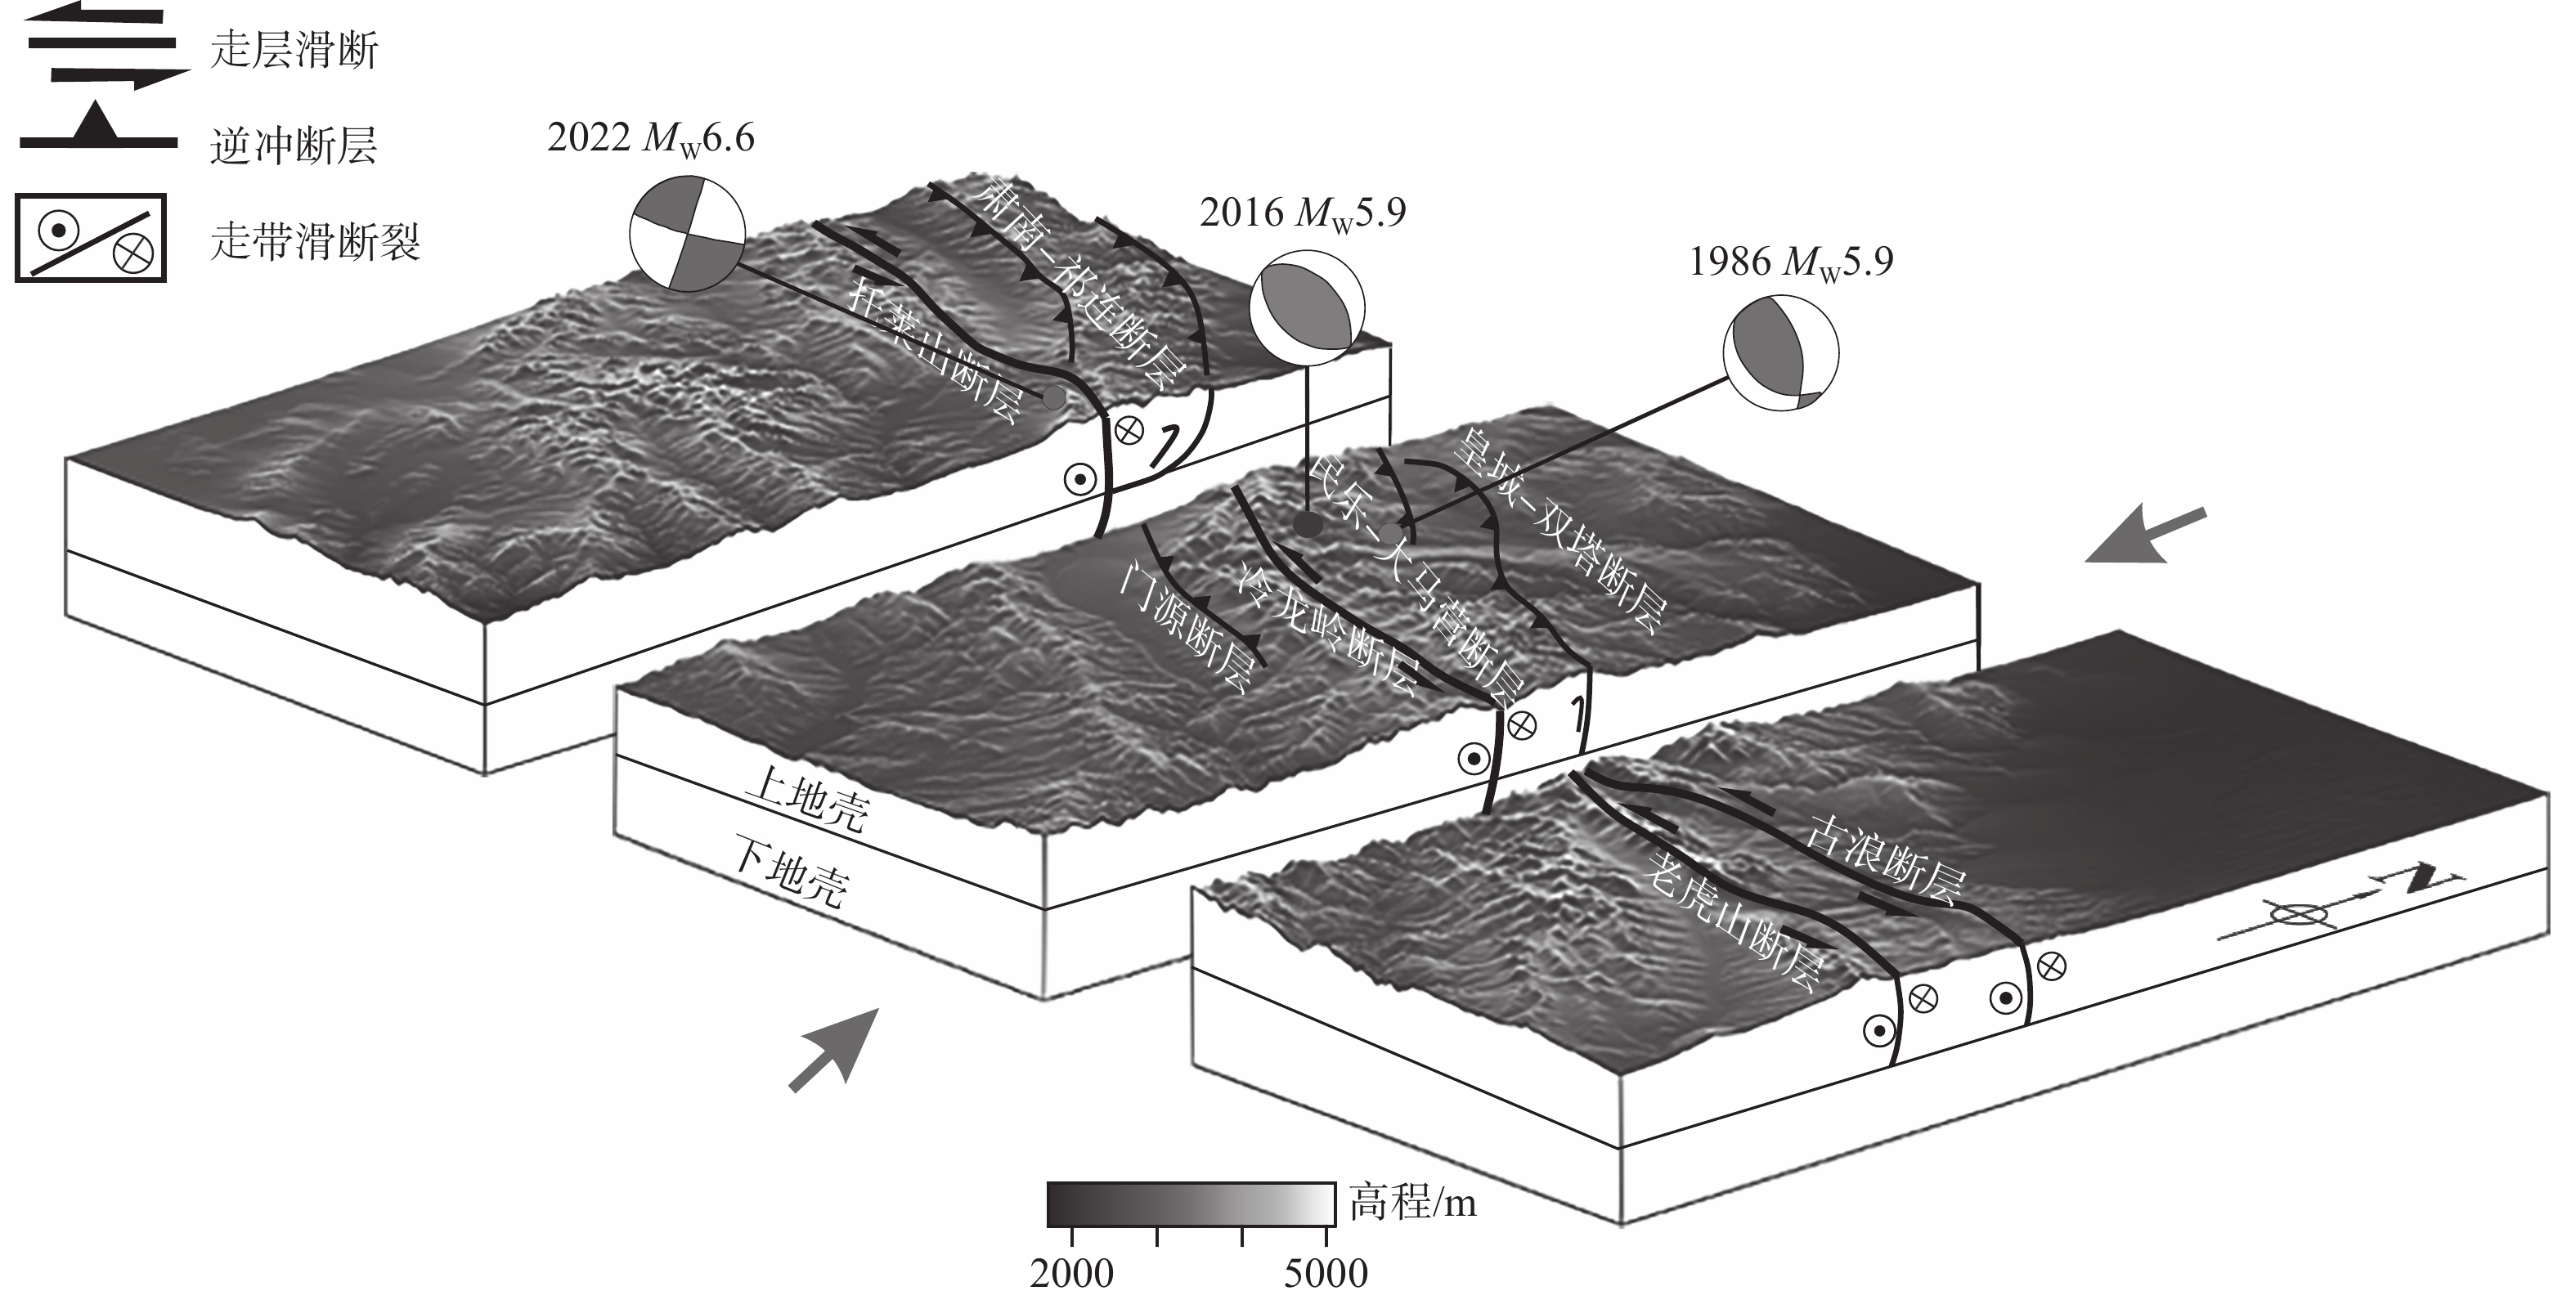
图 7 冷龙岭断层发震三维构造模型
箭头表示区域最大主压应力方向;沙滩球分别代表2022年MW 6.6地震、2016年MW 5.9地震和1986年MW 5.9地震
Figure 7. Three-dimensional structural model of the Lenglongling fault for seismic activity
The arrow indicates the direction of the maximum principal stress in the region, whereas the three beach balls represent the 2022 MW 6.6, 2016MW 5.9 and 1986 MW 5.9 earthquakes.
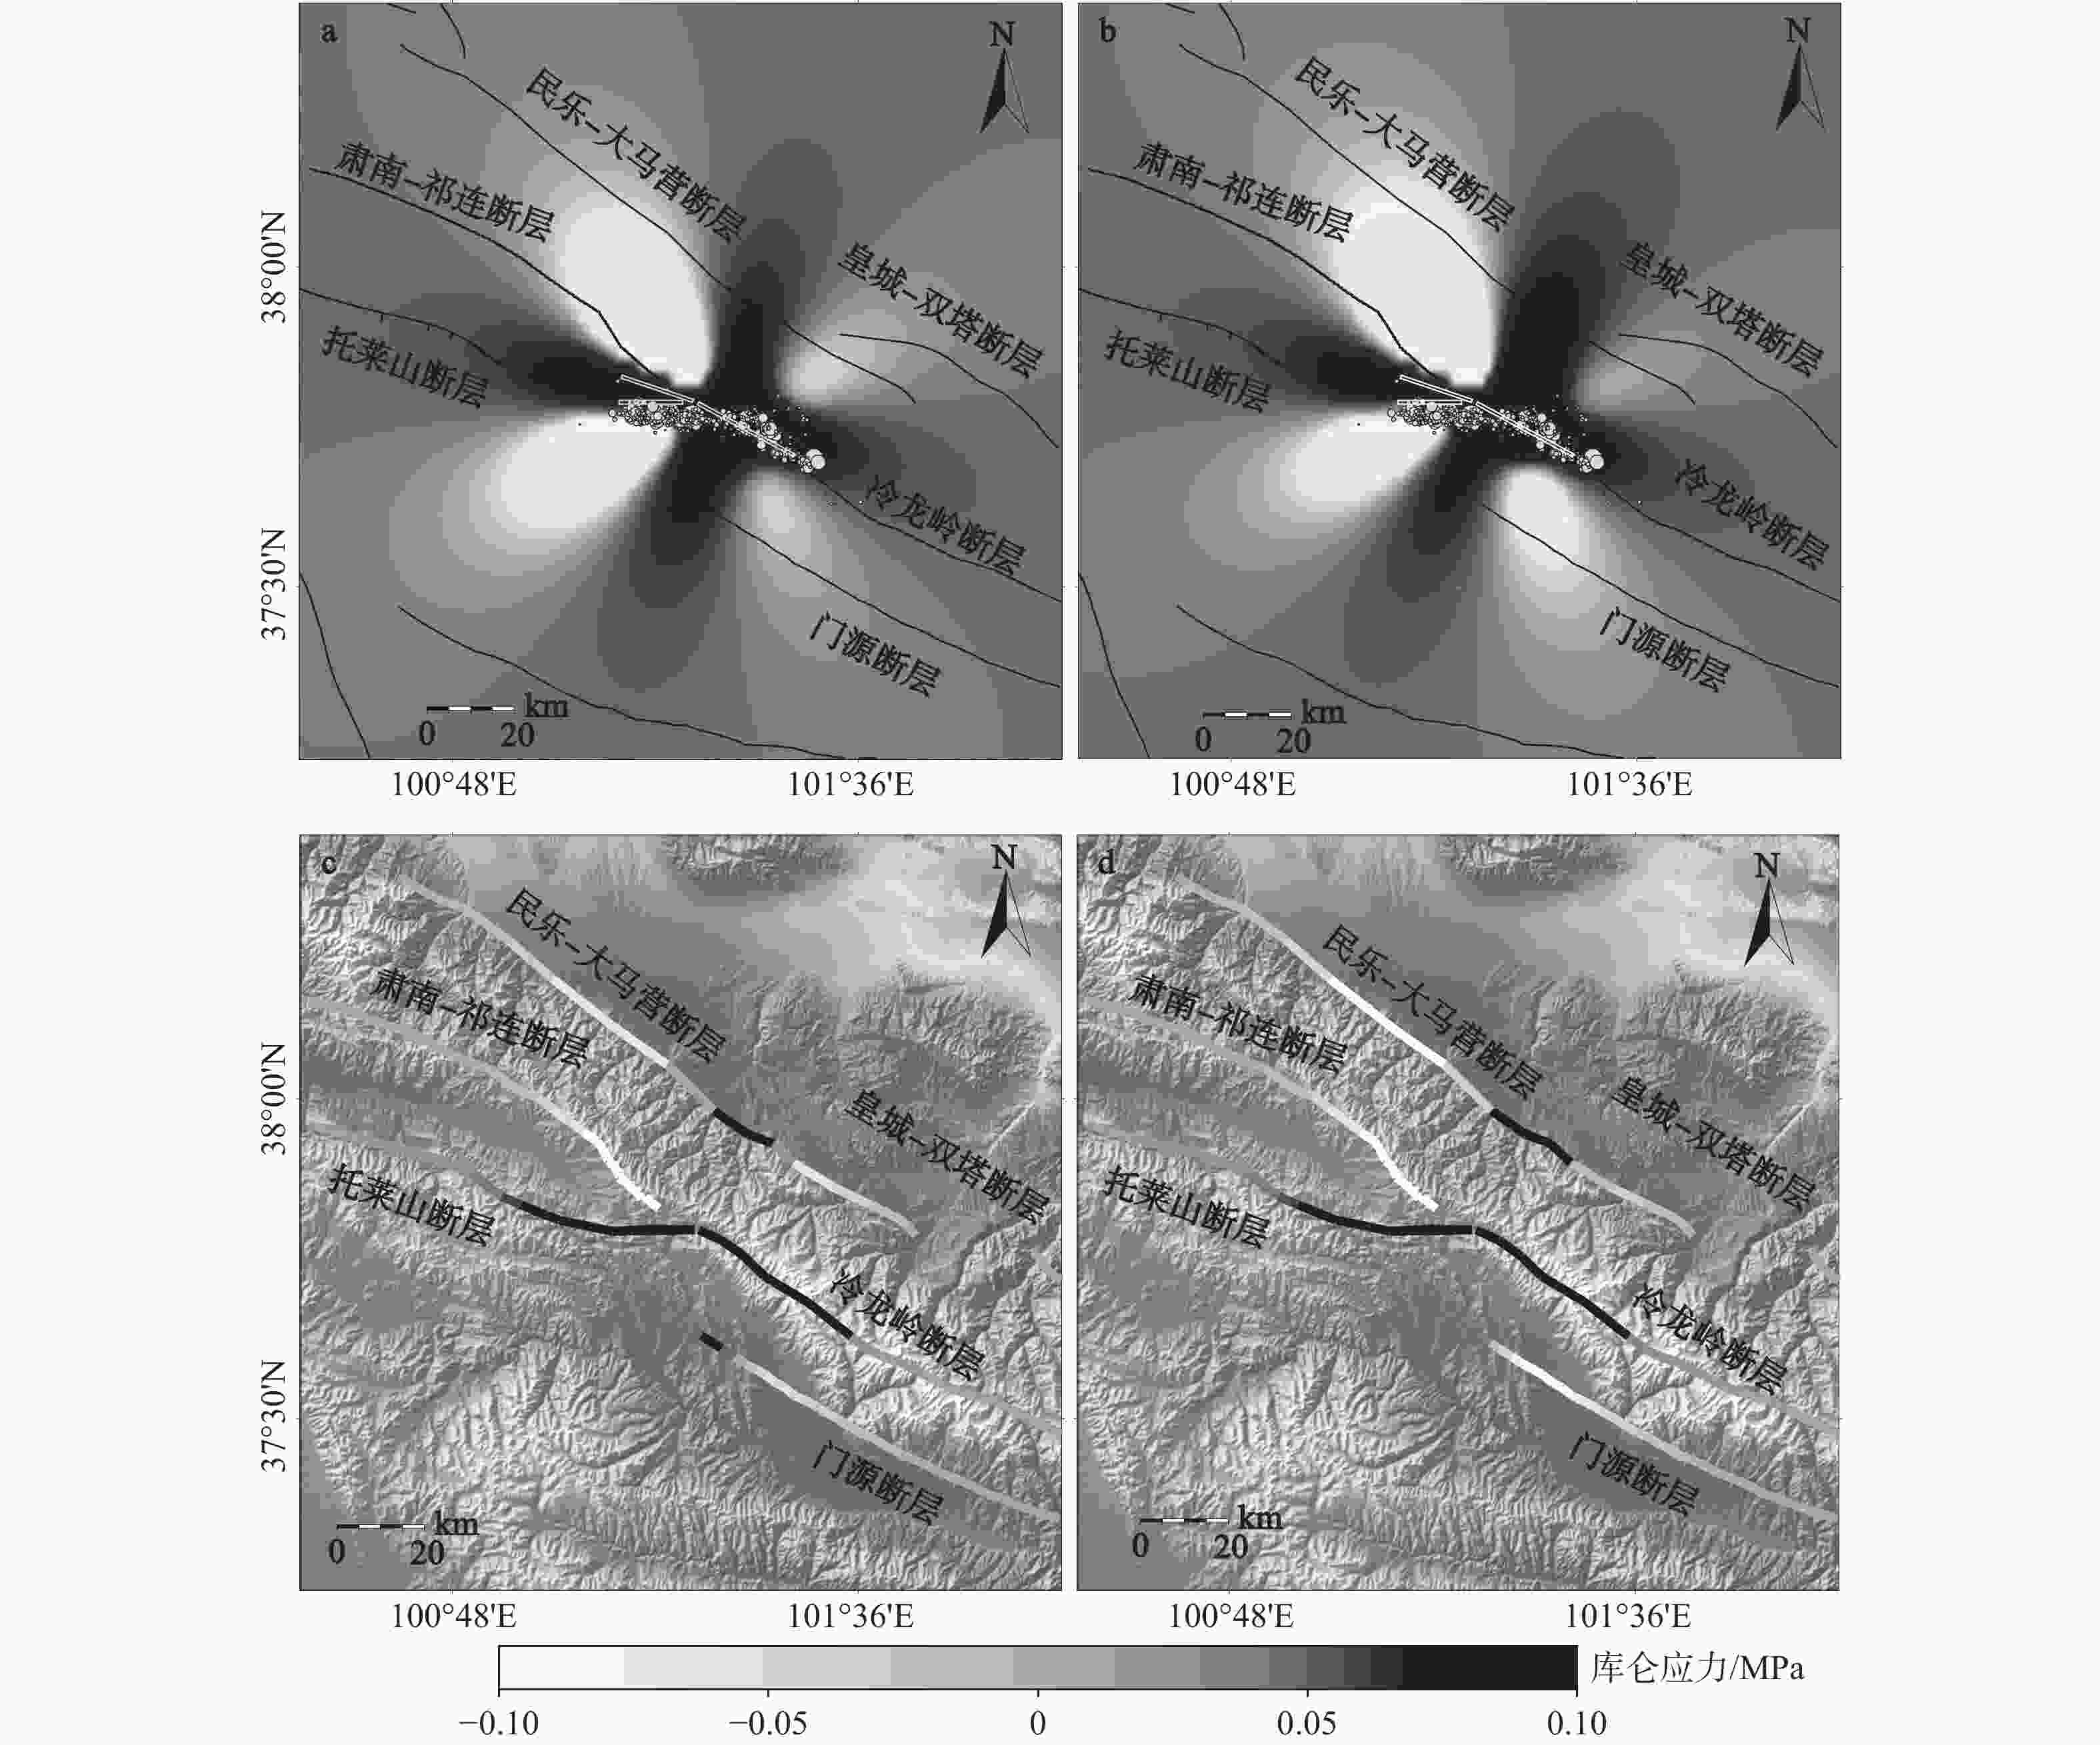
图 8 2022年MW 6.6门源地震在不同摩擦系数下引起的静态库仑应力变化
圆点是Fan et al.(2022)在2022年地震中重新定位的余震;黑色线段为断层;矩形为发震断层面的表面投影a—摩擦系数为0.1的区域静态库仑应力变化;b—摩擦系数为0.4的区域静态库仑应力变化;c —摩擦系数为0.1的周围断层库仑应力扰动情况;d —摩擦系数为0.4的周围断层库仑应力扰动情况
Figure 8. The Coulomb stress changes caused by the 2022 Mw 6.6 Menyuan earthquake under different friction coefficients
(a) Regional static Coulomb stress changes under friction coefficient of 0.1; (b) Regional static Coulomb stress changes under friction coefficient of 0.4; (c) Disturbance of Coulomb stress from surrounding faults under friction coefficient of 0.1; (d) Disturbance of Coulomb stress from surrounding faults under friction coefficient of 0.4Dots in pink are the relocated aftershocks of the 2022 earthquake from Fan et al. (2022). The black line represents the fault, whereas the rectangle represents the surface projection of the fault plane.
表 1 Sentinel-1A 数据参数
Table 1. Parameters of Sentinel-1A
地震 成像模式 轨道 飞行方向 主影像日期 辅影像日期 2016-01-21 IW 128 升轨 2016-01-13 2016-02-06 IW 33 降轨 2016-01-18 2016-02-11 2022-01-08 IW 128 升轨 2022-01-05 2022-01-17 IW 33 降轨 2021-12-29 2022-01-10  下载: 导出CSV
表 2 子断层反演基本参数
Table 2. Basic parameters for sub-faults inversion
时间 断层 起始位置
经度/(°)起始位置
纬度/(°)走向/(°) 倾角/(°) 2022年 F1 101.123 37.793 90.113 82.270 F2 101.130 37.833 108.030 88.050 F3 101.281 37.792 118.890 88.270 2016年 M1 101.556 37.779 125.000 46.000
下载: 导出CSV
-
[1] ALLEN M B, WALTERS R J, SONG S G, et al., 2017. Partitioning of oblique convergence coupled to the fault locking behavior of fold-and-thrust belts: evidence from the Qilian Shan, northeastern Tibetan Plateau[J]. Tectonics, 36(9): 1679-1698. doi: 10.1002/2017TC004476 [2] CHEN X H, SHAO Z G, XIONG X S, et al., 2019. Fault system, deep structure and tectonic evolution of the Qilian Orogenic Belt, Northwest China[J]. Geology in China, 46(5): 995-1020. (in Chinese with English abstract [3] DAOUT S, JOLIVET R, LASSERRE C, et al. 2016. Along-strike variations of the partitioning of convergence across the Haiyuan fault system detected by InSAR[J]. Geo-physical Supplements to the Monthly Notices of the Royal Astronomical Society, 205(1): 536-547. [4] FAN L P, LI B R, LIAO S R, et al., 2022. High-precision relocation of the aftershock sequence of the January 8, 2022, MS 6.9 Menyuan earthquake[J]. Earthquake Science, 35(2): 138-145. doi: 10.1016/j.eqs.2022.01.021 [5] GAUDEMER Y, TAPPONNIER P, MEYER B, et al., 1995. Partitioning of crustal slip between linked, active faults in the eastern Qilian Shan, and evidence for a major seismic gap, the ‘Tianzhu gap’, on the western Haiyuan Fault, Gansu (China)[J]. Geophysical Journal International, 120(3): 599-645. doi: 10.1111/j.1365-246X.1995.tb01842.x [6] GUO P, HAN Z J, AN Y F, et al., 2017. Activity of the Lenglongling fault system and seismotectonics of the 2016 MS 6.4 Menyuan earthquake[J]. Science China Earth Sciences, 60(5): 929-942. doi: 10.1007/s11430-016-9007-2 [7] GUO P, HAN Z J, MAO Z B, et al., 2019. Paleoearthquakes and rupture behavior of the Lenglongling fault: implications for seismic hazards of the northeastern margin of the Tibetan Plateau[J]. Journal of Geophysical Research: Solid Earth, 124(2): 1520-1543. doi: 10.1029/2018JB016586 [8] HAN S, WU Z H, GAO Y, et al., 2022. Surface rupture investigation of the 2022 Menyuan MS 6.9 Earthquake, Qinghai, China: implications for the fault behavior of the Lenglongling fault and regional intense earthquake risk[J]. Journal of Geomechanics, 28(2): 155-168. (in Chinese with English abstract [9] HE J K, LU S J, WANG W M, 2013. Three-dimensional mechanical modeling of the GPS velocity field around the northeastern Tibetan plateau and surrounding regions[J]. Tectonophysics, 584: 257-266. doi: 10.1016/j.tecto.2012.03.025 [10] HE W G, YUAN D Y, GE W P, et al., 2010. Determination of the slip rate of the Lenglongling fault in the middle and eastern segments of the Qilian mountain active fault zone[J]. Earthquake, 30(1): 131-137. (in Chinese with English abstract [11] HE X H, ZHANG Y P, SHEN X Z, et al., 2020. Examination of the repeatability of two MS 6.4 Menyuan earthquakes in Qilian-Haiyuan fault zone (NE Tibetan Plateau) based on source parameters[J]. Physics of the Earth and Planetary Interiors, 299: 106408. doi: 10.1016/j.pepi.2019.106408 [12] HU C Z, YANG P X, LI Z M, et al., 2016. Seismogenic mechanism of the 21 January 2016 Menyuan, Qinghai MS 6.4 earthquake[J]. Chinese Journal of Geophysics, 59(5): 1637-1646. (in Chinese with English abstract [13] JI L Y, LIU C J, XU J, et al., 2017. InSAR observation and inversion of the seismogenic fault for the 2017 Jiuzhaigou MS 7.0 earthquake in China[J]. Chinese Journal of Geophysics, 60(10): 4069-4082. (in Chinese with English abstract [14] LI Y S, JIANG W L, ZHANG J F, et al., 2016. Space geodetic observations and modeling of 2016 MW 5.9 Menyuan earthquake: implications on seismogenic tectonic motion[J]. Remote Sensing, 8(6): 519. doi: 10.3390/rs8060519 [15] LI Y S, JIANG W L, LI Y J, et al., 2022. Coseismic rupture model and tectonic implications of the January 7 2022, Menyuan MW 6.6 earthquake constraints from InSAR observations and field investigation[J]. Remote Sensing, 14(9): 2111. doi: 10.3390/rs14092111 [16] LIANG K, HE Z T, JIANG W L, et al., 2022. Surface rupture characteristics of the Menyuan MS 6.9 earthquake on January 8, 2022, Qinghai Province[J]. Seismology and Geology, 44(1): 256-278. (in Chinese with English abstract [17] LIU B Y, ZENG W H, YUAN D Y, et al., 2015. The research on fault parameter and sliding behavior of the 1927 Gulang M8.0 earthquake[J]. Seismology and Geology, 37(3): 818-828. (in Chinese with English abstract [18] LIU M, LI H Y, PENG Z G, et al., 2019. Spatial-temporal distribution of early aftershocks following the 2016 MS 6.4 Menyuan, Qinghai, China Earthquake[J]. Tectonophysics, 766: 469-479. doi: 10.1016/j.tecto.2019.06.022 [19] LIU Y H, ZHANG G H, ZHANG Y F, et al., 2018. Source parameters of the 2016 Menyuan earthquake in the northeastern Tibetan Plateau determined from regional seismic waveforms and InSAR measurements[J]. Journal of Asian Earth Sciences, 158: 103-111. doi: 10.1016/j.jseaes.2018.02.009 [20] LIU Y, XU C J, WEN Y M. 2019. InSAR observation of Menyuan MW5. 9 earthquake deformation and deep geometry of regional fault zone [J]. Geomatics and Information Science of Wuhan University. 44(7): 1035-1042. (in Chinese with English abstract [21] LI Z H, HAN B Q, LIU Z J, et al., 2022. Source parameters and slip distributions of the 2016 and 2022 Menyuan, Qinghai earthquakes constrained by InSAR observations[J]. Geomatics and Information Science of Wuhan University, 47(6): 887-897. (in Chinese with English abstract [22] LUO H, WANG T, 2022. Strain partitioning on the western Haiyuan fault system revealed by the adjacent 2016 MW5.9 and 2022 MW6.7 Menyuan earthquakes[J]. Geophysical Research Letters, 49(16): e2022GL099348. doi: 10.1029/2022GL099348 [23] MA B Q, LI D W, 2008. Stages of the neotectonic movement of the Menyuan Basin in the middle segment of the Qilian mountains[J]. Journal of Geomechanics, 14(3): 201-211. (in Chinese with English abstract [24] PAN J W, LI H B, CHEVALIER M L, et al., 2022. Coseismic surface rupture and seismogenic structure of the 2022 MS 6.9 Menyuan earthquake, Qinghai Province, China[J]. Acta Geologica Sinica, 96(1): 215-231. (in Chinese with English abstract [25] TANG D W, GE W P, YUAN D Y, et al., 2023. Triggering effect of historical earthquakes in the northern Tibetan Plateau on the Coulomb stress of the 2022 Menyuan MS 6.9 earthquake and subsequent earthquakes[J]. Chinese Journal of Geophysics, 66(7): 2772-2795. (in Chinese with English abstract [26] WANG J Y, DING L, HE J K, et al., 2023. Research of seismogenic structures of the 2016 and 2022 Menyuan earthquakes, in the Northeastern Tibetan Plateau[J]. Remote Sensing, 15(3): 742. doi: 10.3390/rs15030742 [27] WANG K, DREGER D S, TINTI E, et al., 2020. Rupture process of the 2019 Ridgecrest, California MW 6.4 foreshock and MW 7.1 earthquake constrained by seismic and geodetic data[J]. Bulletin of the Seismological Society of America, 110(4): 1603-1626. doi: 10.1785/0120200108 [28] WANG M, SHEN Z K, 2020. Present-day crustal deformation of continental China derived from GPS and its tectonic implications[J]. Journal of Geophysical Research: Solid Earth, 125(2): e2019JB018774. doi: 10.1029/2019JB018774 [29] WANG R J, LORENZO-MARTÍN F, ROTH F, 2006. PSGRN/PSCMP: a new code for calculating co- and post-seismic deformation, geoid and gravity changes based on the viscoelastic-gravitational dislocation theory[J]. Computers & Geosciences, 32(4): 527-541. [30] WANG R J, DIAO F Q, HOECHNER A, 2013. SDM-A geodetic inversion code incorporating with layered crust structure and curved fault geometry[C]//EGU general assembly conference abstracts. Vienna, Austria: EUG. [31] WANG X, LI S P, KANg J, 2023. InSAR observations constrained coseismic slip distribution and Coulomb stress variation of MW 6.7 Menyuan earthquake in 2022[J]. Bulletin of Surveying and Mapping(7): 32-38. (in Chinese with English abstract [32] WU C, CHEN X H, DING L, 2023. Tectonic evolution and Cenozoic deformation history of the Qilian orogen[J]. Earth Science Frontiers, 30(3): 262-281. (in Chinese with English abstract [33] XIONG J G, LI Y L, ZHONG Y Z, et al., 2017. Latest Pleistocene to Holocene thrusting recorded by a flight of strath terraces in the eastern Qilian Shan, NE Tibetan Plateau[J]. Tectonics, 36(12): 2973-2986. doi: 10.1002/2017TC004648 [34] XIONG W, CHEN W, ZHAO B, et al., 2019. Insight into the 2016 Menyuan MW 5.9 earthquake with InSAR: a blind reverse event promoted by historical earthquakes[J]. Pure and Applied Geophysics, 176(2): 577-591. doi: 10.1007/s00024-018-2000-0 [35] XU G Y, XU X W, YI Y N, et al., 2022. Seismogenic structure of the 2022 Menyuan MW 6.6 earthquake, Qinghai Province, constrained by InSAR and Gaofen-7 observation[J]. Chinese Journal of Geophysics, 65(12): 4704-4724. (in Chinese with English abstract [36] YANG H F, WANG D, GUO R M, et al., 2022. Rapid report of the 8 January 2022 MS 6.9 Menyuan earthquake, Qinghai, China[J]. Earthquake Research Advances, 2(1): 100113. doi: 10.1016/j.eqrea.2022.100113 [37] YU P F, CHEN W, QIAO X J, et al., 2022. Slip model of the 2022 Menyuan MS 6.9 earthquake constrained by multi-source SAR data[J]. Geomatics and Information Science of Wuhan University, 47(6): 898-906. (in Chinese with English abstract [38] YUAN D Y, XIE H, SU R H, et al., 2023. Characteristics of co-seismic surface rupture zone of Menyuan MS 6.9 earthquake in Qinghai Province on January 8, 2022 and seismogenic mechanism[J]. Chinese Journal of Geophysics, 66(1): 229-244. (in Chinese with English abstract [39] ZHANG Y F, SHAN X J, ZHANG G H, et al., 2020. The 2016 MW 5.9 Menyuan earthquake in the Qilian orogen, China: a potentially delayed depth-segmented rupture following from the 1986 MW 6.0 Menyuan earthquake[J]. Seismological Research Letters, 91(2A): 758-769. doi: 10.1785/0220190168 [40] ZHANG Y F, CHEN J, GONG W Y, et al., 2023. Geodetic modelling of the 2022 MW 6.6 Menyuan earthquake: insight into the strain-partitioned northern Qilian Shan fault system and implications for regional tectonics and seismic hazards[J]. Geophysical Journal International, 233(3): 1987-2003. doi: 10.1093/gji/ggad012 [41] ZHAO D Z, QU C Y, ZHANG G F, et al., 2023. Applications and advances for the coseismic deformation observations, earthquake emergency response and seismogenic structure investigation using InSAR[J]. Seismology and Geology, 45(2): 570-592. (in Chinese with English abstract [42] ZHAO L Q, SUN X Y, ZHAN Y, et al., 2022. The seismogenic model of the Menyuan MS 6.9 earthquake on January 8, 2022, Qinghai Province and segmented extensional characteristics of the Lenglongling fault[J]. Chinese Journal of Geophysics, 65(4): 1536-1546. (in Chinese with English abstract [43] ZHENG B W, GONG W Y, WEN S Y, et al. , 2018. Study on the seismogenic fault characteristics of 2016 Mw5. 9 Menyuan earthquake based on Sentinel-1A data[J]. Seismol. Geol. 40: 872-82. (in Chinese with English abstract [44] ZHENG W J, ZHANG P Z, YUAN D Y, et al., 2019. Basic characteristics of active tectonics and associated geodynamic processes in continental China[J]. Journal of Geomechanics, 25(5): 699-721. (in Chinese with English abstract [45] ZHU L, DAI Y, SHI F Q, et al., 2022. Coulomb stress evolution and seismic hazards along the Qilian-Haiyuan fault zone[J]. Acta Seismologica Sinica, 44(2): 223-336. (in Chinese with English abstract [46] ZUZA A V, WU C, REITH R C, et al., 2018. Tectonic evolution of the Qilian Shan: an early Paleozoic orogen reactivated in the Cenozoic[J]. GSA Bulletin, 130(5-6): 881-925. doi: 10.1130/B31721.1 [47] 陈宣华,邵兆刚,熊小松,等,2019. 祁连造山带断裂构造体系、深部结构与构造演化[J]. 中国地质,46(5):995-1020. doi: 10.12029/gc20190504 [48] 韩帅,吴中海,高扬,等,2022. 2022年1月8日青海门源MS 6.9地震地表破裂考察的初步结果及对冷龙岭断裂活动行为和区域强震危险性的启示[J]. 地质力学学报,28(2):155-168. [49] 何文贵,袁道阳,葛伟鹏,等,2010. 祁连山活动断裂带中东段冷龙岭断裂滑动速率的精确厘定[J]. 地震,30(1):131-137. doi: 10.3969/j.issn.1000-3274.2010.01.015 [50] 胡朝忠,杨攀新,李智敏,等,2016. 2016年1月21日青海门源6.4级地震的发震机制探讨[J]. 地球物理学报,59(5):1637-1646. doi: 10.6038/cjg20160509 [51] 季灵运,刘传金,徐晶,等,2017. 九寨沟MS 7.0地震的InSAR观测及发震构造分析[J]. 地球物理学报,60(10):4069-4082. doi: 10.6038/cjg20171032 [52] 梁宽,何仲太,姜文亮,等,2022. 2022年1月8日青海门源MS6.9地震的同震地表破裂特征[J]. 地震地质,44(1):256-278. doi: 10.3969/j.issn.0253-4967.2022.01.016 [53] 刘洋,许才军,温扬茂,等,2019. 门源MW5.9级地震形变InSAR观测及区域断裂带深部几何形态[J]. 武汉大学学报(信息科学版),44(07):1035-1042. [54] 李振洪,韩炳权,刘振江,等,2022. InSAR数据约束下的2016年和2022年青海门源地震震源参数及其滑动分布[J]. 武汉大学学报(信息科学版), 47 (6):887-897. [55] 刘白云,曾文浩,袁道阳,等,2015. 1927年古浪8级大地震断层面参数和滑动性质[J]. 地震地质,37(3):818-828 [56] 马保起,李德文,2008. 祁连山中段门源盆地新构造运动的阶段划分[J]. 地质力学学报,14(3):201-211. doi: 10.3969/j.issn.1006-6616.2008.03.002 [57] 潘家伟,李海兵,CHEVALIER M L,等,2022. 2022年青海门源MS6.9地震地表破裂带及发震构造研究[J]. 地质学报,96(1):215-231. doi: 10.3969/j.issn.0001-5717.2022.01.018 [58] 汤大委,葛伟鹏,袁道阳,等,2023. 青藏高原北部历史强震对2022年门源MS6.9地震及后续地震库仑应力触发作用[J]. 地球物理学报,66(7):2772-2795. doi: 10.6038/cjg2022Q0400 [59] 王欣,李水平,康晶,2023. InSAR观测约束2022年门源MW 6.7级地震同震滑动分布和库伦应力变化[J]. 测绘通报(7):32-38. [60] 吴晨,陈宣华,丁林,2023. 祁连造山带构造演化与新生代变形历史[J]. 地学前缘,30(3):262-281. [61] 许光煜,徐锡伟,易亚宁,等,2022. 2022年青海门源MW6.6地震发震构造:来自InSAR和高分影像约束[J]. 地球物理学报,65(12):4704-4724. doi: 10.6038/cjg2022Q0080 [62] 余鹏飞,陈威,乔学军,等,2022. 基于多源SAR数据的2022年门源MS6.9地震同震破裂模型反演研究[J]. 武汉大学学报·信息科学版,47(6):898-906. [63] 袁道阳,谢虹,苏瑞欢,等,2023. 2022年1月8日青海门源MS6.9地震地表破裂带特征与发震机制[J]. 地球物理学报,66(1):229-244. doi: 10.6038/cjg2022Q0093 [64] 赵德政,屈春燕,张桂芳,等,2023. 基于InSAR技术的同震形变获取、地震应急监测和发震构造研究应用进展[J]. 地震地质,45(2):570-592. doi: 10.3969/j.issn.0253-4967.2023.02.016 [65] 赵凌强,孙翔宇,詹艳,等,2022. 2022年1月8日青海门源MS6.9地震孕震环境和冷龙岭断裂分段延展特征[J]. 地球物理学报,65(4):1536-1546. doi: 10.6038/cjg2022Q0051 [66] 郑文俊,张培震,袁道阳,等,2019. 中国大陆活动构造基本特征及其对区域动力过程的控制[J]. 地质力学学报,25(5):699-721. doi: 10.12090/j.issn.1006-6616.2019.25.05.062 [67] 郑博文,龚文瑜,温少妍,等,2018. 基于Sentinel-1A的2016年青海门源M_W5.9地震发震构造特征[J]. 地震地质,40(04):872-882. doi: 10.3969/j.issn.0253-4967.2018.04.011 [68] 朱琳,戴勇,石富强,等,2022. 祁连—海原断裂带库仑应力演化及地震危险性[J]. 地震学报,44(2):223-236. doi: 10.11939/jass.20220012 -

 下载:
下载:


计量
- 文章访问数: 2248
- HTML全文浏览量: 202
- PDF下载量: 59
- 被引次数: 0
