
Figure
1.
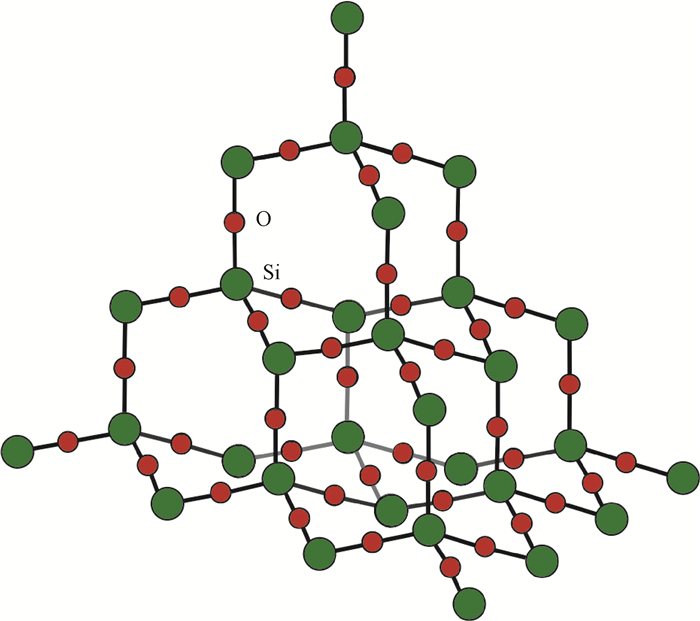
Quartz lattice structure, interstitial space between atoms where exoelectrons can move in
| Citation: | SONG Huizhen,
1999. A ATTEMPT OF QUANTITIVE PREDICTION OF NATURAL CRACK ON BRITTLE ROCK RESERVOIR. Journal of Geomechanics, 5 (1): 78-86.

|
Brady[1, 2], Li[3], Anastasiadis[4], Jensen[5], Niu[6], Ma[7, 8], and Yao[9] have researched the electromagnetic properties of rocks under stress, and the electromagnetic (EM) waves produced and their interaction with the ionosphere.
To measure the electric current pulse produced under stress of fracturing rock samples, the charge measuring digital electrometer[4], and the short-circuit(to ground) streaming current[5] method have been used. Both show that at the onset of fracture there is a DC current pulse.
This experiment uses a third method: a closed series circuit to measure the induced exoelectron cloud. A battery is in series with a digital voltmeter, oscilloscope, and the rock sample. The digital voltmeter measures the DC current flow caused by the battery's electric field, while the oscilloscope measures the AC component induced as the exoelectron cloud absorbs EM waves. The advantage of this closed setup is that both DC and AC currents are measured and it is easier to explore the physical origins of the exoelectron current.
Various phenomenological models have been proposed to explain the data: piezoelectric effect[1], and the moving charge dislocation model[4] (MCD). The existing Standard Lattice Model (SLM) popularized by physicists, and chemists is adopted here.
Poly-crystalline rocks (where the crystals are randomly oriented) can be modeled as a lattice array of predominantly Si-O-Si bonds(Figure 1). Other atoms can substitute for Si, eg. Li, Al, Ca, Na, etc.
Under high pressure, the outer shell electron of the Si-O dipole will get squeezed into the interstitial space between atoms, creating a loosely bound exoelectron cloud that increases as the stress increases. This phenomenon which appears at high stress, is due to two sources: (a) the quantum mechanical electron tunneling effect[10], and (b) breaking bond electrons.
(a) The outermost electron of the oxygen atom is bound in a shallow potential well (~0.38 volts); when stress energy is applied, this electron absorbs part of this energy, thus increasing its kinetic energy. By itself, this slight increase in energy is insufficient for the electron to overcome and jump out of its potential well; but it is enough to increase its probability of tunneling through the well wall into the lattice interstitial between atoms. This probability multiplied by the number of available oxygen atoms gives the number of the electrons that tunnel out and form the exoelectron cloud: typically of the order of picocoulombs to nanocoulombs.
(b) Electrons released by breaking bonds from micro-crack initiation. Crack nucleation centres most probably start in parallel. Whenever a Si-O bond breaks, a dangling +Si bond is created along with a free electron attached to the -O atom which will hop from atom to atom. This electron current is proportional to the cracks'surface area, and the collection efficiency of the battery electrodes. The broken bond electron cloud is much more than the tunneling cloud.
The measured current pulse will have an initial slowly rising tunneling part, followed by a suddenly rising broken bond current.
The lattice under high pressure will also give rise to the following phenomena:
① strain-creep related EM radiation: due to the changes in Si-O dipole moment as the lattice contracts, and flows in different directions.
② light emission from breaking, and recombining Si-O bonds.
③ charge accumulation, and separation resulting in spark discharges and the concurrent light and EM emissions.
④ sound emissions from the strained lattice, and eventually crack propagation.
Further experiments are underway to measure these effects as a function of pressure.
Generally speaking, the exoelectron current effect is measurable in hard insulator rocks (granite, basalt, limestone, marble, etc.): the stress energy goes into distorting and breaking the Si-O bonds. In soft rocks (sandstone, shale, etc.) the stress energy is dissipated as the rock grains are forced into the inter-granular voids thus reducing the energy that could go into stressing the lattice bonds: consequently the exoelectron current is not measurable. Conducting rocks (pyrite, etc.) which have a relatively high background current flow would mask the normally weak exoelectron current(nano-amp range).
For this experiment granite (large grained, igneous rock) and basalt (fine grained) samples were chosen to differentiate between the piezoelectric explanation and the SLM explanation for the tunneling and broken bond current measured. Sandstone (porous) and shale (sedimentary rock) were also measured and show no clear exoelectron current effect. Marble (metamorphic rock) has been measured by others[4], and shown to have the DC exoelectron effect.
When the stressed core sample is placed in series with a battery, voltmeter and oscilloscope, the electron cloud will flow. The voltmeter detects the direct current (DC) I, and the oscilloscope measures the alternating current (AC) component.
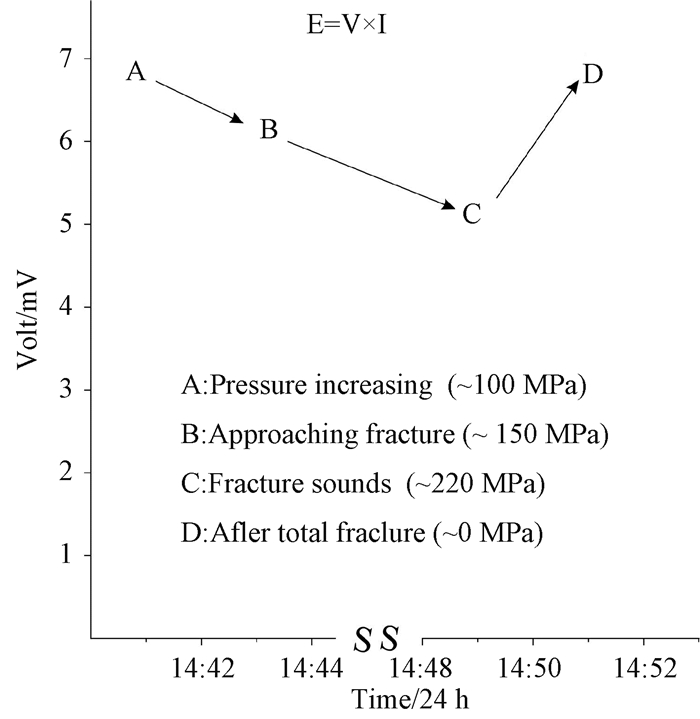
The exoelectron cloud will also absorb, and scatter an E.M. wave. The wave's energy E (a constant) is converted into the induced alternating (AC) current's power: V(f)×I(f). The frequency of the current is also the wave's frequency f.
The energy of the EM wave is a constant during the experiment: E=V×I. Thus when the current I increases (as when tunneling electrons and breaking bond electrons move into the interstitial lattice), V drops. This drop in the AC amplitude as the stress increases is measured with the oscilloscope's Fourier Transform feature.

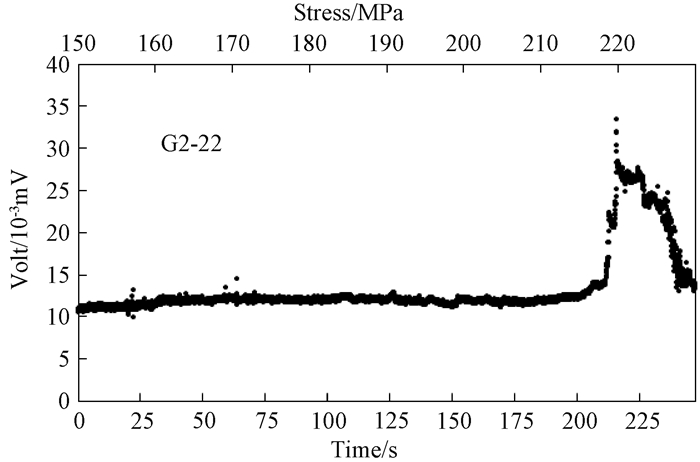
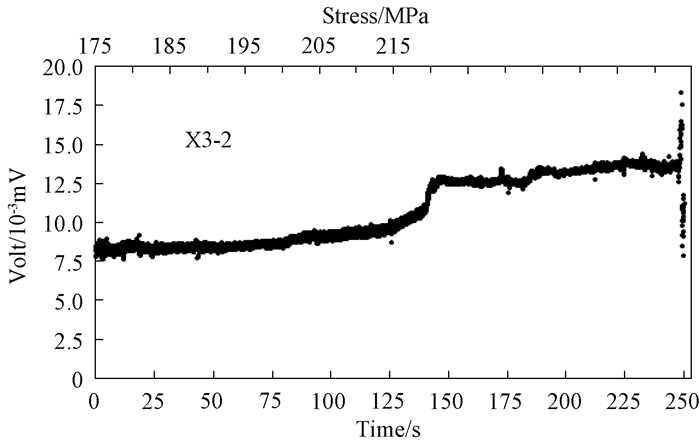
The direct current I (mV) vs Stress curves measured by the digital voltmeter (DVM) for granite (Figure 3), and basalt follow (Figure 4). Both show an initial distinct gradual rise in I (due to the tunneling current), before a sudden rise (due to breaking bonds) at the fracture point.
The next photo shows the AC current results: First is the oscilloscope trace of the 50 Hz AC current component; then immediately below, the Fourier Transform showing the 50 Hz peak bracketed by left cursor at 40 Hz and right cursor at 60 Hz.(Figure 5)
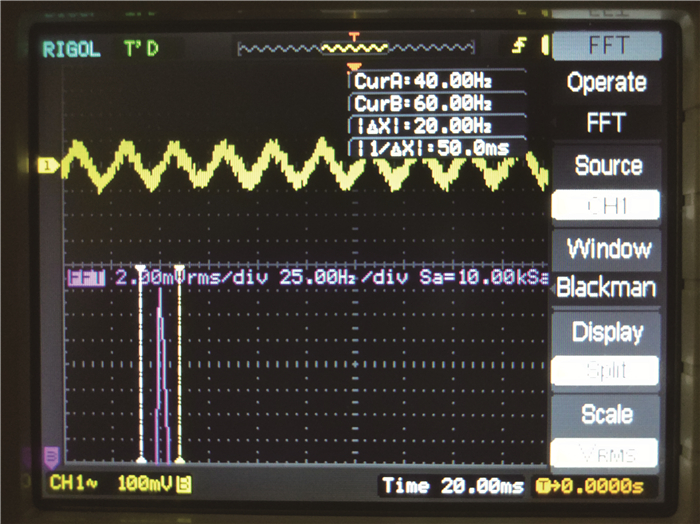
Figure 6 shows the start of the drop in the FT voltage peak as the AC current increases at higher and higher stress. A minimum is reached just before the major fracture, and minor cracks sounds are heard. After complete fracture and the stress drops to zero, the voltage peak rises back to the same level before stress was applied.
This small experiment confirms that EM waves can actively probe the stress changes in a highly stressed crust zone just before crack initiation. As the stress increases to breaking point, the exoelectron cloud increases in size.
It has been suggested that the DC exoelectron current effect can be due to a piezoelectric cause. However a careful use of the Standard Lattice Model rules out this explanation: 1) Both granite (with coarse grained randomly oriented crystals, which might have a piezoelectric effect) and basalt (with fine grained crystals, with no known piezoelectric properties) have the same characteristic I(current) vs Stress curve at the approach to rupture, i.e. a slow rise followed by a sharp rise. 2) The strain/stress on a non-central symmetric piezoelectric crystal induces an electric field (voltage), but no free electrons. This is the definition of the piezoelectric effect. 3) Moreover, the piezo-voltage effect is present at low pressures too; Whereas the exoelectron current effect is only observed at high stress close to the rupture point.
The exo-electron cloud and the induced DC current explains in a simple way the changes in rock sample conductivity (resistance) at high stress or pressures as reported by others. It also is the reason for increases in the measured electric charge field in crushing concrete compression tests.
Ultra-low-frequency (ULF) waves[3] interacting with the ionosphere are being studied for earthquake precursors. These time-coincident data are complicated and do not show a clear cause-effect relationship. Satellite and ground receivers are used in this research.
These studies use a 'passive' method unlike the 'active' approach proposed in this research: a radio transmitter transmits an EM wave that reflects off the exoelectron cloud created by a high differential stress fault zone.
This active method would complement the existing ground station, and satellite receiving networks.
The AC (alternating current) exoelectron current effect shows that the absorption of EM waves by rupturing rock, though small, is measurable and can be exploited to good effect.
A probing E.M. wave beam will reflect off the exoelectron cloud produced at a high stress fault zone. When the differential stress reaches a critical intensity, the zone's strained crystal structure starts releasing more and more exoelectrons. Eventually the crystalline rock structure starts to crack producing an event. Further experiments are planned to measure and confirm this remote active sensing method.
The reflected EM waves data would complement in-situ stress data[6, 7]. These two methods together would be more effective than either one individually.
It is pointed out that other phenomena: strain-creep radiation, light emission, sound emission, and static electricity are produced concurrently. The detection and measurement of all the above five phenomena would be a necessary condition to anticipate an actual event.
This research was supported by a Director's Research grant(2016-2018, DZLXJK201605). The assistance, and advice from the following are gratefully noted: PENG Hua, WANG Hongcai, MA Xiumin, JIANG Jingjie, PENG Liguo, WANG Fusheng, MA Yue, SUN Dongsheng, LIU Shengxin
Website Copyright © Journal of Geomechanics 京ICP备18031784号 Total visits:6197259
Supported by:
Beijing Renhe Information Technology Co., Ltd.

HUANG Qiwen, LI Awei, 2019. STRESS INDUCED CHANGES IN THE ELECTRICAL-MAGNETIC PROPERTIES OF ROCK CORESHUANG. Journal of Geomechanics, 25 (4): 453-458. DOI: 10.12090/j.issn.1006-6616.2019.25.04.042

 DownLoad:


 DownLoad: