


Study of main faults and deep-seated structural characteristics of Shanghai and adjacent areas based on gravity and magnetic anomalies
-
摘要: 为研究上海及邻区的深部结构特征、厘定区内湖苏断裂和江绍断裂的空间展布尤其是入海后的延伸方向,利用航空重力与航空磁力数据,采用重磁异常三维物性反演构建了该区地壳剩余密度模型及磁化强度模型。通过分析区内地壳结构特征及其与重磁异常的对应关系表明区内多数重磁源不相关但存在较显著的伴生特征,即中强磁性广泛分布于密度异常梯度带上。研究表明上海及邻区地壳隆升与凹陷构造是产生局部重力异常的主要因素之一,根据重磁异常特征推测隆起构造边缘沿断裂构造侵入的中酸性花岗岩是引起伴生磁异常的主要因素。三维剩余密度与磁性模型揭示湖苏断裂与江绍断裂两侧存在显著的物性异常,呈北东向延伸入海,其中湖苏断裂倾向南东向、江绍断裂倾向北西向,影响深度达20 km。基于三维剩余密度模型不同深度的水平切片识别出长江口地壳环形构造,该环形构造挟持于湖苏断裂与江绍断裂之间,反映中—下地壳凹陷的宏观特征。研究成果突出了基于重磁异常反演构建的三维剩余密度模型与磁化强度模型在上海及邻区深部结构探测中发挥的作用,揭示了湖苏断裂和江绍断裂两侧密度异常与磁性异常的变化特征,为该区深部结构研究提供了新线索。Abstract:
Objective Shanghai and its surrounding areas play a vital role in China’s economic development. As the region is also prone to earthquakes that are felt by local residents, its crustal structure has attracted considerable research interest. Despite previous investigations, uncertainties remain regarding the spatial distribution of major deep-seated faults, particularly the Hu-Su and Jiang-Shao faults, and their offshore extensions into the East China Sea. Methods Airborne gravity and magnetic data were used to perform three-dimensional physical-property inversion and construct crustal residual-density and magnetization models for the study area. Results Correlation analysis of gravity and magnetic anomalies revealed that the sources of these anomalies are distinct but spatially associated, with absolute correlation coefficients below 0.4. Medium-to high-intensity magnetic anomalies are widely distributed along density-anomaly gradient zones, suggesting that intermediate-to-felsic intrusions along the margins of uplifted structures are the main source of the magnetic anomalies. Conclusions This study provides critical quantitative constraints on the faults and on a crustal ring structure. Analysis of the gravity and magnetic features of the Hu-Su and Jiang-Shao fault segments that extend into the East China Sea indicates that both faults reach a depth of 20 km and control the tectonic framework of the Shanghai region. In addition, the density model reveals a crustal ring structure in the Yangtze Estuary. Significance Our findings highlight the value of 3D inversion models derived from magnetic and gravity data and underscore the need to revise interpretations through 3D inversions of high-quality potential-field data—a step that is vital for understanding the crustal structure in the region. -
Key words:
- magnetic anomaly /
- gravity anomaly /
- three-dimensional inversion /
- fault analysis /
- residual density
-
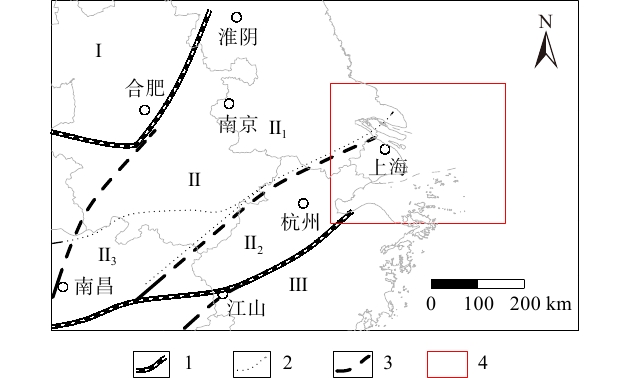
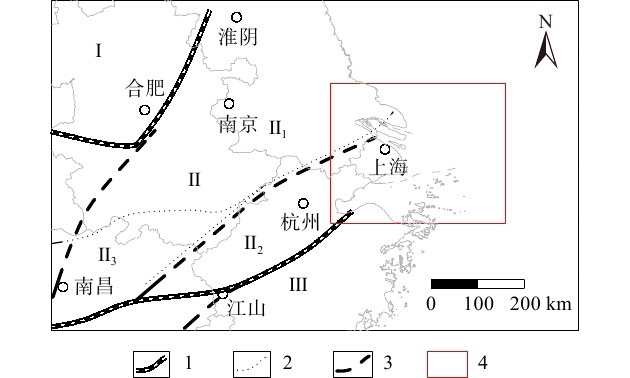
图 1 区域大地构造单元划分图(据火恩杰等,2004修改)
1—一级大地构造单元界线;2—二级大地构造单元界线;3—断裂(带);4—研究区Ⅰ—华北地台;Ⅱ—扬子准地台;Ⅱ1—下扬子台褶带;Ⅱ2—浙西台褶带;Ⅱ3—江南台背斜;Ⅲ—华南地槽系
Figure 1. Subdivision of regional tectonic units (modified from Huo et al., 2004)
1–boundary of first-order tectonic unit; 2–boundary of second-order tectonic unit; 3–fault (zone); 4–study areaⅠ–North China Platform; Ⅱ–Yangtze Paraplatform; Ⅱ1–Lower Yangtze Platform–Fold belt; Ⅱ2–Western Zhejiang Platform–Fold belt; Ⅱ3–Jiangnan Platform Anticlinorium; Ⅲ–South China Geosynclinal System
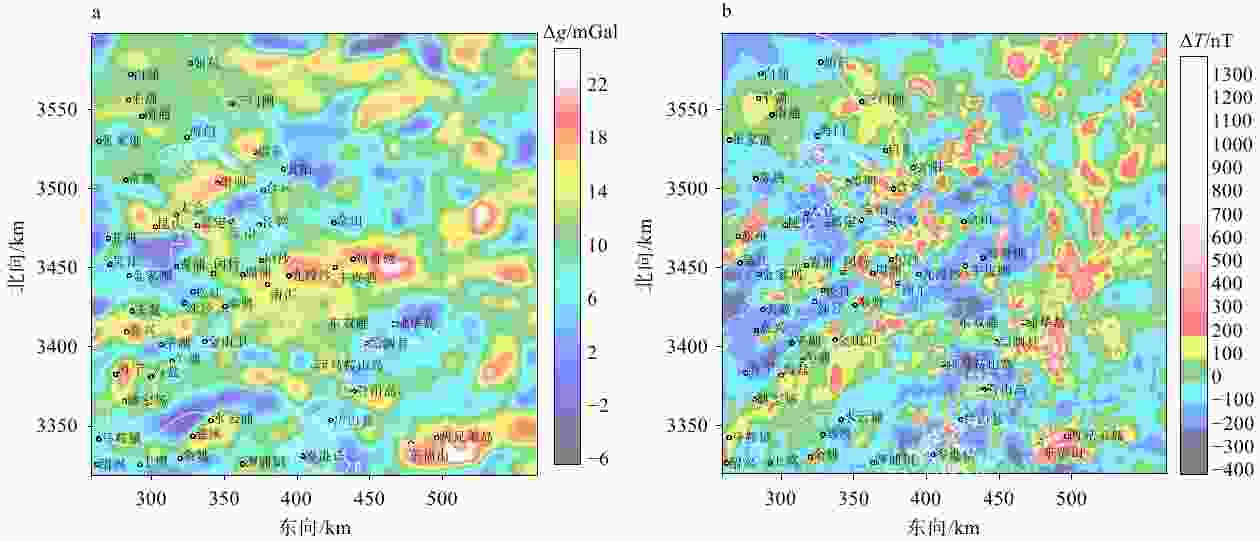
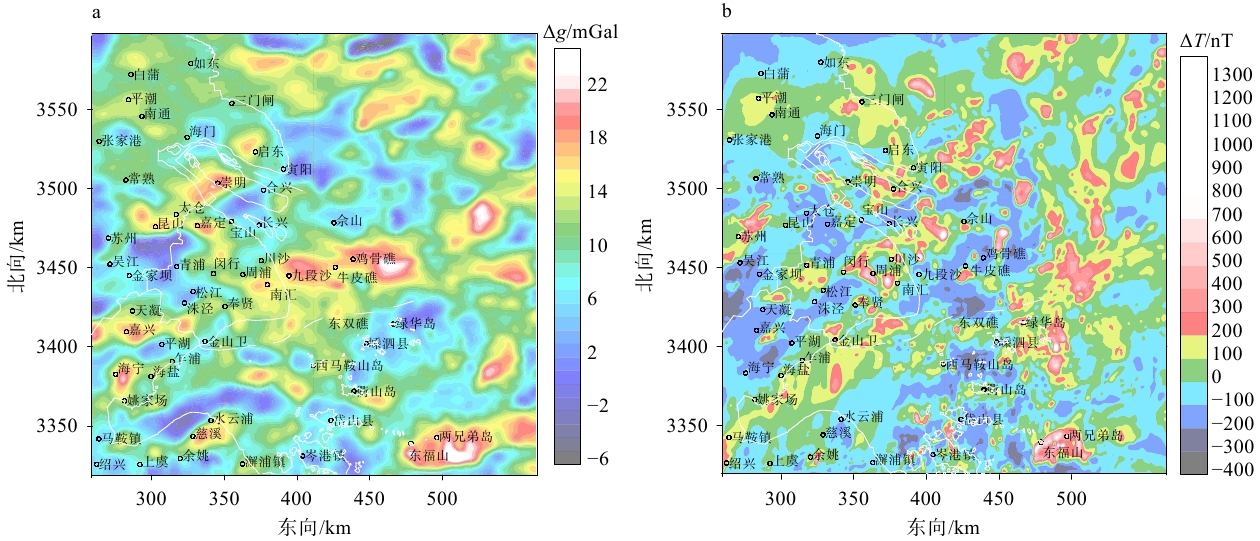
图 2 上海及其相邻地区重磁异常图
Δg—重力异常;ΔT—磁异常a—局部重力异常;b—化极磁异常
Figure 2. Gravity and magnetic anomalies in Shanghai and its adjacent areas
(a) Residual gravity anomaly; (b) Magnetic anomaly reduced to the pole (RTP)Δg–gravity anomaly; ΔT–magnetic anomaly
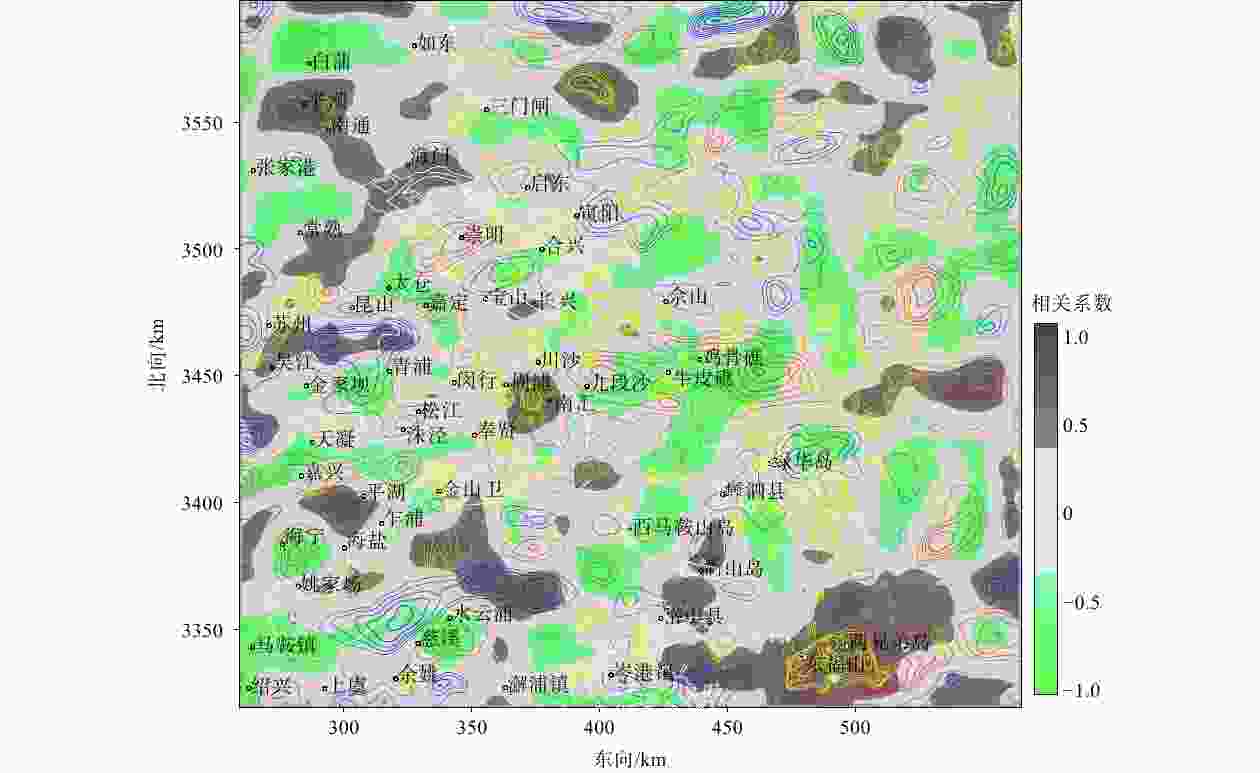
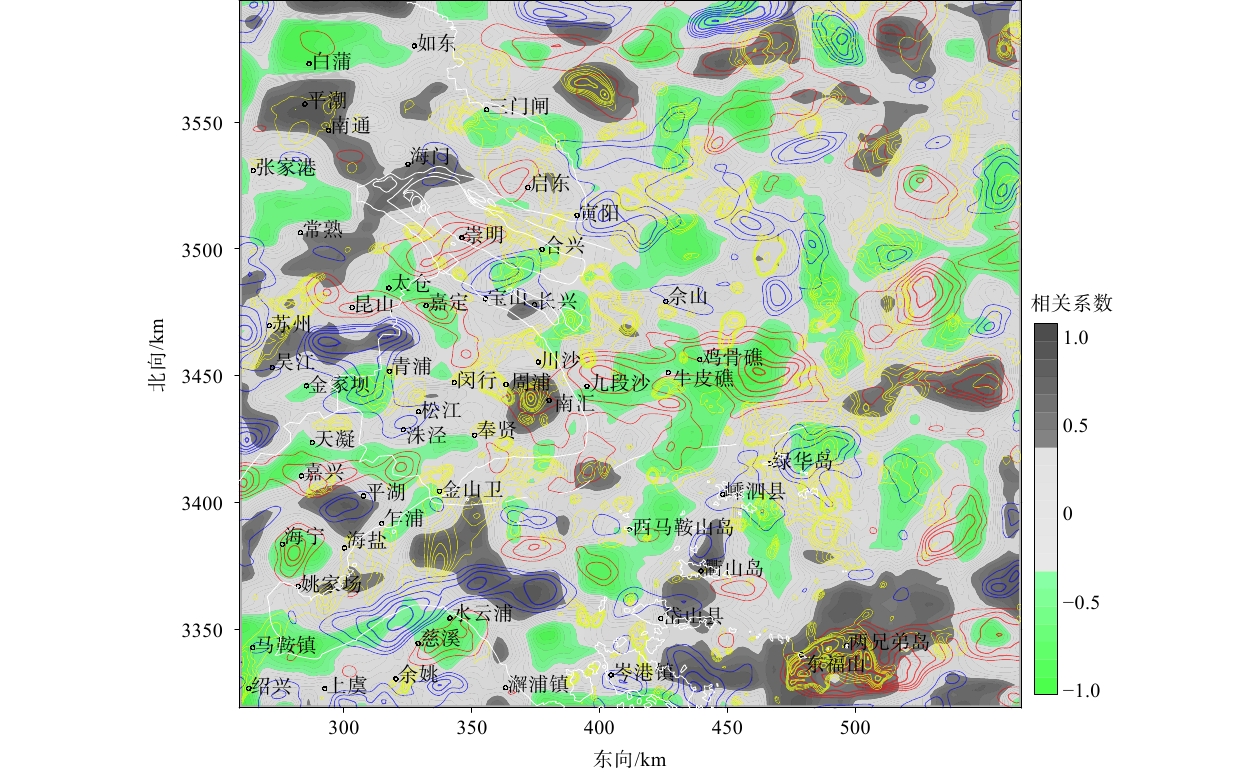
图 3 重磁异常对应分析
底图等值线表示相关系数;黄色、红色、蓝色等值线分别表示高磁异常(幅值大于100 nT)、高重力异常(大于14 mGal)、低重力异常(小于6 mGal)
Figure 3. Correlation of gravity and magnetic anomalies
The background contours represent correlation coefficients; the yellow, red, and blue contours represent high magnetic anomalies (>100 nT), high gravity anomalies (>14 mGal), and low gravity anomalies (<6 mGal), respectively.
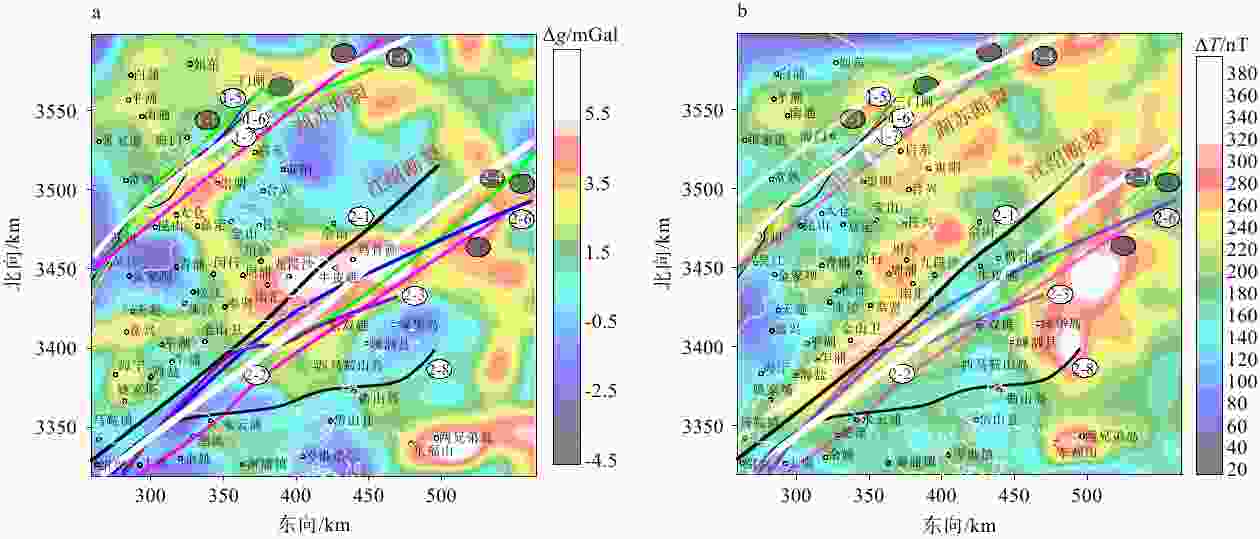
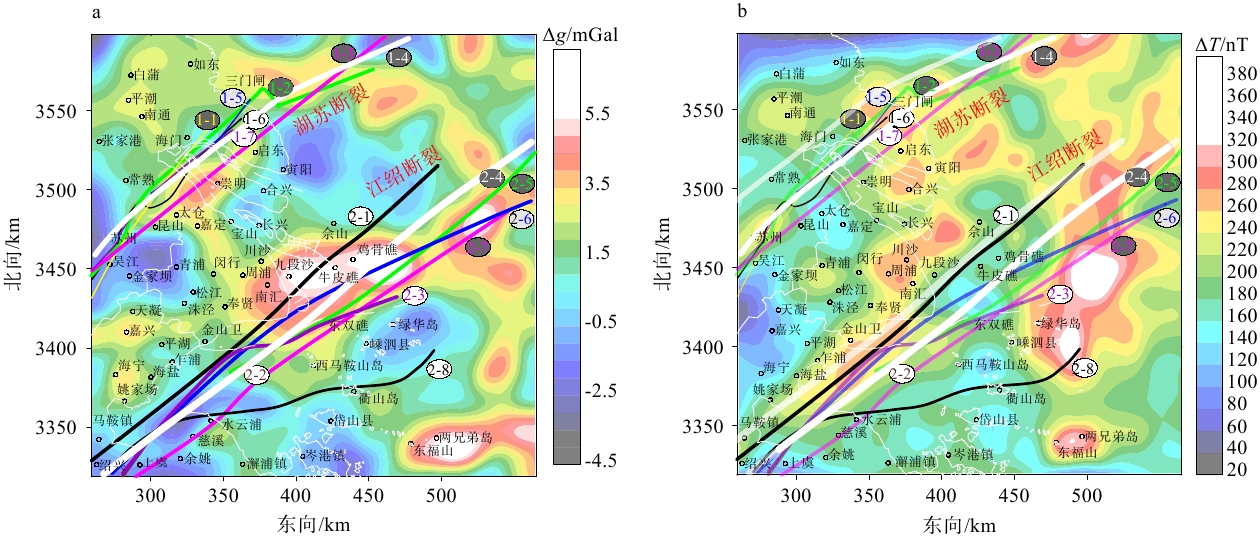
图 4 上海及其相邻地区重磁异常向上延拓图
图中不同颜色的线条表示推测的2条断裂位置,编号及参考文献分别为:1-1(冯策等,2024),1-2(刘建达等,2009),1-3(谢建磊,2018),1-4(此次推测),1-5(尚鲁宁等,2024),1-6(顾澎涛,1993),1-7(张颐彪等,2025);2-1(顾勤平等,2022),2-2(陈涛等,2023),2-3(汪发祥,2016),2-4(此次推测),2-5(王舒畋和李斌,2009),2-6(尚鲁宁等,2024),2-7(Zhu et al.,2022),2-8(李起彤和毛正毅,1986)Δg—重力异常;ΔT—磁异常a—局部重力异常向上延拓10 km;b—化极磁异常向上延拓10 km
Figure 4. Upward-continued gravity and magnetic anomalies in Shanghai and its adjacent areas
(a) Residual gravity anomaly upward-continued to a height of 10 km; (b) RTP magnetic anomaly upward-continued to a height of 10 kmΔg—gravity anomaly;ΔT—magnetic anomalyThe colored lines indicate two inferred fault locations; the corresponding labels and references are: 1-1–Feng et al.(2024);1-2–Liu et al. (2009); 1-3–Xie (2018); 1-4–this study; 1-5–Shang et al. (2024); 1-6–Gu (1993); 1-7–Zhang et al. (2025); 2-1–Gu et al. (2022); 2-2–Chen et al. (2023); 2-3–Wang (2016); 2-4–this study; 2-5–Wang and Li (2009); 2-6–Shang et al. (2024); 2-7–Zhu et al. (2022); 2-8–Li and Mao (1986)
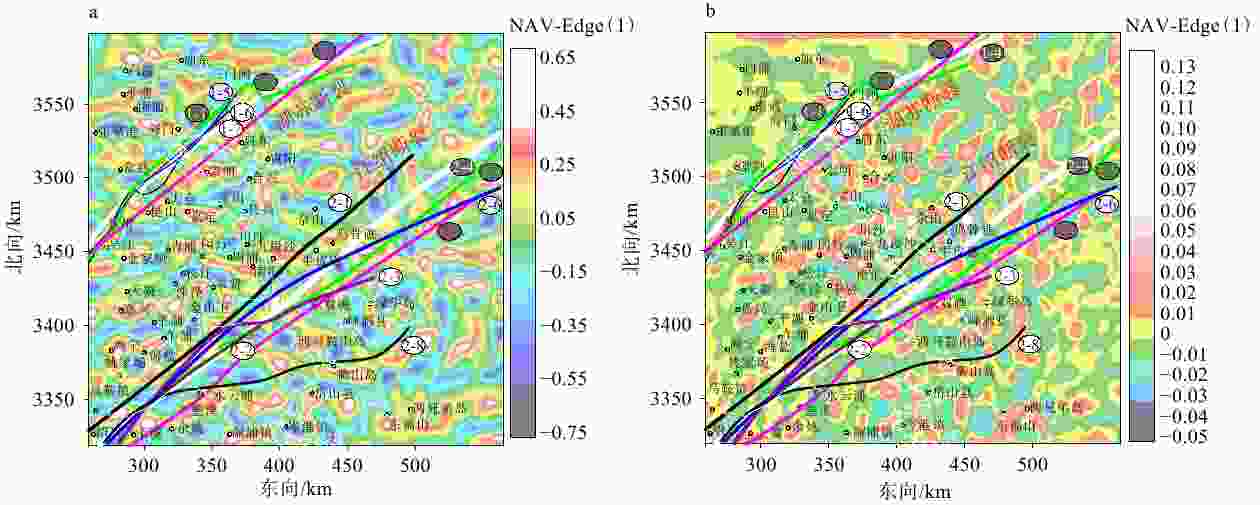
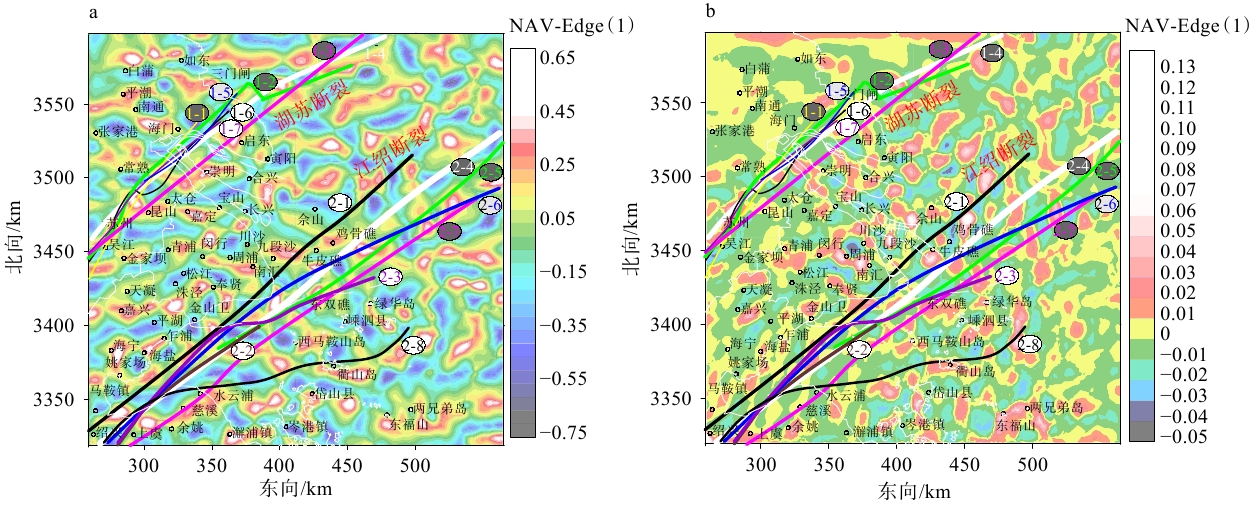
图 5 上海及其相邻地区重磁异常边界识别
图中不同颜色的线条表示推测的2条断裂位置,编号及参考文献见图4a—局部重力异常;b—化极磁异常
Figure 5. Edge detection of gravity and magnetic anomalies in Shanghai and its adjacent areas
(a) NAV-Edge of the residual gravity anomaly; (b) NAV-Edge of the RTPThe colored lines indicate the inferred locations of two faults; The numbers and corresponding references are given in Fig. 4.
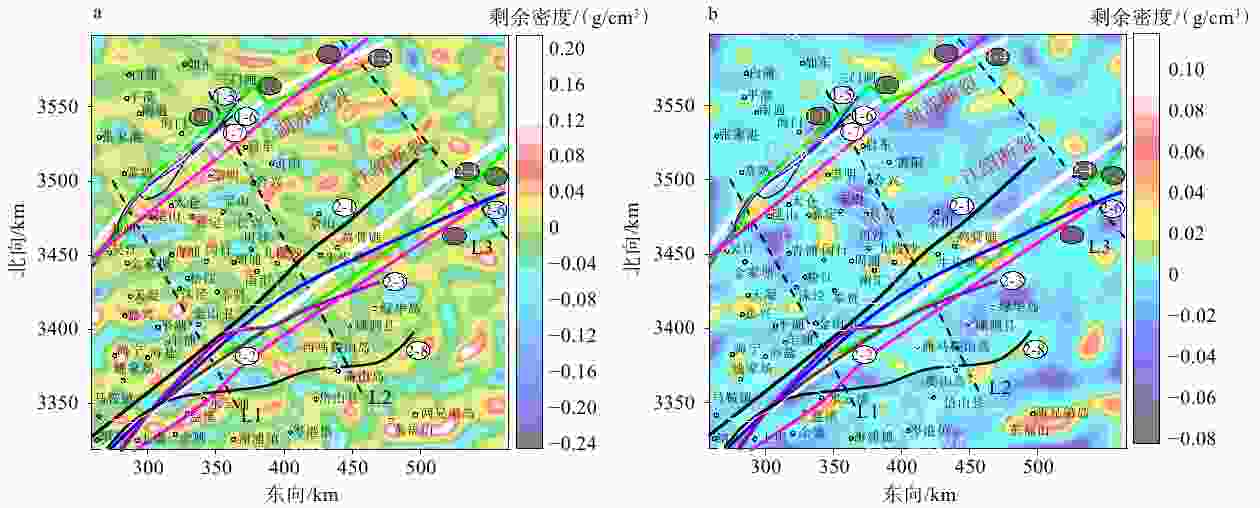
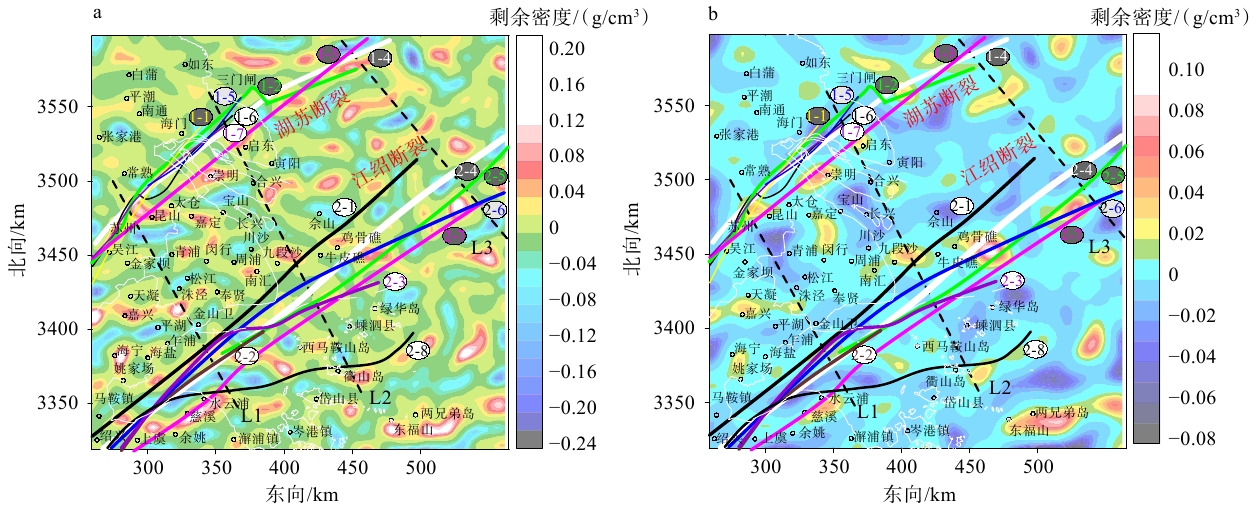
图 6 上海及其相邻地区密度异常水平切片图
图中不同颜色的线条表示推测的2条断裂位置,编号及参考文献见图4;图中黑色虚线L1、L2、L3表示3条剖面位置a—10 km深度;b—20 km深度
Figure 6. Horizontal slices of density contrast in Shanghai and its adjacent areas
(a) Depth of 10 km; (b) Depth of 20 kmThe colored lines indicate the locations of two inferred faults (see Fig. 4 for numbering and references), and the black dashed lines L1, L2, and L3 indicate the locations of three profiles.
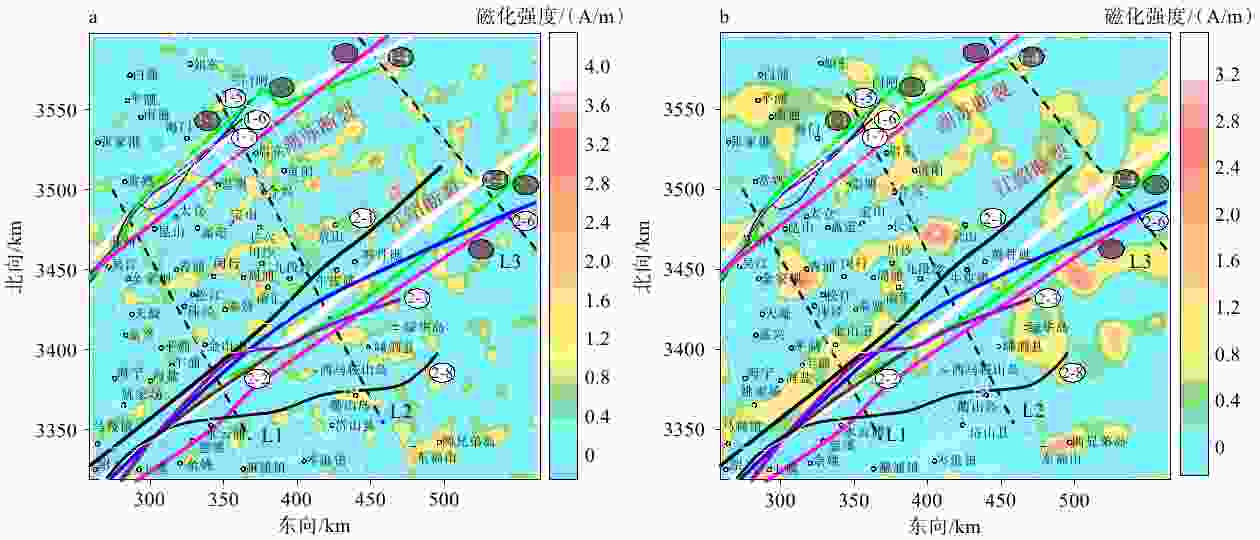
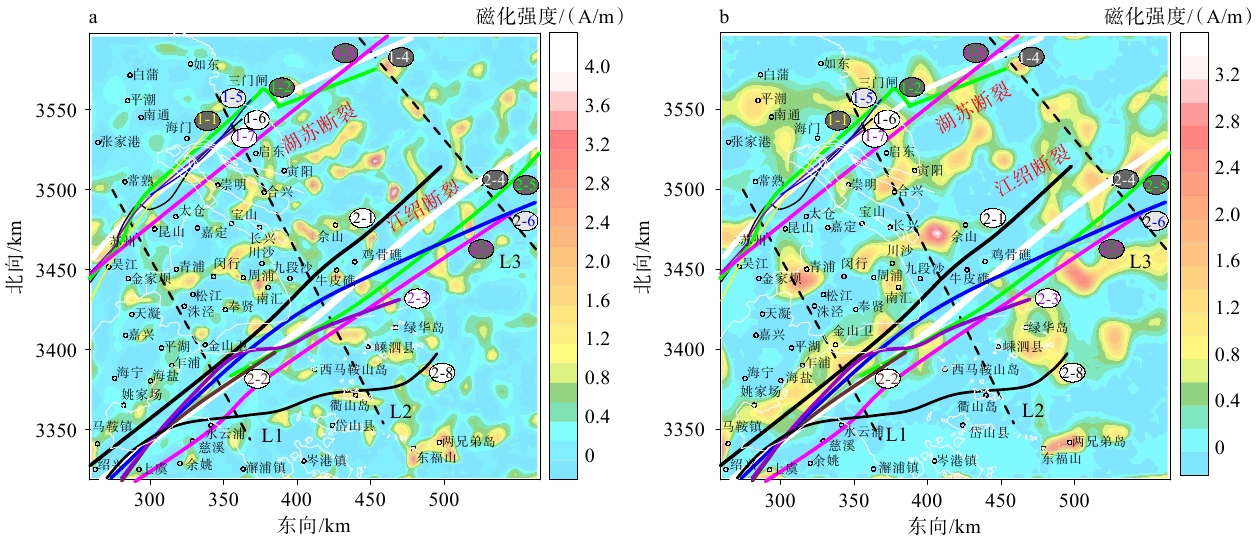
图 7 上海及其相邻地区磁化强度异常水平切片图
图中不同颜色的线条表示推测的2条断裂位置,编号及参考文献见图4;图中黑色虚线L1、L2、L3表示3条剖面位置a—10 km深度;b—20 km深度
Figure 7. Horizontal slices of magnetization intensity in Shanghai and its adjacent areas
(a) Depth of 10 km; (b) Depth of 20 kmThe colored lines indicate the locations of two inferred faults (see Fig. 4 for numbering and references), and the black dashed lines L1, L2, and L3 indicate the locations of three profiles.
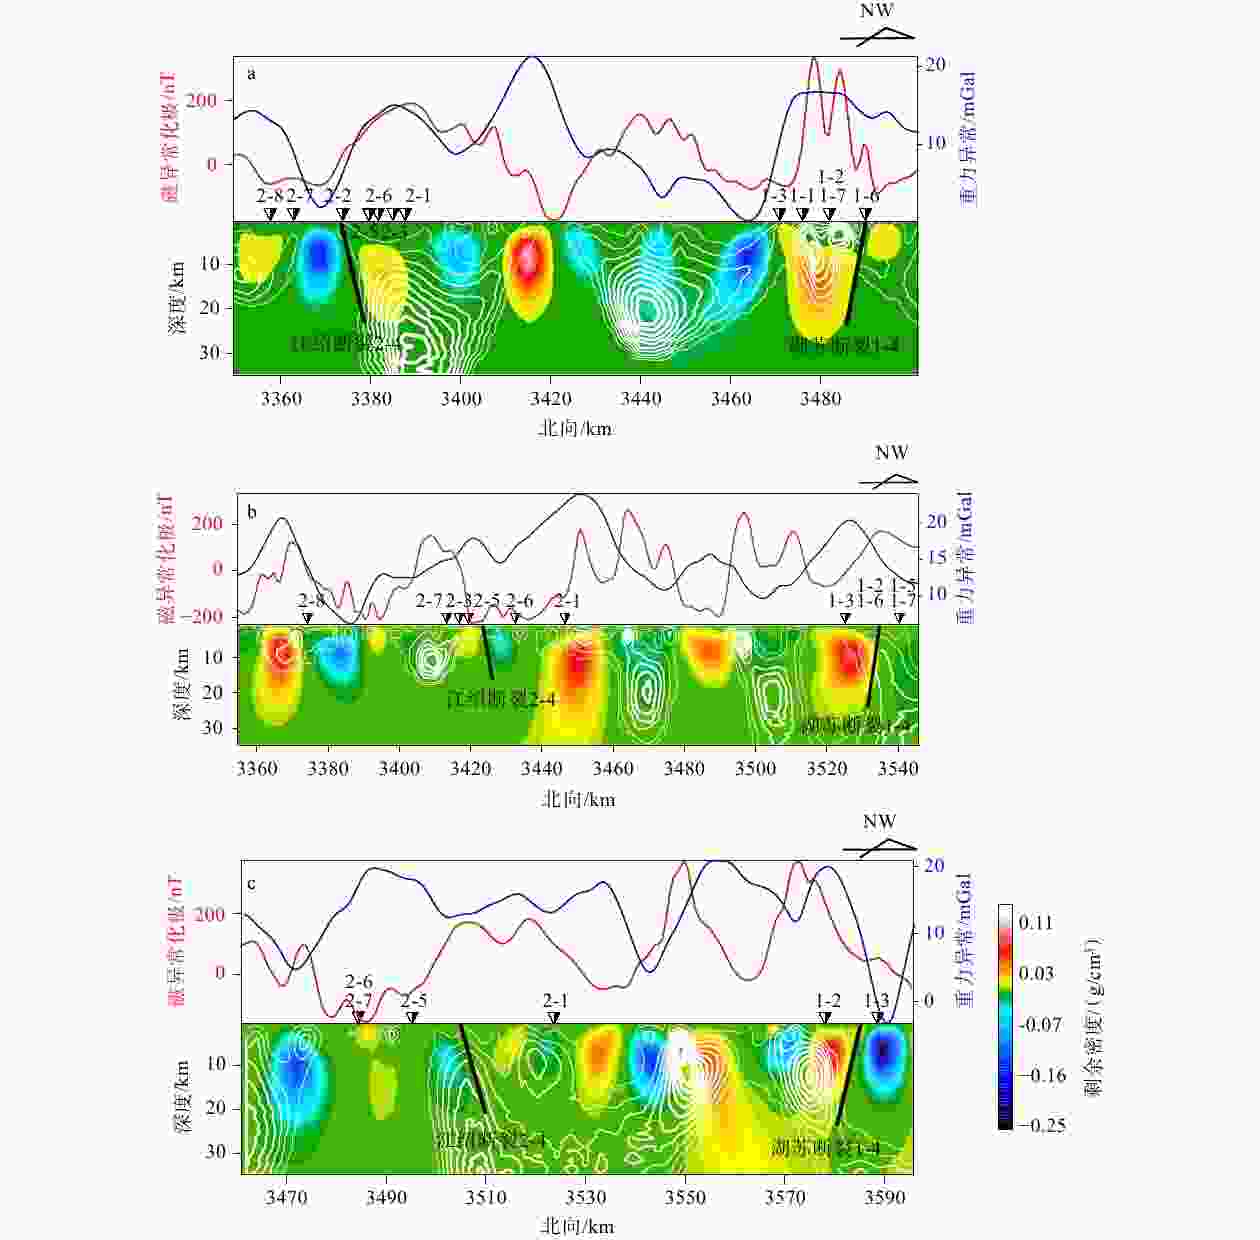
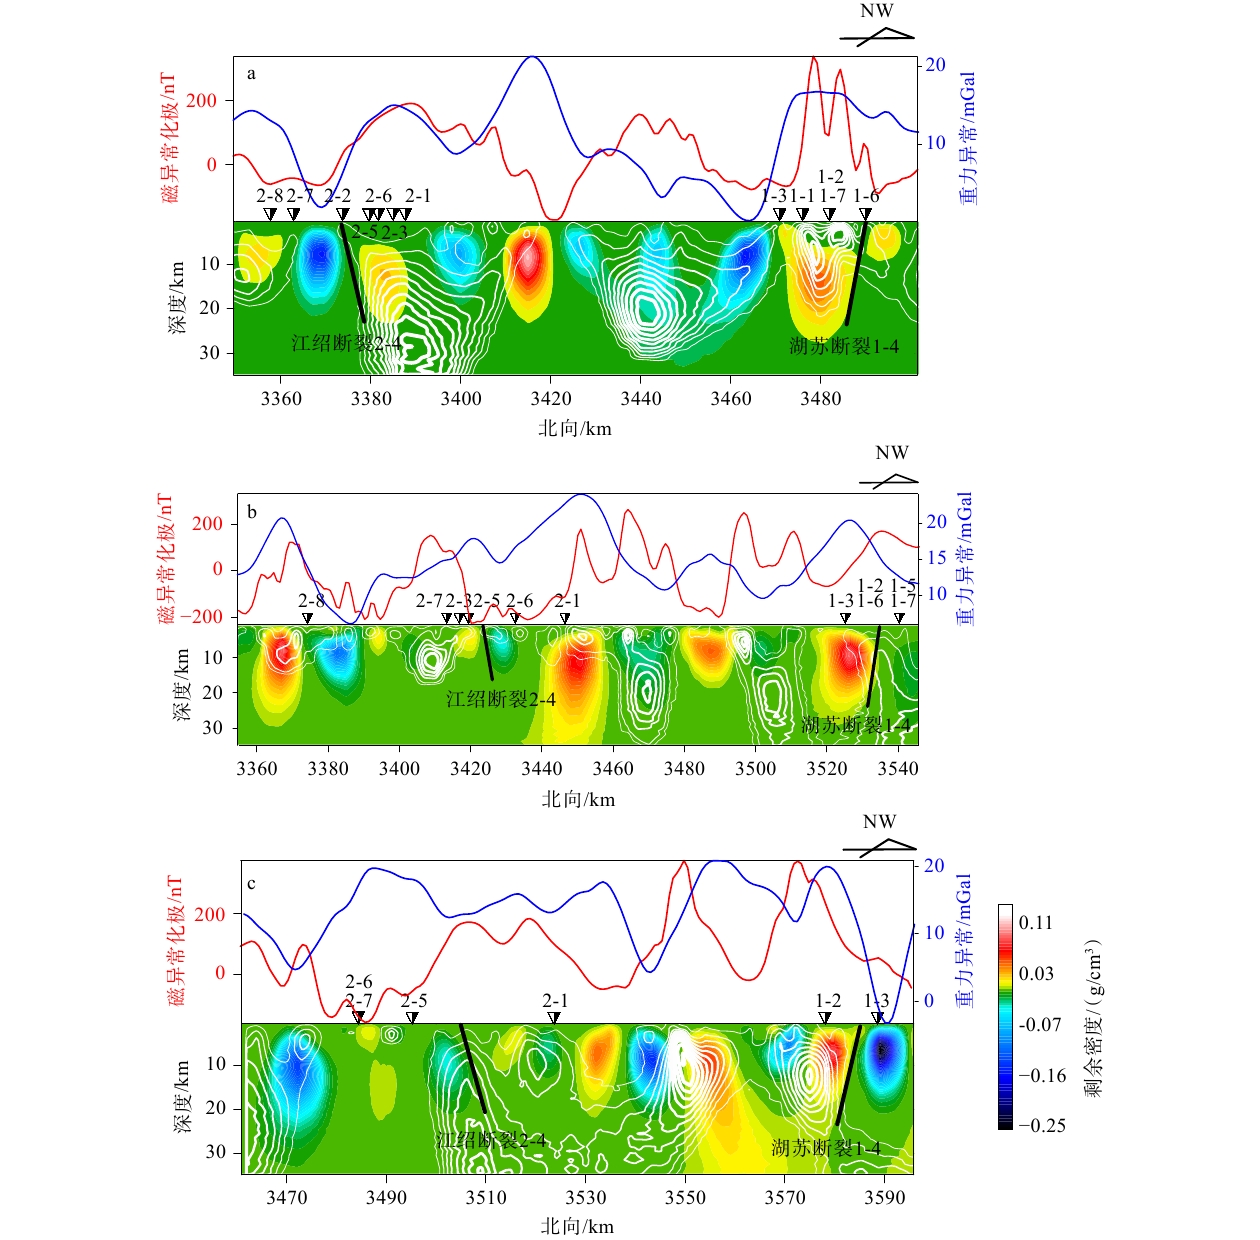
图 8 综合地球物理剖面图
图中白色等值线表示磁化强度为0.1~2.0 A/m;黑色线条表示此次推测的断裂;带编号的倒三角形表示已有推测的断裂位置(具体说明见图4)a—L1剖面重磁异常及反演的密度异常与磁化强度异常切片;b—L2剖面重磁异常及反演的密度异常与磁化强度异常切片;c—L3剖面重磁异常及反演的密度异常与磁化强度异常切片
Figure 8. Integrated geophysical profiles
(a) Profile L1 showing gravity and magnetic anomalies, inverted density contrast, and magnetization intensity; (b) Profile L2 showing gravity and magnetic anomalies, inverted density contrast, and magnetization intensity; (c) Profile L3 showing gravity and magnetic anomalies, inverted density contrast, and magnetization intensityThe white contours represent magnetization intensities of 0.1–2.0 A/m. The black lines indicate faults inferred in this study, and the numbered inverted triangles indicate fault locations inferred by previous researchers (see Fig. 4 for details).
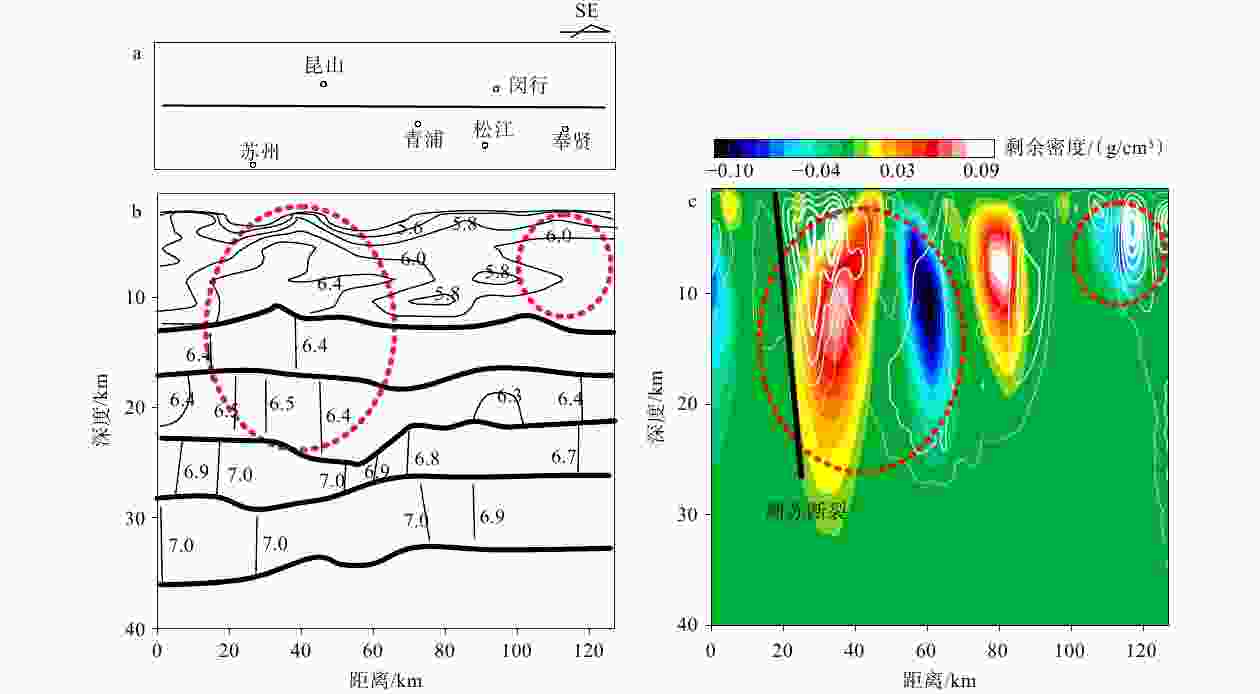
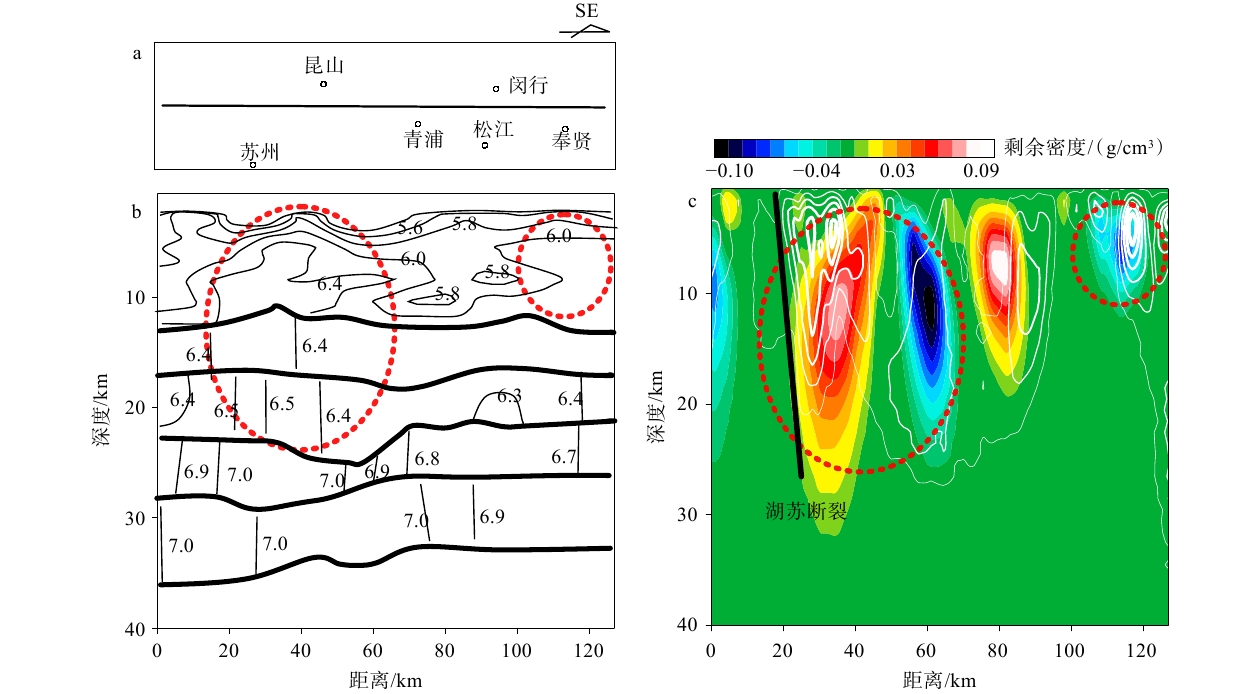
图 9 地震测深大剖面HQ-13综合地球物理图
图中红色虚线圈定的范围表示波速、密度、磁化强度异常a—剖面位置示意图;b—层析成像得到的地壳波速结构(图中黑色粗线表示速度分界线;黑色细线表示速度等值线;数值表示地震波速度,km/s;白志明,2002));c—此次反演得到的密度异常(图中白色等值线表示磁化强度为0.1~2.0 A/m)
Figure 9. Integrated geophysical interpretation of the deep seismic sounding profile HQ-13
(a) Schematic map showing the profile location; (b) Crustal velocity structure derived from tomography (thick black lines represent velocity boundaries; thin black lines represent velocity isolines; and marked values are seismic wave velocities in km/s from Bai, 2002); (c) Density contrast obtained by inversion using Mag3Dimaging in this study (white contours indicate magnetic field strengths of 0.1–2.0 A/m) The area outlined by the red dashed line indicates anomalies in seismic wave velocity, density, and magnetizaiton.
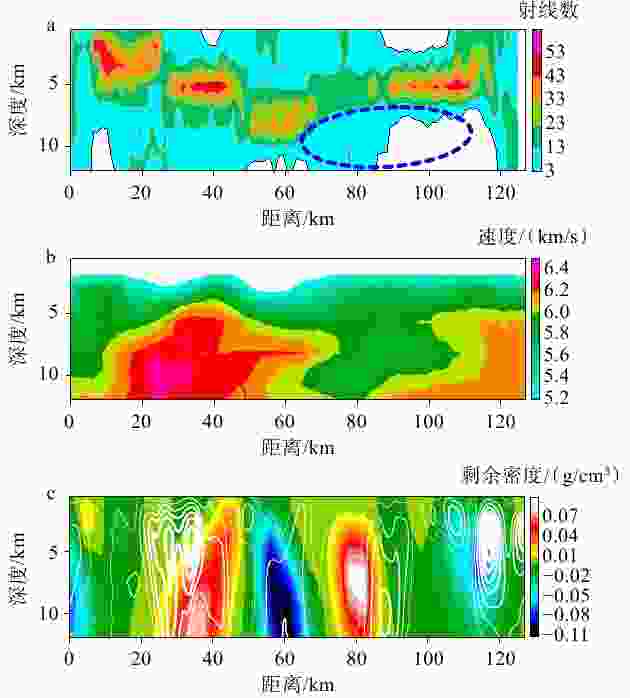
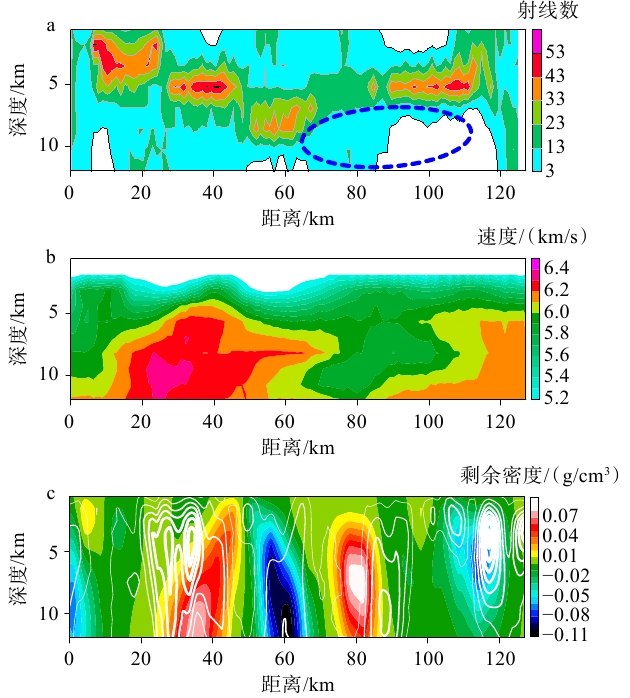
图 10 地震测深大剖面HQ-13上地壳综合地球物理异常图
a—地震反演的射线数分布图(蓝色虚线表示反演得到的低波速异常区;白志明,2002);b—地震走时反演得到的上地壳速度结构(白志明,2002);c—此次反演得到的密度异常和磁化强度异常(白色等值线表示磁化强度为0.1~2.0 A/m)
Figure 10. Integrated geophysical anomalies in the upper crust along the deep seismic sounding profile HQ-13
(a) Ray path distribution from seismic inversion (blue dashed lines are the inverted low-velocity anomaly zones from Bai, 2002); (b) Upper crustal velocity structure derived from seismic travel-time inversion (values indicate seismic wave velocities in km/s; red and blue dashed lines are high- and low-velocity anomalies, respectively, from Bai, 2002); (c) Density and magnetization anomalies derived from this inversion (white contours indicate magnetic field strengths of 0.1–2.0 A/m)
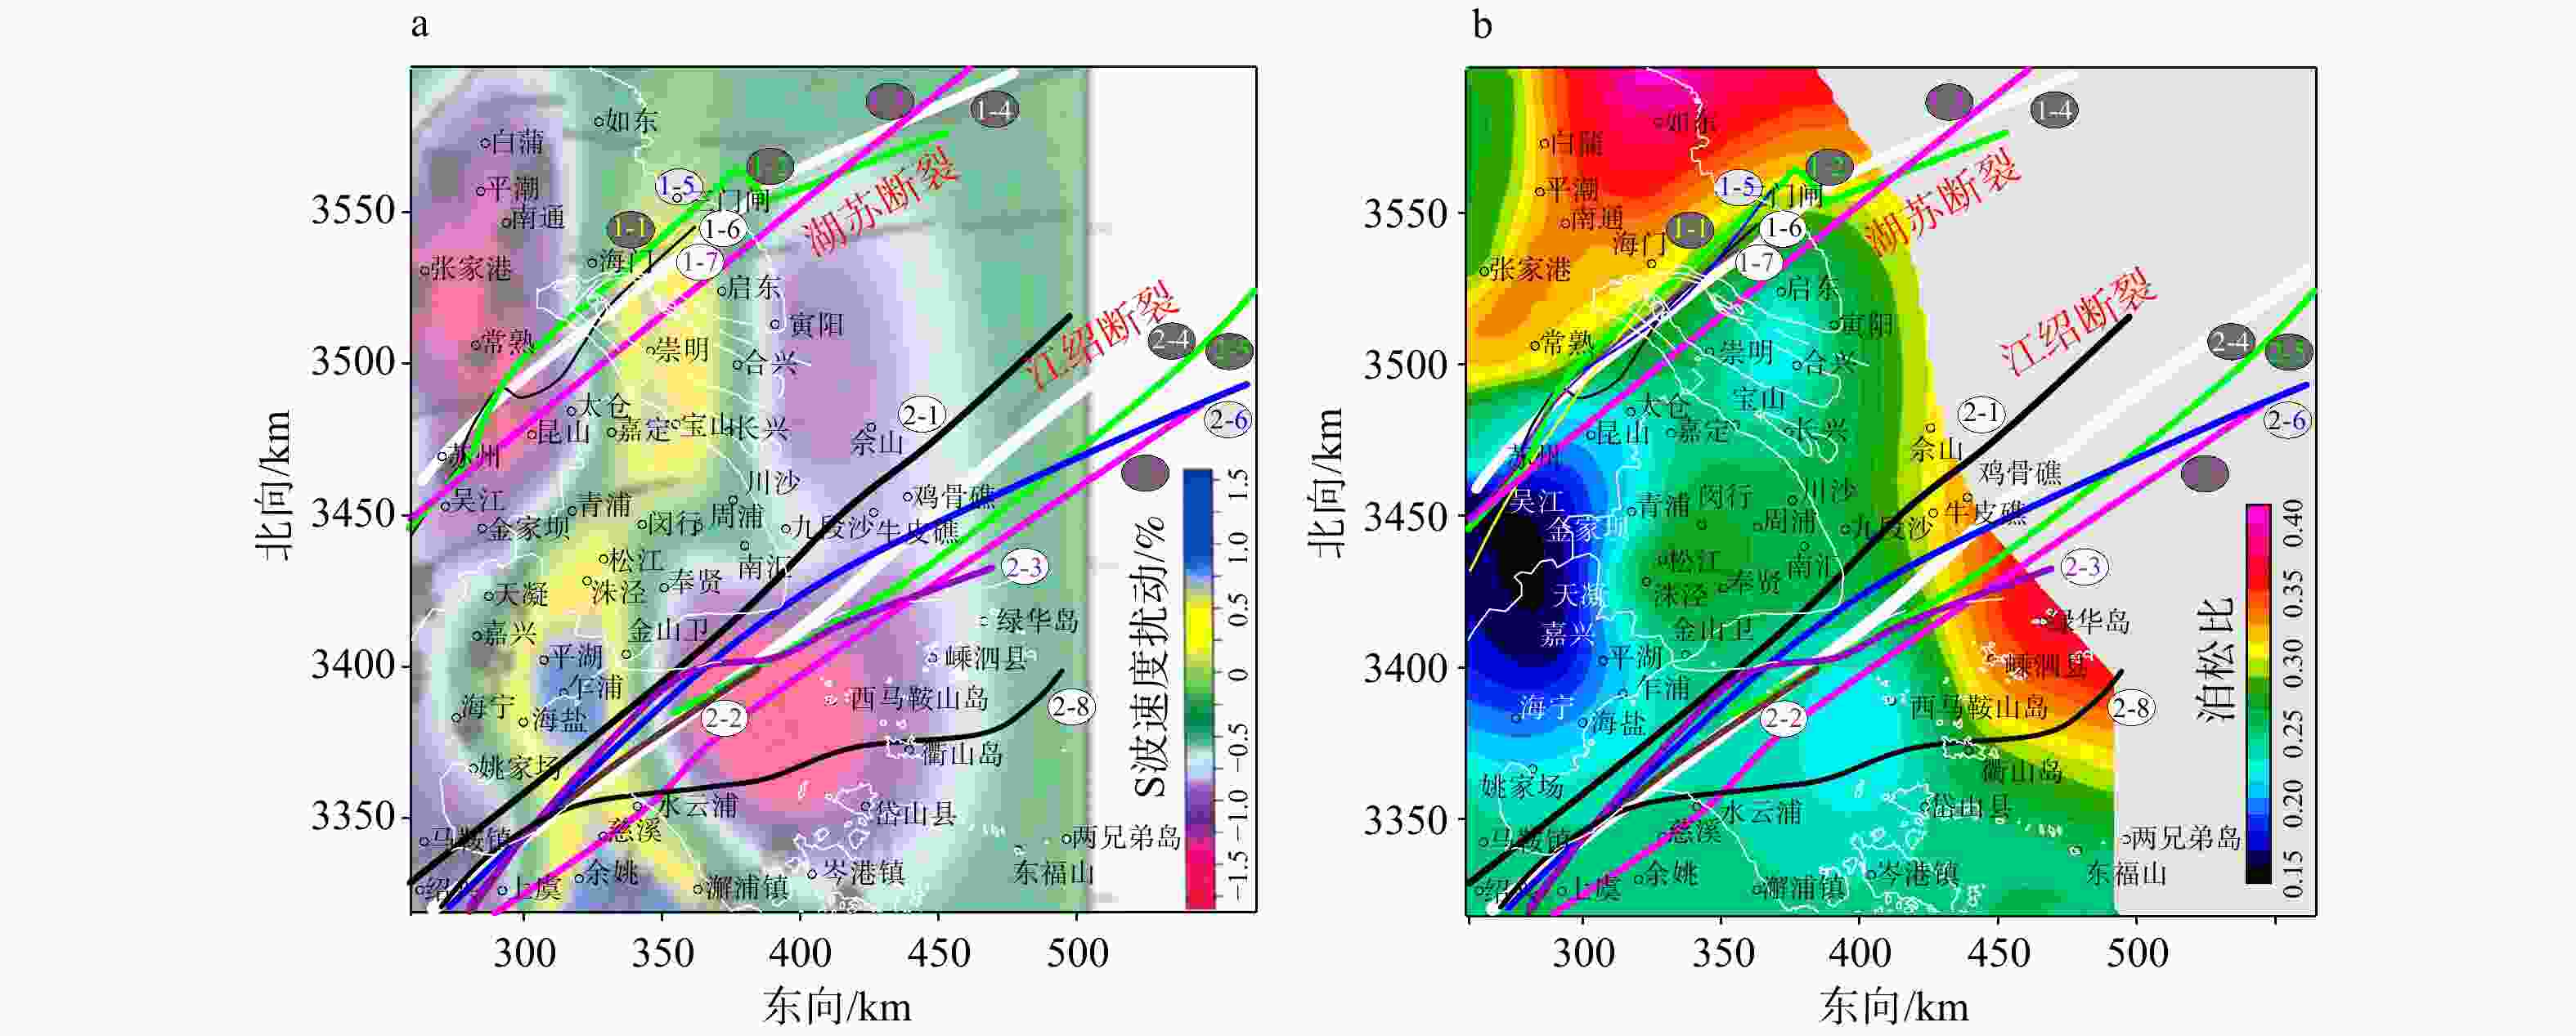
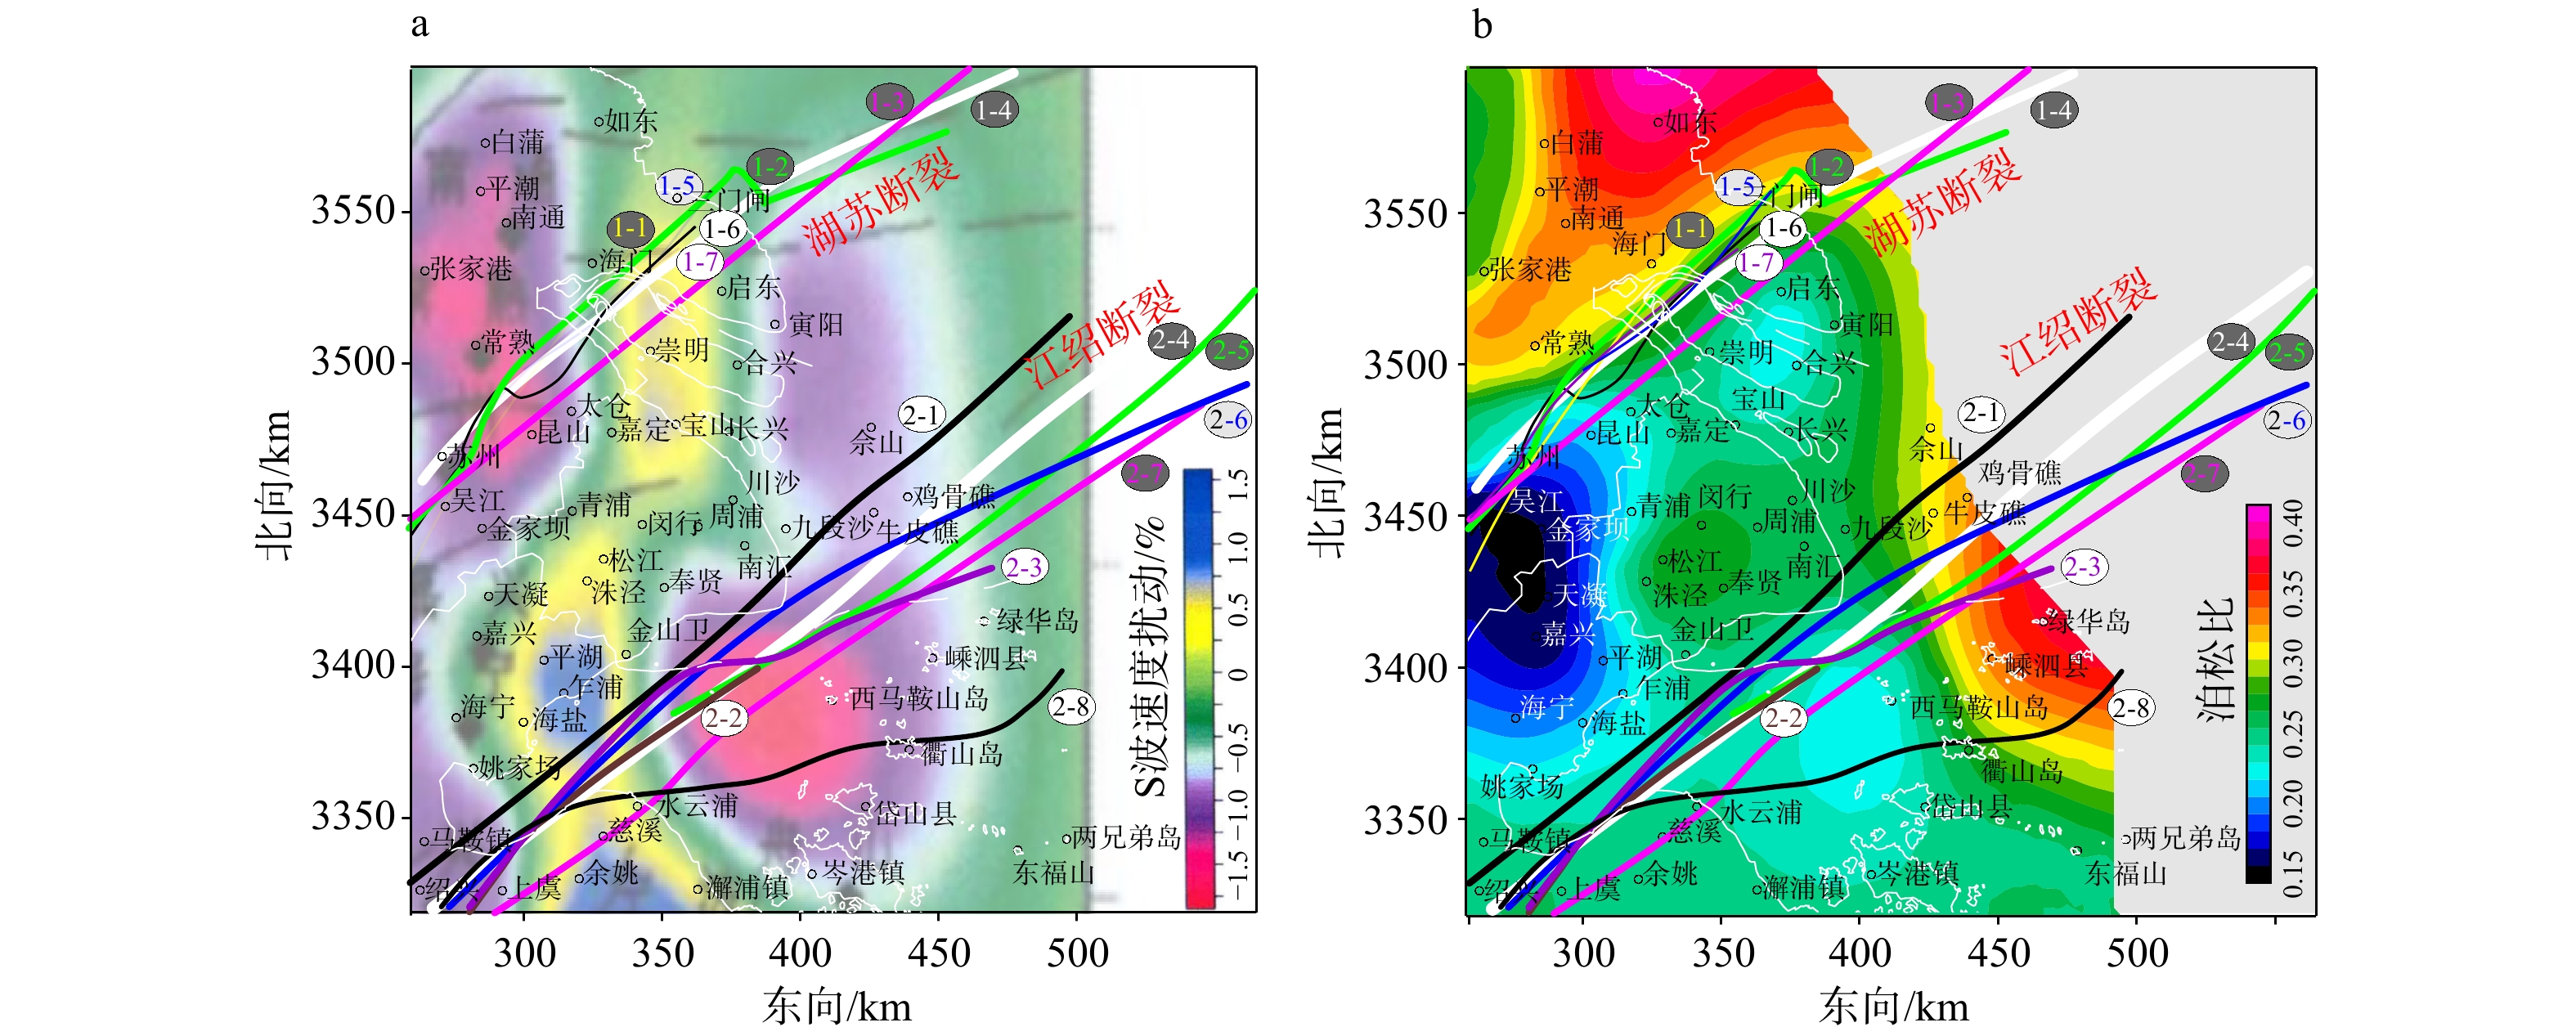
图 11 上海及其相邻地区S波层析成像与地壳平均泊松比结果
图中不同颜色的线条表示推测的2条断裂位置,编号及参考文献见图4a—2 km深度S波层析成像(据王小平,2007修改);b—地壳平均泊松比(据顾勤平等,2022修改)
Figure 11. S-wave tomography and average crustal Poisson’s ratio in Shanghai and its adjacent areas
(a) S-wave velocity at a depth of 2 km (modified from Wang, 2007); (b) Average crustal Poisson's ratio (modified from Gu et al., 2022)The colored lines indicate the inferred locations of two faults (see Fig. 4 for details).
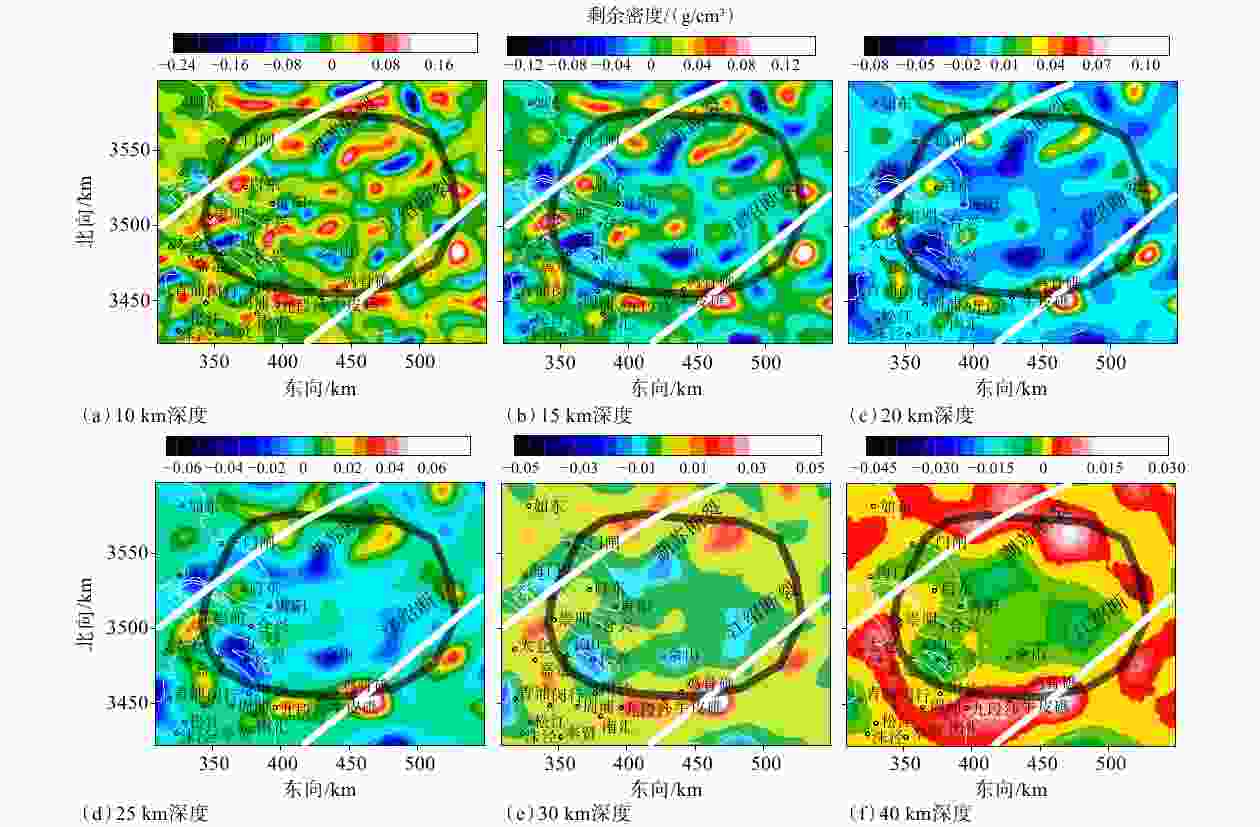
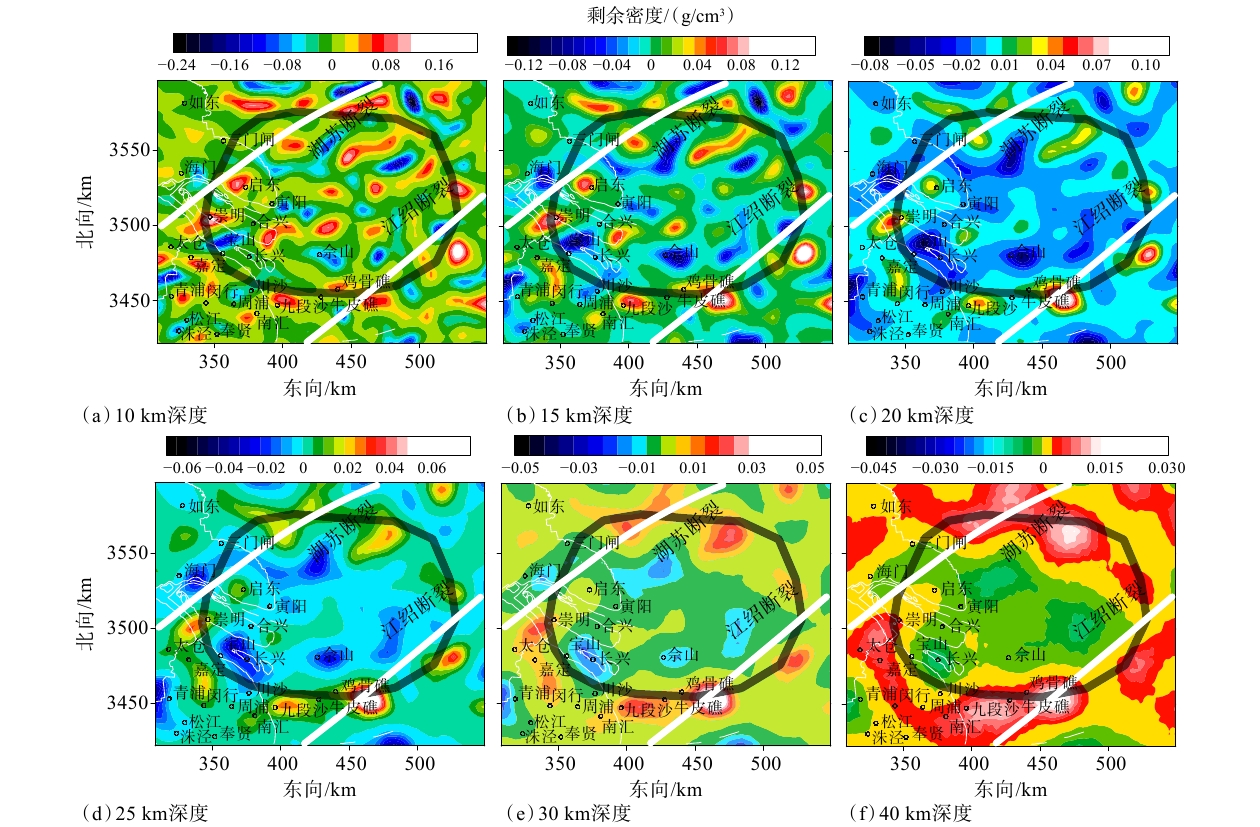
图 12 长江口地壳环形构造区不同深度密度异常分布
图中黑色圆圈表示此次推测的长江口环形构造;白色线条表示此次推测的湖苏断裂和江绍断裂
Figure 12. Density anomalies at different depths in the crustal ring structure beneath the Yangtze River Estuary
(a) Depth of 10 km; (b) Depth of 15 km; (c) Depth of 20 km;(d) Depth of 25 km; (e) Depth of 30 km; (f) Depth of 40 km The black circles indicate the circular structure beneath the Yangtze River Estuary inferred in this study, and the white lines indicate the inferred Hu–Su Fault and Jiang–Shao Fault.
-
[1] BAI Z M, 2002. Deep seismic sounding tomography: research and applications[D]. Beijing: Institute of Geophysics, China Seismological Bureau. (in Chinese with English abstract) [2] CHEN T, SONG F M, YU G Q, et al., 2023. Quaternary activity along the Guangde-Hangzhou section of the Xiaofeng-Sanmenwan fault[J]. Earthquake Research in China, 39(2): 346-355. (in Chinese with English abstract) [3] DAI M X, XU R R, ZHAO F Y, et al., 2025. Analysis of crustal structure and strong earth-quake activity of the Iranian plateau based on gravity inversion in spherical coordinate system[J]. Seismology and Geology, 47(5): 1326-1342. (in Chinese with English abstract) [4] FENG C, SONG X Q, WANG R T, et al., 2024. S-wave velocity structure in Shanghai and adjacent areas based on ambient noise tomography[J]. Seismology and Geology, 46(6): 1374-1390. (in Chinese with English abstract) [5] GENG M X, YANG Q J, KASMI C, et al., 2024. Unveiling magmatic structures and connectivity beneath the lunar Oceanus Procellarum region from GRAIL gravity data[J]. Nature Communications, 15(1): 10296. doi: 10.1038/s41467-024-54692-2 [6] GU P T, 1993. More discussions on geological structure of Shanghai area[J]. Shanghai Geology(3): 1-10, 36. (in Chinese with English abstract) [7] GU Q P, LI D H, DING Z F, et al., 2022. Crustal structure characteristics beneath the Shandong-Jiangsu-Anhui segment of the Tan-Lu fault zone and its adjacent regions using receiver functions[J]. Chinese Journal of Geophysics, 65(9): 3280-3296. (in Chinese with English abstract) [8] GUAN Z N, 2005. Geomagnetic field and magnetic exploration[M]. Beijing: Geological Publishing House. (in Chinese) [9] HUANG Z Q, WU Z C, FANG Y X, et al., 2025. Crustal structure of Philippine Sea Plate: insights from gravity inversions constrained by deep seismic[J]. Earth Science, 50(1): 234-245. (in Chinese with English abstract) [10] HUO E J, LIU C S, ZHANG Z Q, et al. , 2004. Study on buried faults and their activity in Shanghai[M]. Beijing: Earthquake Press. (in Chinese) [11] LI Q T, MAO Z Y, 1986. Investigation for stretch of Jiangshan-Shaoxing fault zone in Hangzhou Bay[J]. Scientia Geologica Sinica(3): 211-216. (in Chinese with English abstract) [12] LI W K, YANG M, FENG W, et al., 2025. Implication of crustal density structure beneath the Wudalianchi Volcanic Field from 3D imaging of dense gravimetric data[J]. Chinese Journal of Geophysics, 68(12): 4702-4713. (in Chinese with English abstract) [13] LI Y, TAN P C, LIU S W, 2026. Thick crust at Earth's slowest spreading ridge: 3D gravity insights from Eurasian Basin, Arctic Ocean[J]. Geophysical Research Letters, 53(4): e2025GL119292. doi: 10.1029/2025GL119292 [14] LIU D M, GUO L H, HAN M, 2026. Crustal three-dimensional architecture of the Yarlung Zangbo magmatic belt: insights from magnetic inversion[J]. Science China Earth Sciences, 69(4): 1539-1552. doi: 10.1007/s11430-025-1834-0 [15] LIU J D, LI Q H, ZHANG Y S, et al., 2009. Hypocenter relocation in central and southern Jiangsu Province and adjacent areas, China and its application to fault research[J]. Progress in Geophysics, 24(1): 58-66. (in Chinese with English abstract) [16] SHANG L N, PAN J, CAO R, et al., 2024. Structural characteristics of the Binhai Fault Zone in Jiangsu offshore—implications from gravity and magnetic data[J]. East China Geology, 45(1): 101-114. (in Chinese with English abstract) [17] SHE Y W, FU G Y, LIU T, et al., 2026. Gravity anomalies and crustal density structure beneath the Xiong′an region by merging ground observation and satellite model[J]. Chinese Journal of Geophysics, 69(9): 3871-3881. (in Chinese with English abstract) [18] WANG F X, 2016. The research of geothermal resources assessment and development on the sedimentary basin in Zhejiang Province[D]. Nanjing: Nanjing University. (in Chinese with English abstract) [19] WANG S T, LI B, 2009. Quaternary faults and neotectonic movement in the Yangtze River estuary[J]. Marine Geology & Quaternary Geology, 29(1): 53-58. (in Chinese with English abstract) [20] WANG X P, 2007. The study of 3D velocity structure and anisotropy under Shanghai and its neighboring area[D]. Shanghai: Tongji University. (in Chinese with English abstract) [21] XIE J L, 2018. Seismic activity characteristics and seismotectonic province division of Shanghai and nearby regions[J]. Shanghai Land & Resources, 39(4): 1-6. (in Chinese with English abstract) [22] YANG W C, HE L J, JIANG J S, et al., 2022. A synthetic study of the crust structures of Zhejiang Province[J]. Acta Geologica Sinica, 96(1): 95-103. (in Chinese with English abstract) [23] YAO B H, ZHANG Z Q, WANG J L, et al., 2007. Prospecting and research on fine crustal structure by using multi-geophysics survey methods in Shanghai region[J]. Chinese Journal of Geophysics, 50(2): 482-491. (in Chinese with English abstract) doi: 10.1002/cjg2.1052 [24] YU H Y, WEN Y L, GAO L N, et al., 2021. Crustal structure of Yangtze River Delta using tomoDD and its implication for seismicity[J]. Progress in Geophysics, 36(1): 105-111. (in Chinese with English abstract) [25] YU P, WU J S, WANG J L, et al., 2008. Using long period magnetotelluric profile of Fengcheng of Shanghai—Huzhou of Zhejiang Province to study deep electrical structure[J]. Chinese Journal of Geophysics, 51(2): 503-510. (in Chinese with English abstract) doi: 10.1002/cjg2.1224 [26] ZHANG H L, RAVAT D, MARANGONI Y R, et al., 2014. NAV-Edge: edge detection of potential-field sources using normalized anisotropy variance[J]. Geophysics, 79(3): J43-J53. doi: 10.1190/geo2013-0218.1 [27] ZHANG H L, RAVAT D, LOWRY A R, 2020. Crustal composition and Moho variations of the central and eastern United States: improving resolution and geologic interpretation of EarthScope USArray seismic images using gravity[J]. Journal of Geophysical Research: Solid Earth, 125(3): e2019JB018537. doi: 10.1029/2019JB018537 [28] ZHANG S W, ZHANG S X, TANG R Y, et al., 1988. Interpretation of the Fuliji-Fengxian DSS profile in Xiayangzi region[J]. Acta Geophysica Sinica, 31(6): 637-648. (in Chinese with English abstract) [29] ZHANG Y B, FAN X P, FU W, et al., 2025. Joint detection of upper breakpoint location of Kunshan—Jiading Fault using active-passive source method[J]. Journal of Disaster Prevention and Mitigation Engineering, 45(5): 1301-1310. (in Chinese with English abstract) [30] ZHAO B R, LI H P, ZHANG H L, 2025. The influence of model space subdivision on three-dimensional magnetic anomaly inversion[J]. Pure and Applied Geophysics, 182(4): 1513-1524. doi: 10.1007/s00024-025-03683-5 [31] ZHAO C J, ZHANG L L, HUANG Z W, et al., 2026a. Revealing deep-rooted pre-Paleozoic fault systems in the lower Yangtze region: insights from 3D magnetic inversion and gravity inversion and integrated geophysical interpretation[J]. Tectonophysics, 918: 231001. doi: 10.1016/j.tecto.2025.231001 [32] ZHAO F Y, ZHAN C R, PEI J L, et al., 2026b. Spherical gravity inversion reveals crustal structure and microplate tectonics in the Caribbean Sea[J]. Journal of Marine Science and Engineering, 14(1): 109. doi: 10.3390/jmse14010109 [33] ZHU X S, WANG L L, ZHOU X W, 2022. Structural features of the Jiangshao Fault Zone inferred from aeromagnetic data for South China and the East China Sea[J]. Tectonophysics, 826: 229252. doi: 10.1016/j.tecto.2022.229252 [34] ZHU Z Z, XU G S, 1990. Preliminary approach to the relationship between the characteristics of gravity, magnetic fields and fault structure in Shanghai area[J]. Shanghai Geology(2): 42-50. (in Chinese with English abstract) [35] 白志明, 2002. 深地震测深剖面的层析成像研究及其应用[D]. 北京: 中国地震局地球物理研究所. [36] 陈涛, 宋方敏, 余刚群, 等, 2023. 孝丰—三门湾断裂广德—杭州段第四纪活动性研究[J]. 中国地震, 39(2): 346-355. doi: 10.3969/j.issn.1001-4683.2023.02.011 [37] 戴梦雪, 徐荣荣, 赵斐宇, 等, 2025. 基于球坐标系重力反演的伊朗高原地壳结构与强震活动分析[J]. 地震地质, 47(5): 1326-1342. doi: 10.3969/j.issn.0253-4967.2025.05.20250096 [38] 冯策, 宋秀青, 王仁涛, 等, 2024. 基于背景噪声层析成像反演上海及邻区S波速度结构[J]. 地震地质, 46(6): 1374-1390. doi: 10.3969/j.issn.0253-4967.2024.06.009 [39] 顾澎涛, 1993. 有关上海地区地质构造的几点新认识[J]. 上海国土资源(3): 1-10, 36. [40] 顾勤平, 李大虎, 丁志峰, 等, 2022. 利用接收函数研究郯庐断裂带鲁苏皖段及邻区地壳结构特征[J]. 地球物理学报, 65(9): 3280-3296. doi: 10.6038/cjg2022P0926 [41] 管志宁, 2005. 地磁场与磁力勘探[M]. 北京: 地质出版社. [42] 黄子强, 吴招才, 方银霞, 等, 2025. 菲律宾海板块地壳结构特征: 基于地震约束的重力反演[J]. 地球科学, 50(1): 234-245. doi: 10.3799/dqkx.2023.198 [43] 火恩杰, 刘昌森, 章振铨, 等, 2004. 上海市隐伏断裂及其活动性研究[M]. 北京: 地震出版社. [44] 李起彤, 毛正毅, 1986. 江山-绍兴断裂带在杭州湾延伸的探讨[J]. 地质科学(3): 211-216. [45] 李为凯, 杨萌, 冯伟, 等, 2025. 基于密集重力数据的五大连池火山区地壳密度结构三维成像研究[J]. 地球物理学报, 68(12): 4702-4713. doi: 10.6038/cjg2025S0587 [46] 刘定美, 郭良辉, 韩梅, 2026. 雅鲁藏布江岩浆岩带地壳三维架构: 来自磁力反演的启示[J]. 中国科学: 地球科学, 56(4): 1576-1589. [47] 刘建达, 李清河, 张元生, 等, 2009. 江苏中、南部及邻区地震重新定位及在断层研究中的应用[J]. 地球物理学进展, 24(1): 58-66. [48] 尚鲁宁, 潘军, 曹瑞, 等, 2024. 基于重磁数据研究江苏岸外滨海断裂带及邻区构造特征[J]. 华东地质, 45(1): 101-114. doi: 10.16788/j.hddz.32-1865/P.2024.01.008 [49] 佘雅文, 付广裕, 刘泰, 等, 2026. 融合地面观测和卫星模型的雄安地区重力异常和地壳密度结构研究[J]. 地球物理学报, 69(9): 3871-3881. [50] 汪发祥, 2016. 浙江省沉积盆地型地热资源评价及开发利用研究[D]. 南京: 南京大学. [51] 王舒畋, 李斌, 2009. 长江口海域的第四纪断层与新构造活动[J]. 海洋地质与第四纪地质, 29(1): 53-58. doi: 10.3724/SP.J.1140.2009.01053 [52] 王小平, 2007. 上海及其邻近地区地下三维速度结构及各向异性的研究[D]. 上海: 同济大学. [53] 谢建磊, 2018. 上海及邻区地震活动特征及地震构造区划[J]. 上海国土资源, 39(4): 1-6. doi: 10.3969/j.issn.2095-1329.2018.04.001 [54] 杨文采, 何良军, 江金生, 等, 2022. 浙江省地壳构造综合研究[J]. 地质学报, 96(1): 95-103. doi: 10.3969/j.issn.0001-5717.2022.01.009 [55] 姚保华, 章振铨, 王家林, 等, 2007. 上海地区地壳精细结构的综合地球物理探测研究[J]. 地球物理学报, 50(2): 482-491. doi: 10.3321/j.issn:0001-5733.2007.02.020 [56] 于海英, 温燕林, 高丽娜, 等, 2021. 上海及周边地区地壳精细速度结构体波双差成像[J]. 地球物理学进展, 36(1): 105-111. doi: 10.6038/pg2021EE0122 [57] 于鹏, 吴健生, 王家林, 等, 2008. 上海奉城—浙江湖州长周期MT剖面揭示的深部电性结构[J]. 地球物理学报, 51(2): 503-510. doi: 10.3321/j.issn:0001-5733.2008.02.022 [58] 张四维, 张锁喜, 唐荣余, 等, 1988. 下扬子地区符离集—奉贤地震测深资料解释[J]. 地球物理学报, 31(6): 637-648. [59] 张颐彪, 范小平, 符伟, 等, 2025. 利用主-被动源法联合探测昆山—嘉定断裂上断点位置[J]. 防灾减灾工程学报, 45(5): 1301-1310. doi: 10.13409/j.cnki.jdpme.20231122001 [60] 朱子沾, 徐关生, 1990. 上海地区重磁场特征与断裂构造关系初探[J]. 上海地质(2): 42-50. -

 下载:

计量
- 文章访问数: 88
- HTML全文浏览量: 11
- PDF下载量: 6
- 被引次数: 0
