


Constraining coseismic off-fault deformation of the 2022 MW 6.6 Menyuan earthquake using man-made linear markers
-
摘要: 同震地表位移的准确约束对于揭示地震破裂过程、开展区域地震灾害评估以及理解地表变形分配特征具有重要意义。相较于传统基于近场标志的断层位移测量,跨破裂带长尺度人工线性标志物可在更大测量孔径下记录地表永久变形,为约束总同震位移及讨论离断层变形提供补充证据。2022年1月8日青藏高原东北缘海原断裂带上的门源MW 6.6地震形成了清晰的地表破裂,并保存了多条跨断层牧场围栏,为开展此类研究提供了有利条件。文章利用覆盖破裂全段的无人机航拍影像生成了2~6 cm高分辨率的数字正射影像和数字高程模型;结合野外调查,对门源地震同震地表破裂进行了精细填图,并选取12组跨破裂带的长线性围栏开展多孔径位移测量。结果表明,此次同震地表破裂总长约28 km,由南(托莱山断裂)、北(冷龙岭断裂)2支构成,依据其几何结构展布特征可自西向东划分为4段(S1段—S4段)。地震地表破裂主要表现为近北东向右阶雁列状张剪裂缝及斜列挤压鼓包等。破裂带宽度沿破裂传播方向变化明显,最大宽度约为160 m,除S3段较宽外,其余区段主要集中于10~30 m。基于跨断层的围栏测量获得的断层上位移为0~2.8 m,总同震位移量为1.2~4.1 m,由此得到离断层变形占比为27%~76%。最大同震位移出现在靠近震中的冷龙岭S3段,约4.1±0.8 m,该段离断层变形占比均值约为33%;从S3段向西同震位移量逐渐减小,而离断层变形量的占比则整体增大,至托莱山分支破裂S1段,总同震位移均值为1.7±0.5 m,离断层变形占比均值达到55%。此次研究获取的同震位移总变形量较以往近场测量结果偏大,这是由于此次测量孔径涵盖了整体变形范围,因此能捕捉到较为完整的同震位移,由此凸显了纳入离断层变形对完整评估总同震位移与地震灾害风险的重要性。Abstract:
Objective Accurate constraints on coseismic surface displacement are essential for revealing earthquake rupture processes, assessing regional seismic hazards, and understanding the partitioning of near-surface deformation. Conventional near-field displacement measurements generally capture only localized deformation along visible rupture zones, potentially underestimating total coseismic displacement by not considering off-fault deformation. Long linear anthropogenic markers crossing rupture zones, such as pasture fences, provide a larger measurement aperture and enable us to quantify total coseismic displacement and evaluate the contribution of off-fault deformation. The 8 January 2022 MW 6.6 Menyuan earthquake along the Haiyuan fault zone displaced multiple pasture fences across the well-preserved surface ruptures, providing an ideal opportunity to investigate total displacement and off-fault deformation. Methods In this study, we utilized unmanned aerial vehicle (UAV) photogrammetry to acquire high-resolution aerial images along the entire surface rupture zone of the 2022 Menyuan earthquake and to generate digital orthophoto maps (DOMs) and digital elevation models (DEMs) with spatial resolutions of 2–6 cm. Combined with detailed field investigations, we mapped the coseismic surface rupture at a fine scale and selected 12 groups of long, linear pasture fences crossing the rupture zone to conduct multi-aperture displacement measurements. Results The coseismic surface rupture extends for approximately 28 km and consists of two main branches: the southern branch along the Tuolaishan fault and the northern branch along the Lenglongling fault. The rupture zone was divided into four segments from west to east, namely S1 to S4, based on the geometric distribution and structural characteristics of the rupture traces, mainly NE-trending, right-stepping en echelon tensional-shear cracks, oblique compressional bulges, and mole-track-like deformation. The width of the surface rupture zone varies significantly along strike, reaching a maximum of approximately 160 m in the S3 segment. Except for the relatively wide S3, most rupture sections are mainly concentrated within a narrow width range of 10–30 m, indicating strong control by local fault geometry and rupture branching. Multi-aperture measurements using 12 groups of cross-fault pasture fences reveal that visible displacement within the mapped rupture zone ranges from 0 to 2.8 m, whereas the total coseismic displacement measured across the larger aperture of the fences ranges from 1.2 to 4.1 m. The corresponding proportion of off-fault deformation reaches 27%–76%, indicating that a substantial part of the coseismic deformation was accommodated outside the visible principal rupture traces. The maximum total coseismic displacement, approximately 4.1 ± 0.8 m, occurs in the S3 segment of the Lenglongling Fault near the epicenter, where the mean proportion of off-fault deformation is relatively low at approximately 33%. From S3 to S1 along the Tuolaishan branch westward, the total coseismic displacement gradually decreases to a mean of 1.7 ± 0.5 m, while the mean proportion of off-fault deformation increases significantly to about 55%, showing that deformation became progressively less localized and more widely distributed across the surrounding near-surface materials. Conclusions Compared with previous near-field measurements, the total coseismic displacements obtained in this study are generally larger. This discrepancy is mainly attributed to the larger measurement aperture provided by the long cross-fault fences, which enabled the capture of a more complete deformation field, including both localized displacement on the visible rupture and distributed off-fault deformation. The 2022 Menyuan earthquake produced a complex surface rupture system composed of the Tuolaishan and Lenglongling fault branches, with clear along-strike variations in rupture geometry, rupture-zone width, and displacement distribution. Multi-aperture measurements using long pasture fences indicate that off-fault deformation accounted for a considerable proportion of the total coseismic displacement, especially in the western branch rupture where deformation was more distributed. The comparison with previous near-field measurements demonstrates that relying only on localized rupture offsets may underestimate the total coseismic displacement. [Significance] This study highlights the critical importance of incorporating off-fault deformation into coseismic displacement measurements to prevent underestimating seismic slip in hazard assessments. Furthermore, it demonstrates that using long, linear, anthropogenic markers via high-resolution UAV photogrammetry is an effective, innovative approach for capturing complete near-surface deformation fields along complex strike-slip fault systems. -
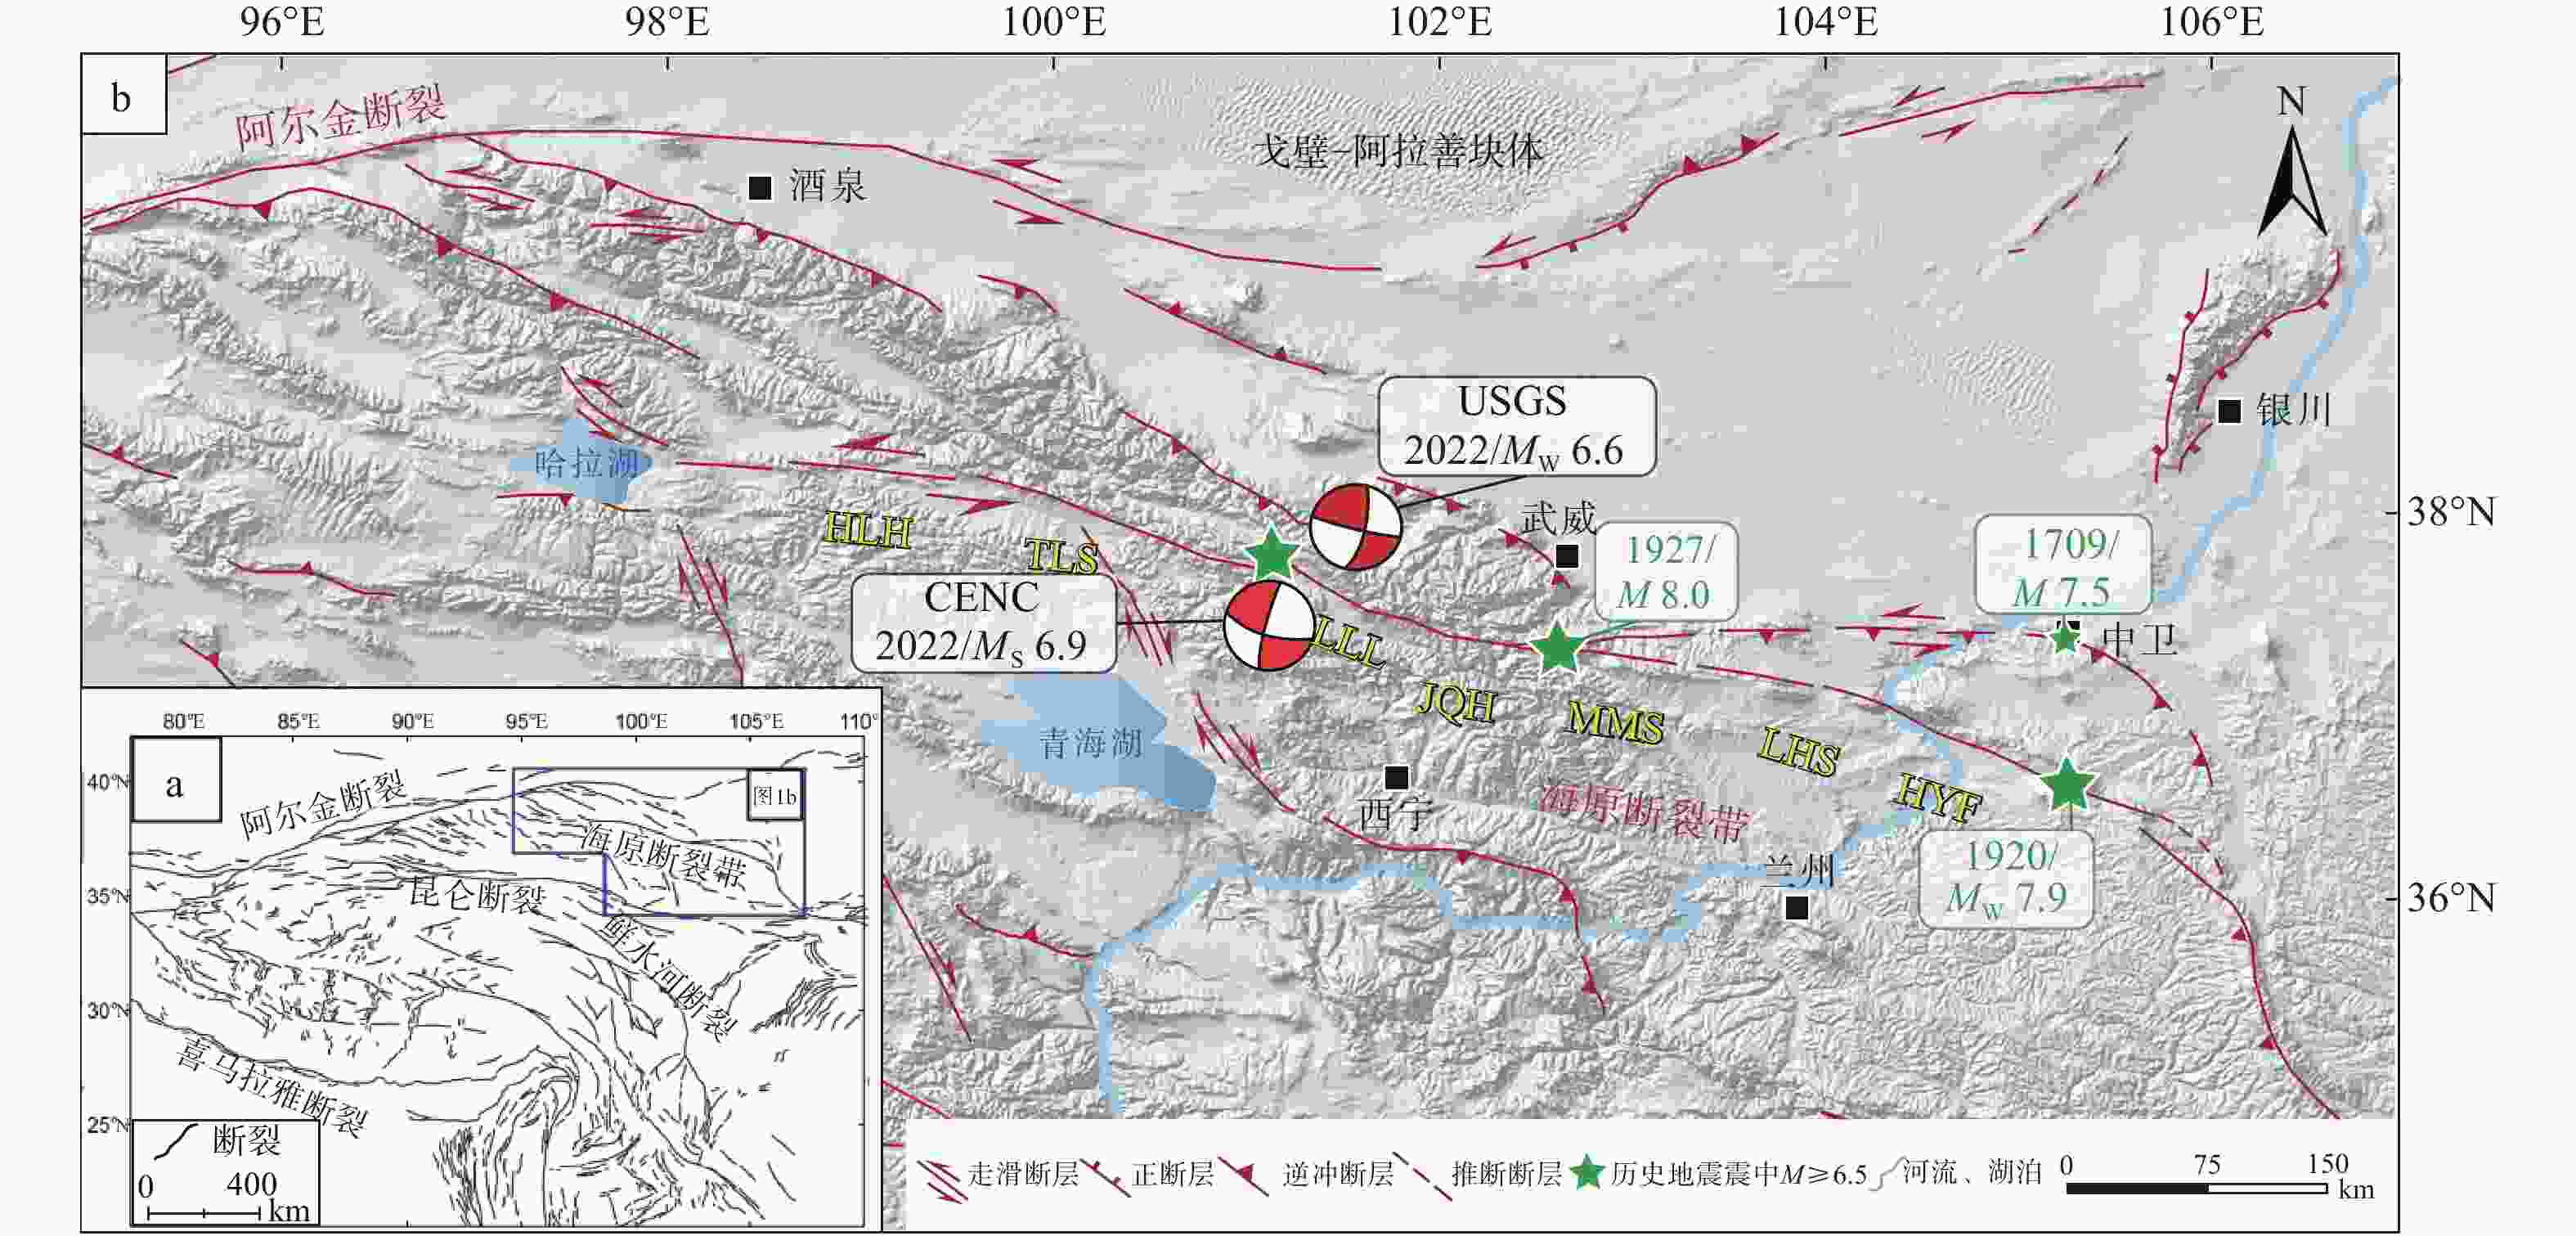
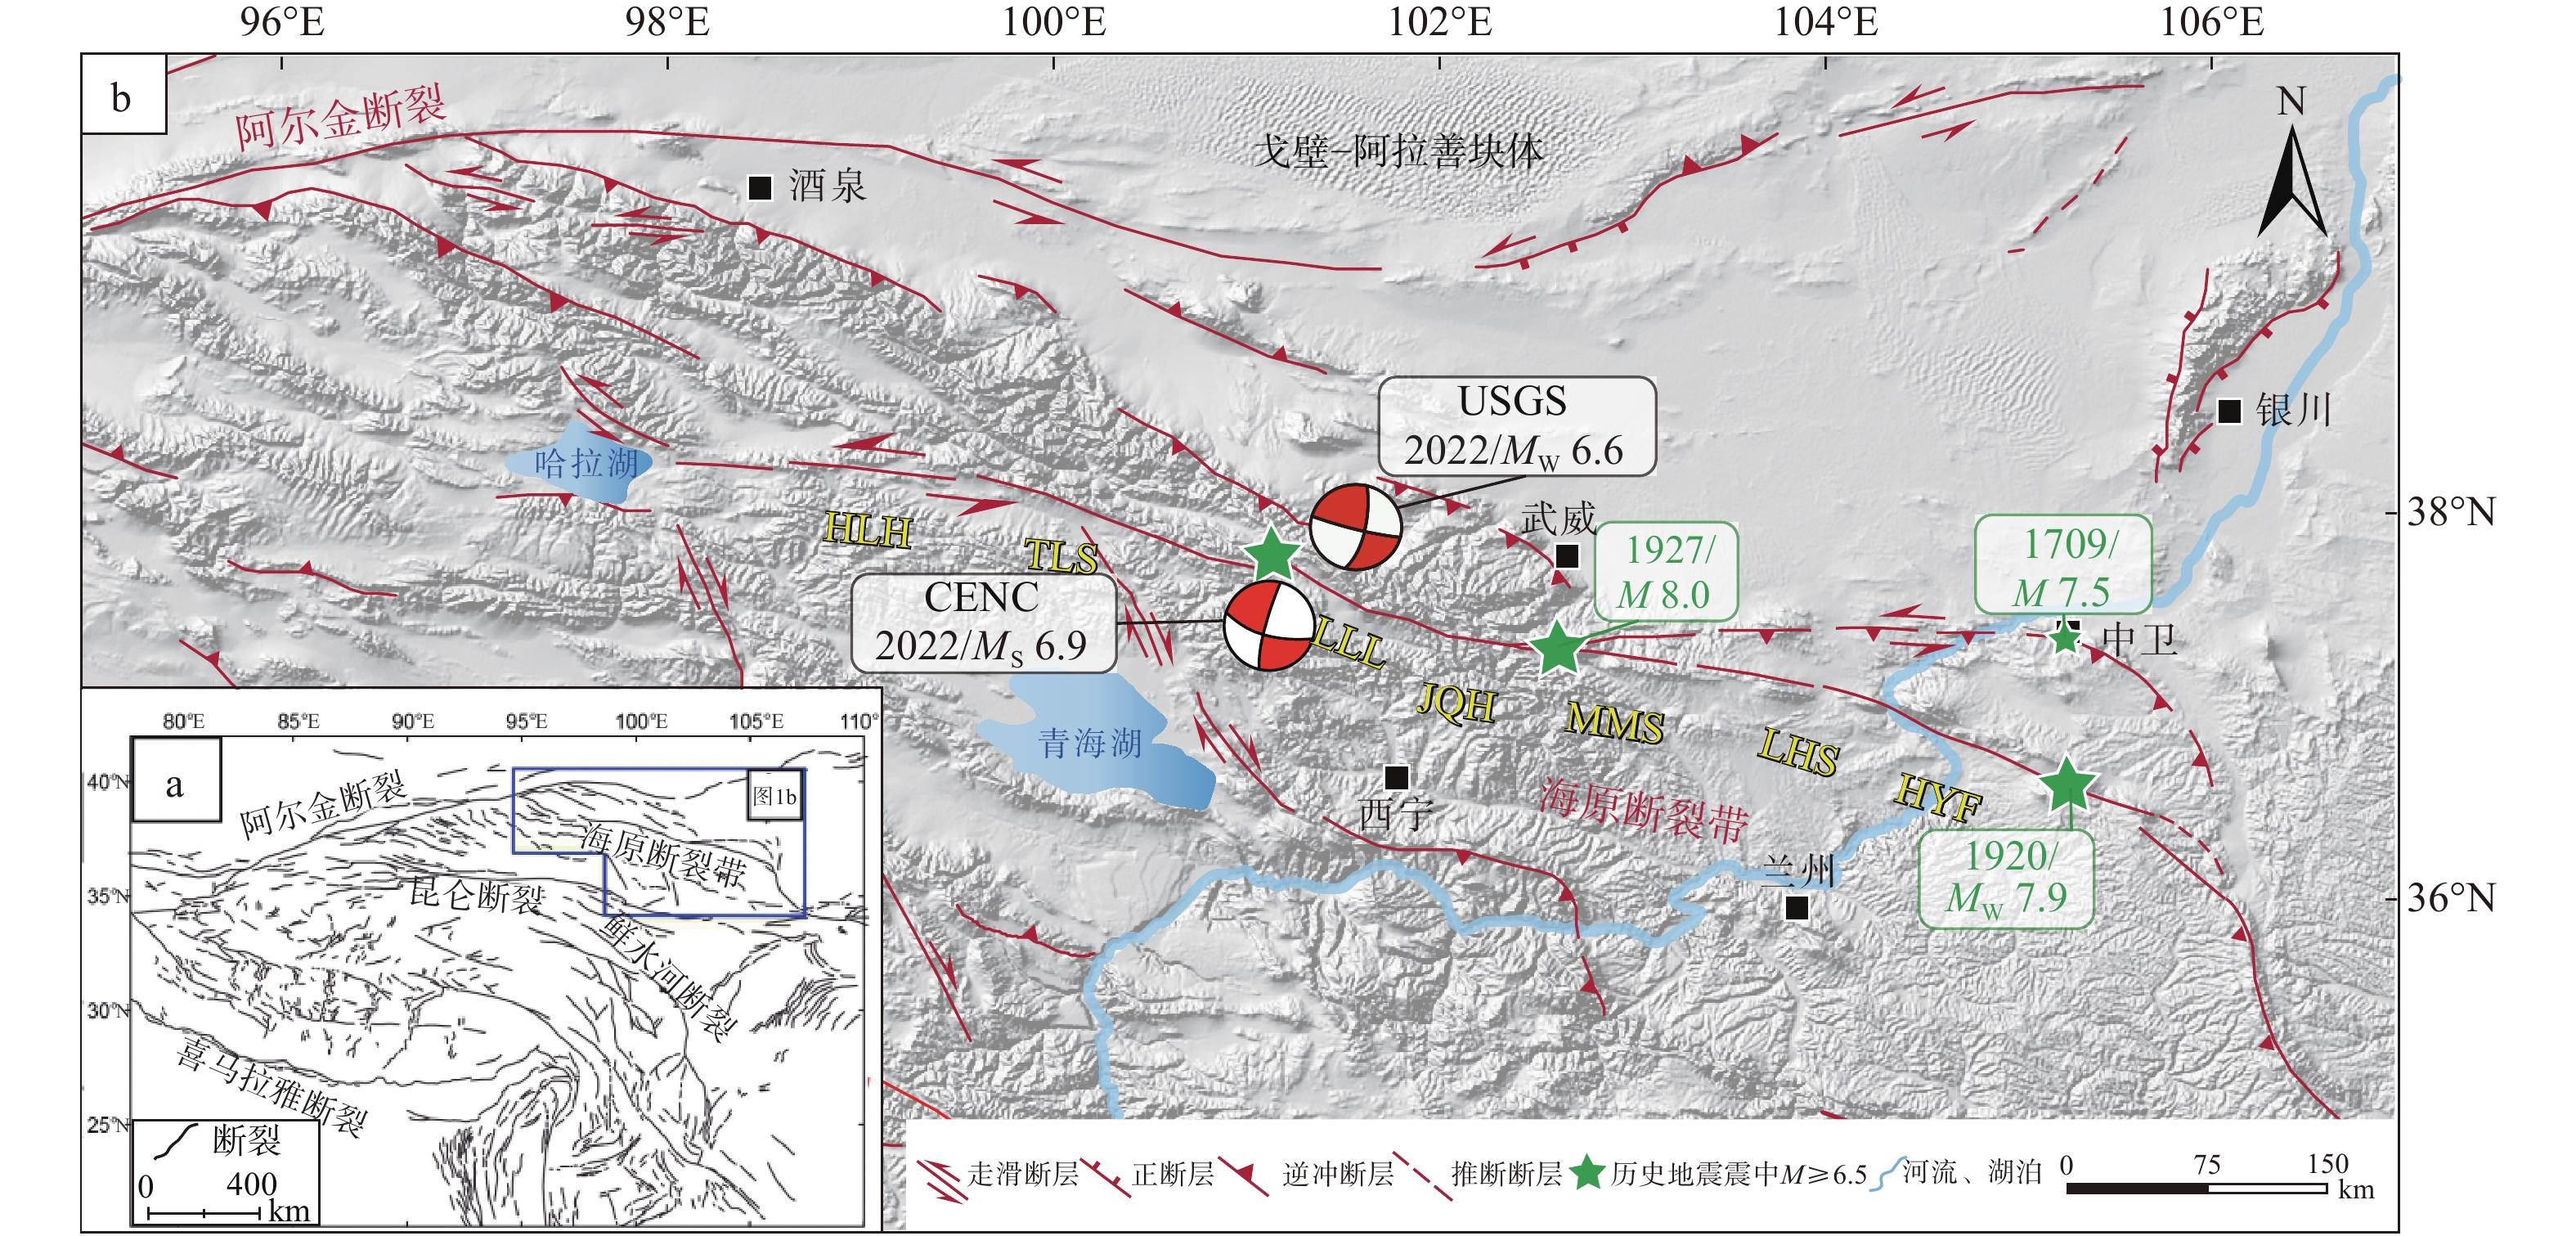
图 1 2022年门源MW 6.6地震区域地震构造背景图
2022年门源地震震中及震源机制沙滩球分别引自美国地质调查局USGS(2022)以及中国地震台网中心CENC(2022);HLH—哈拉湖断裂;TLS—托莱山断裂;LLL—冷龙岭断裂;JQH—金强河断裂;MMS—毛毛山断裂;LHS—老虎山断裂;HYF—海原断裂a—青藏高原主要活动断层分布图(据Tapponnier et al.,2001修改);b—青藏高原东北缘主要活动断层及历史强震(据Yao et al.,2022a修改)
Figure 1. Regional seismotectonic setting of the 2022 Mw 6.6 Menyuan earthquake
(a) Distribution map of major active faults on the Tibetan Plateau (modified after Tapponnier et al., 2001); (b) Major active faults and historical strong earthquakes in the northeastern Tibetan Plateau (modified after Yao et al., 2022a). The epicenter and focal mechanism of the 2022 Menyuan earthquake are from USGS (2022) and CENC (2022); HLH—Halahu Fault; TLS—Tuolaishan Fault; LLL—Lenglongling Fault; JQH—Jinqianghe Fault; MMS—Maomaoshan Fault; LHS—Laohushan Fault; HYF—Haiyuan Fault
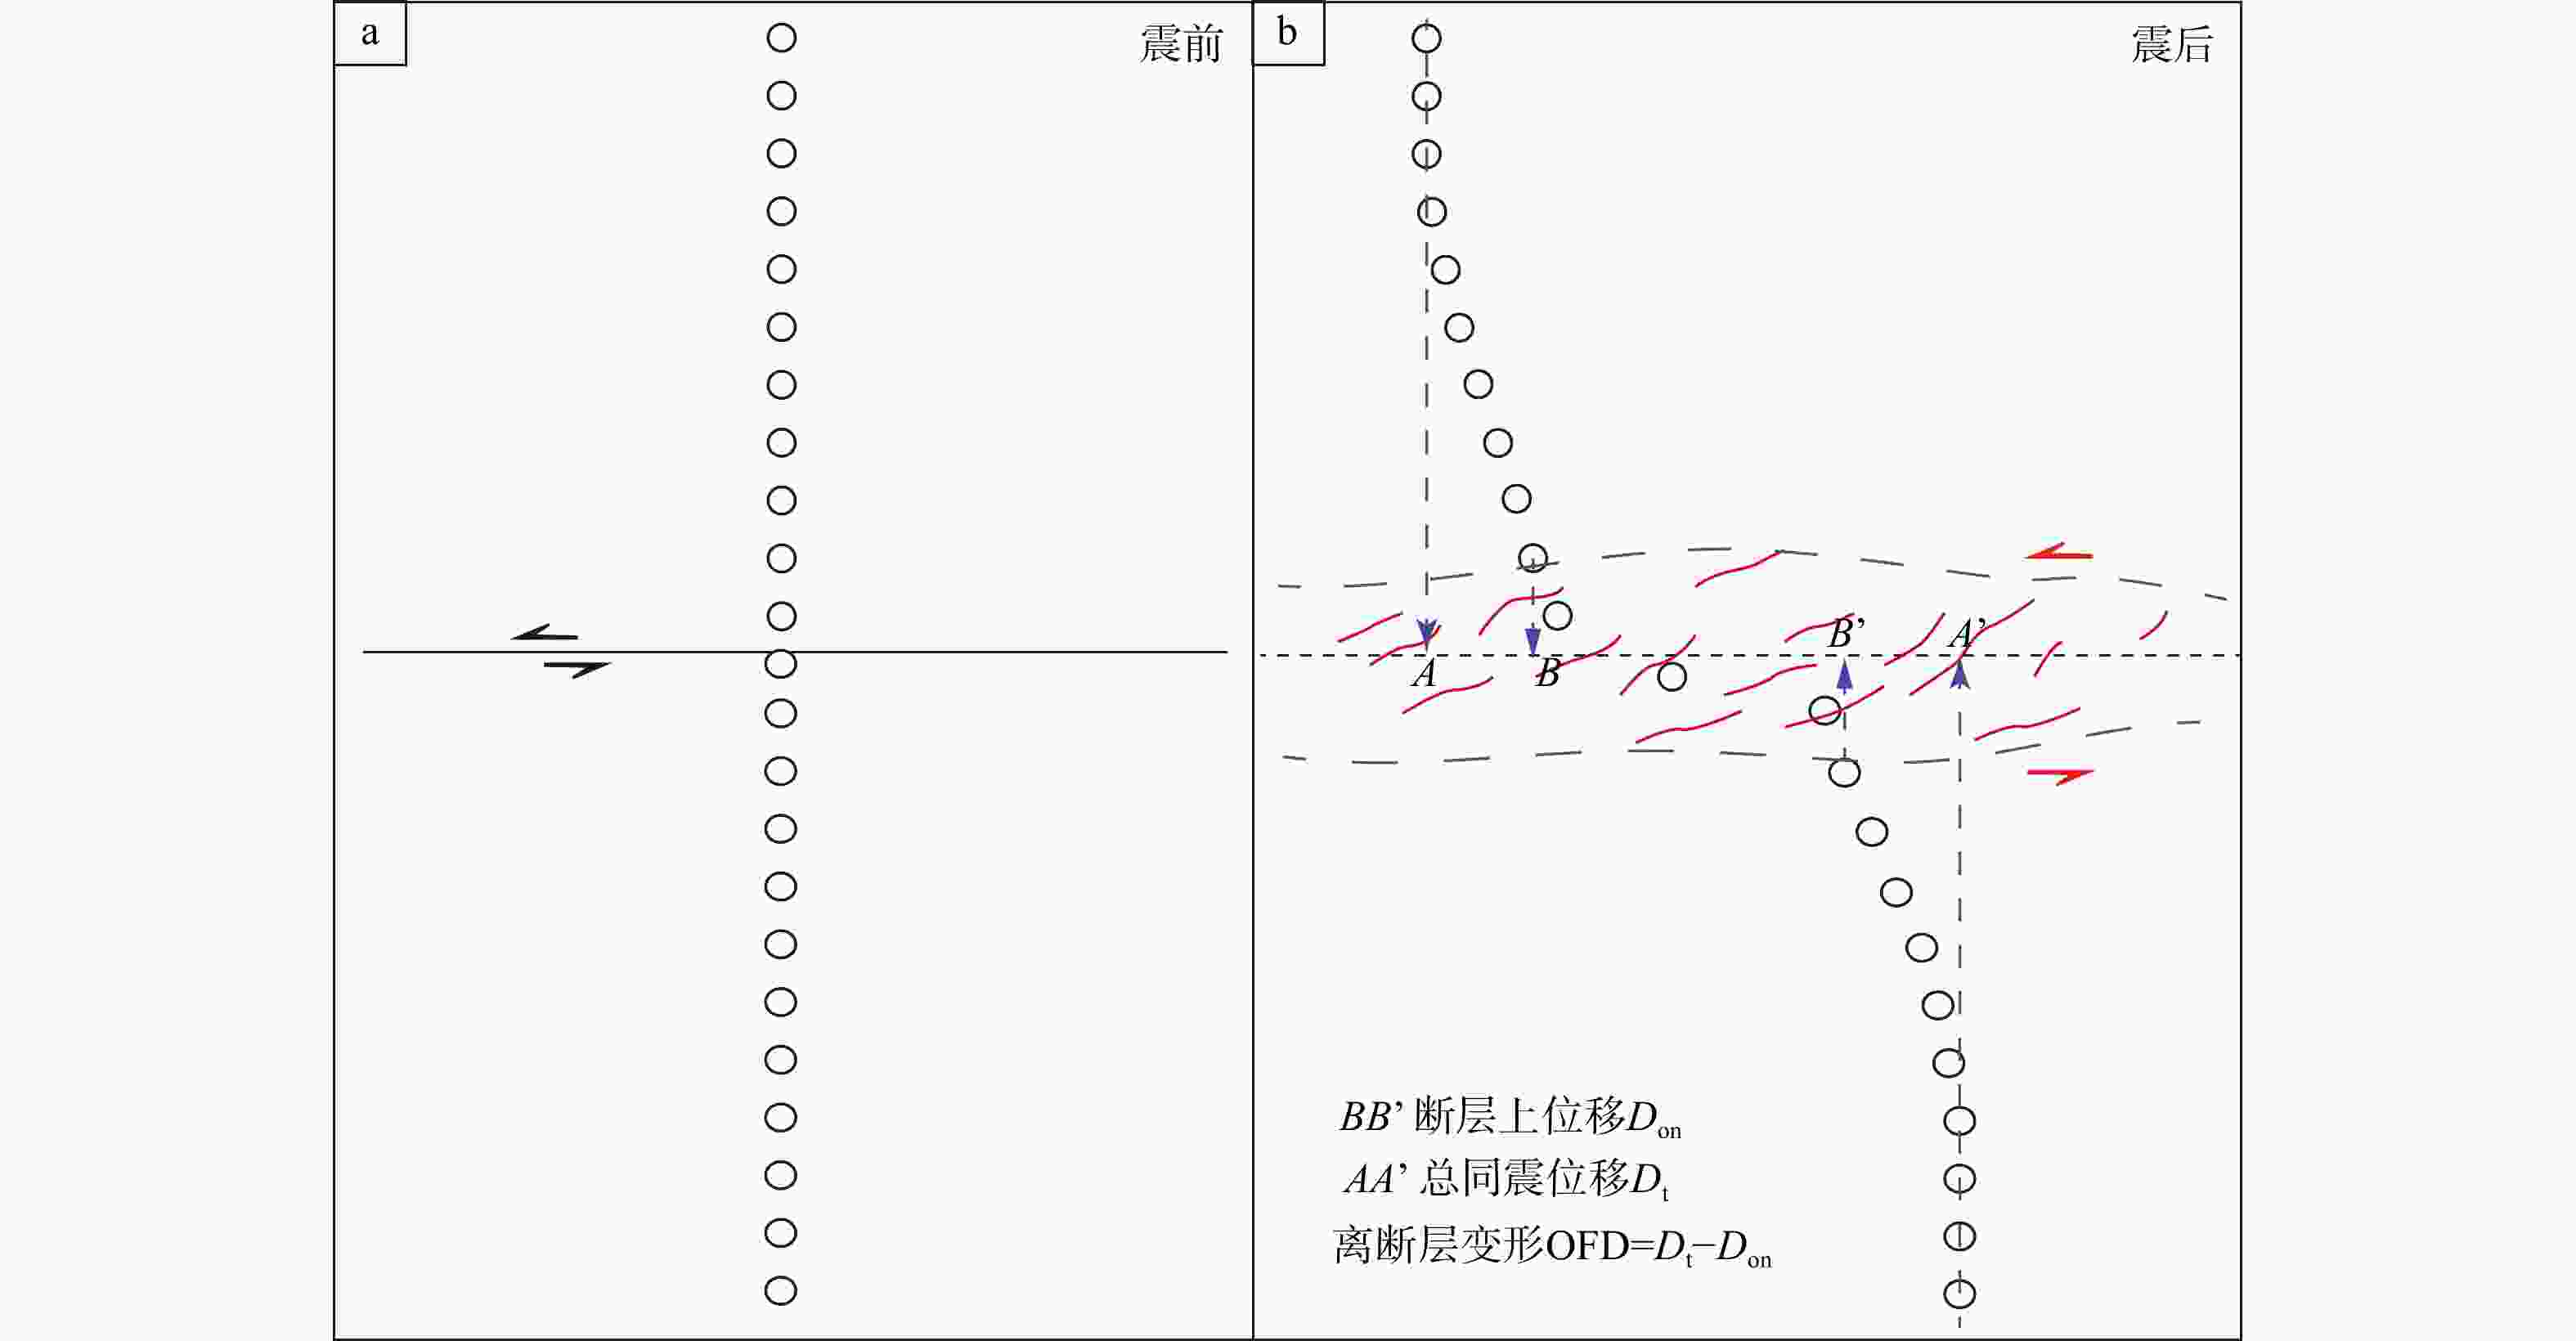
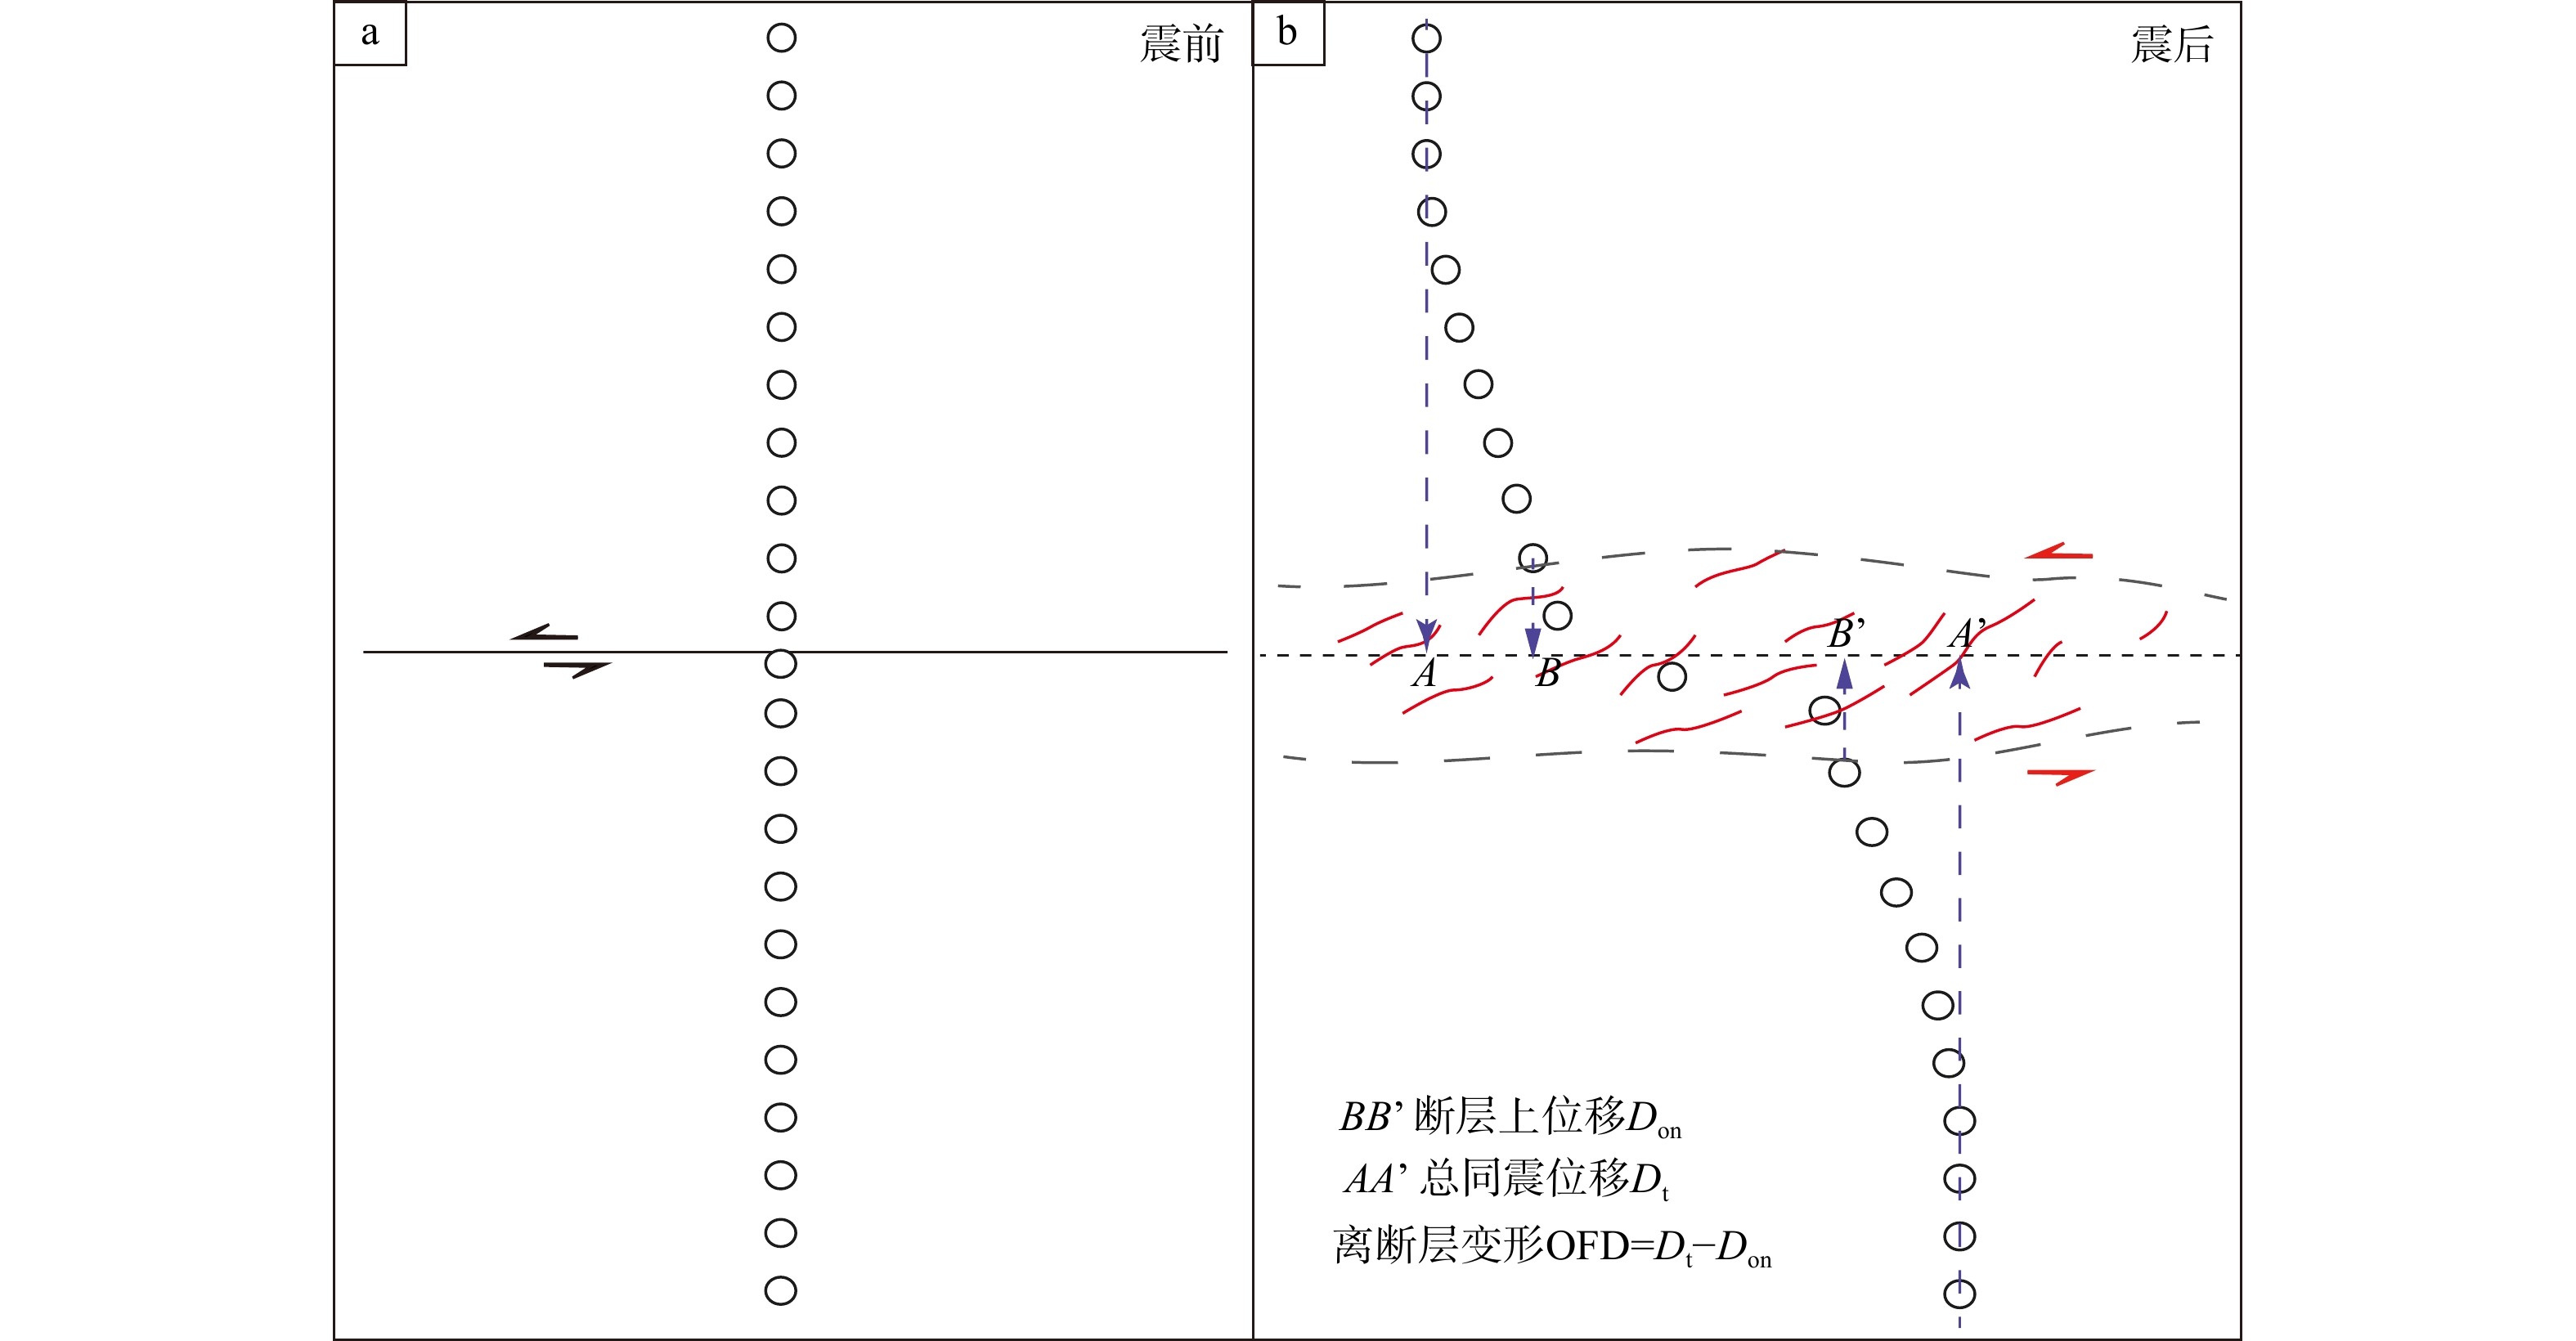
图 2 围栏迹线上各围栏基座位置点震前分布和同震位移示意图
a—震前牧场围栏各位置点的初始位置(圆圈为假定初始位置);b—震后牧场围栏迹线上各位置点的实际位置(箭头指示同震错动方向;红色线代表地表破裂;包络线表示地表破裂带宽度)
Figure 2. Schematic diagram showing the pre-seismic distribution and coseismic deformation of fence-post positions along the fence trace
(a) Assumed initial positions of fence posts at the pasture before the earthquake; (b) Actual post-seismic positions of fence posts along the fence trace, where AA' represents the total coseismic displacement Dt, BB' represents the near-field displacement Don on the visible rupture zone, red lines represent surface ruptures, and the envelope indicates the width of the surface rupture zone
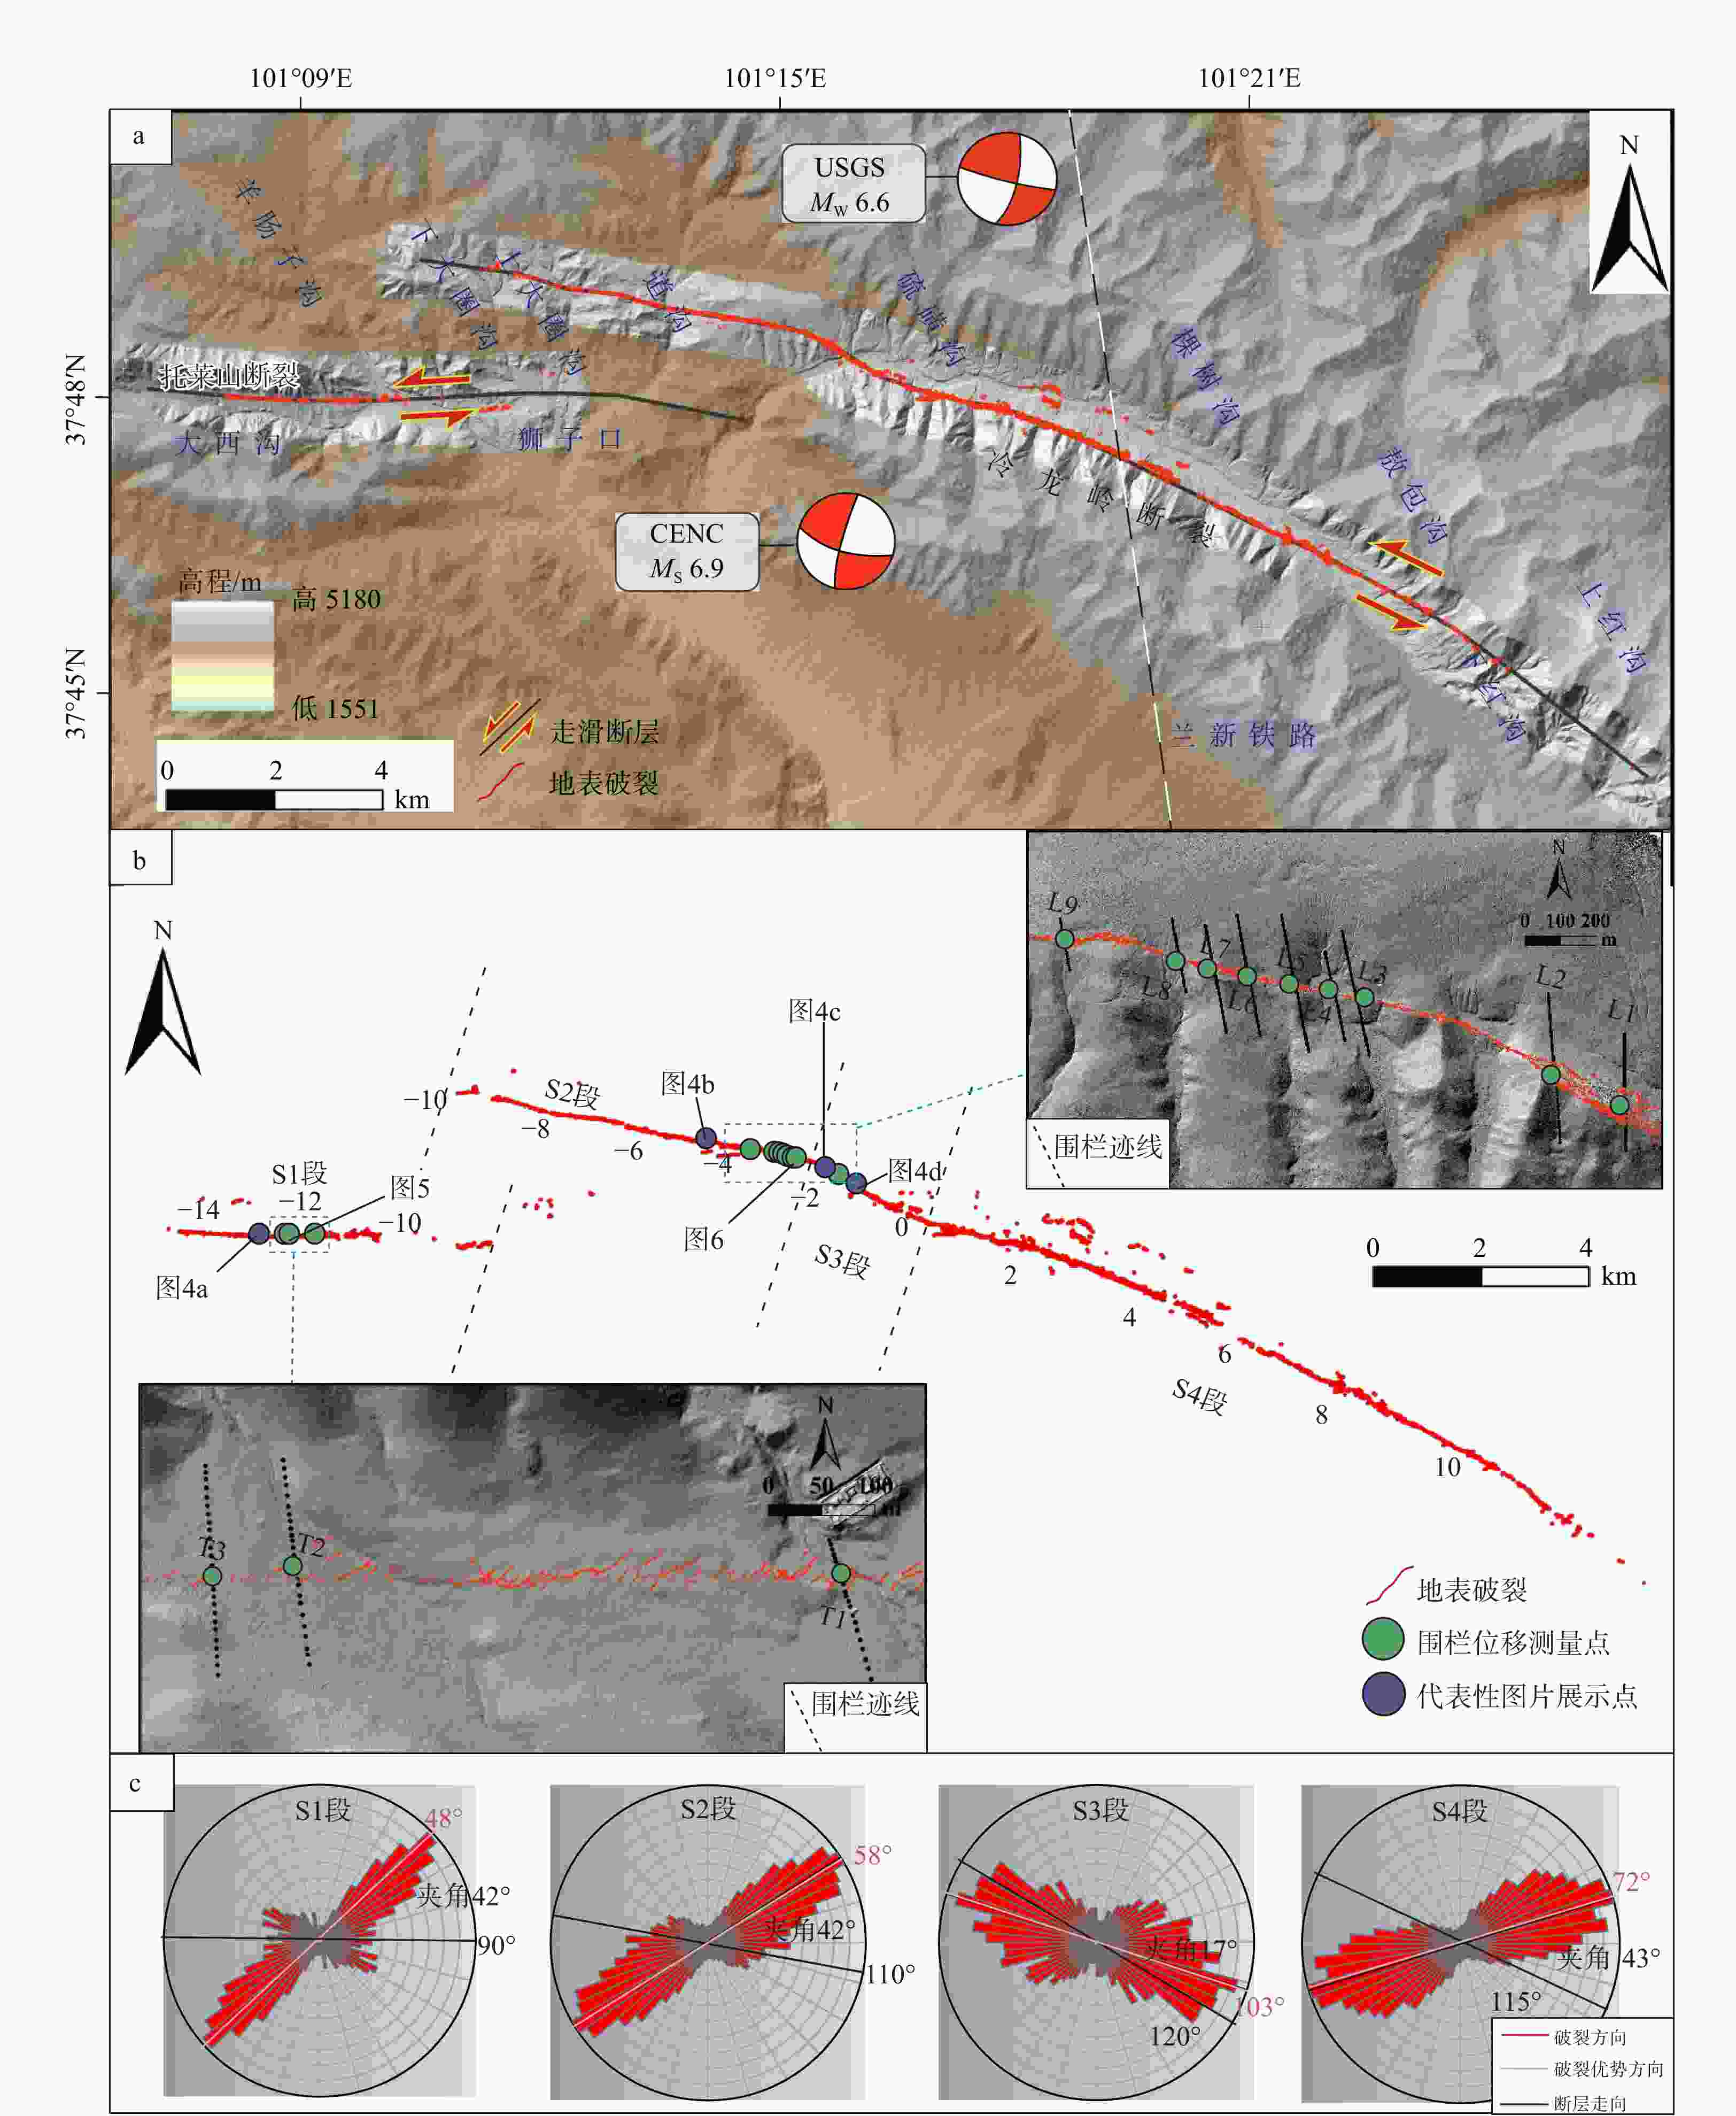
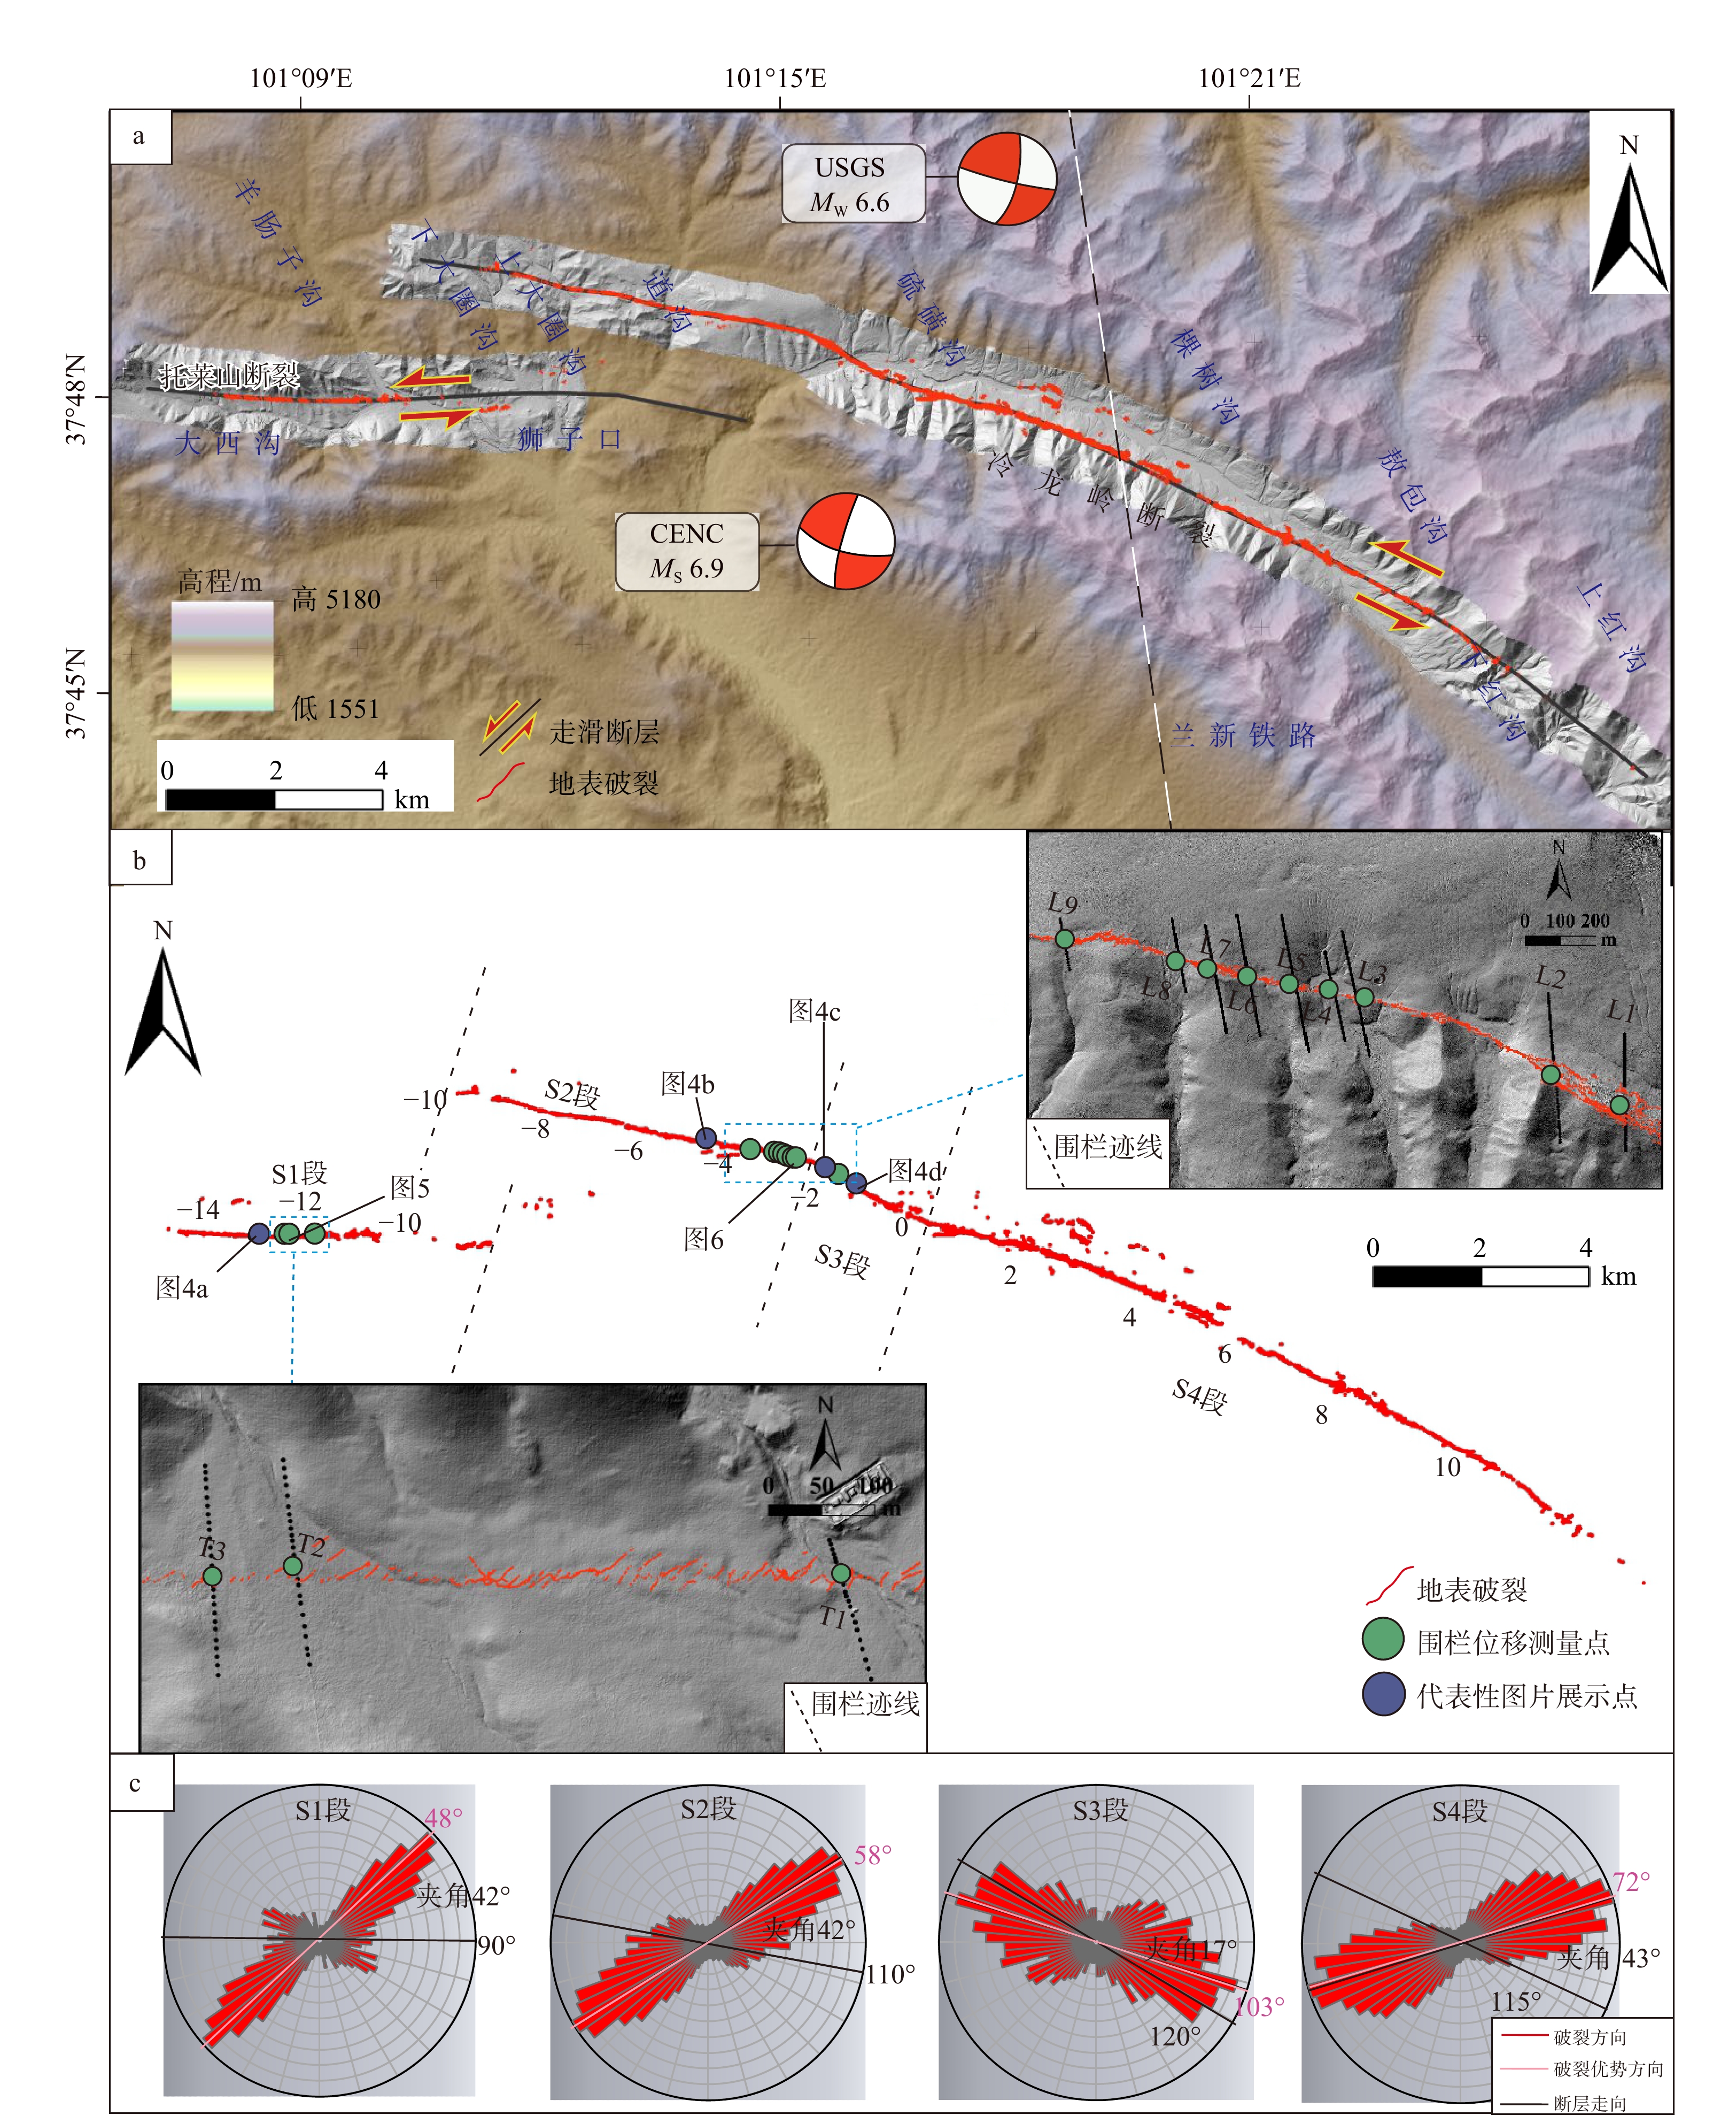
图 3 门源MW 6.6地震同震地表破裂带分布图
a—同震地表破裂展布图(2022年门源地震震中及震源机制沙滩球分别引自美国地质调查局USGS(2022)以及中国地震台网中心CENC(2022));b—地表破裂分段图(L1—L9、T1—T3为围栏编号);c—各段玫瑰花图(黑线代表破裂带整体走向,粉色线代表裂缝优势方向)
Figure 3. Distribution map of the coseismic surface rupture zone of the Menyuan MW 6.6 earthquake
(a) General distribution of the coseismic surface ruptures, 2022 Menyuan earthquake data from USGS (2022) and CENC (2022); (b) Detailed surface rupture distribution map (L1–L9 and T1–T3 denote fence numbers); (c) Rose diagrams for each segment, in which black lines represent the overall strike of the rupture zone, and pink lines represent the dominant direction of fractures
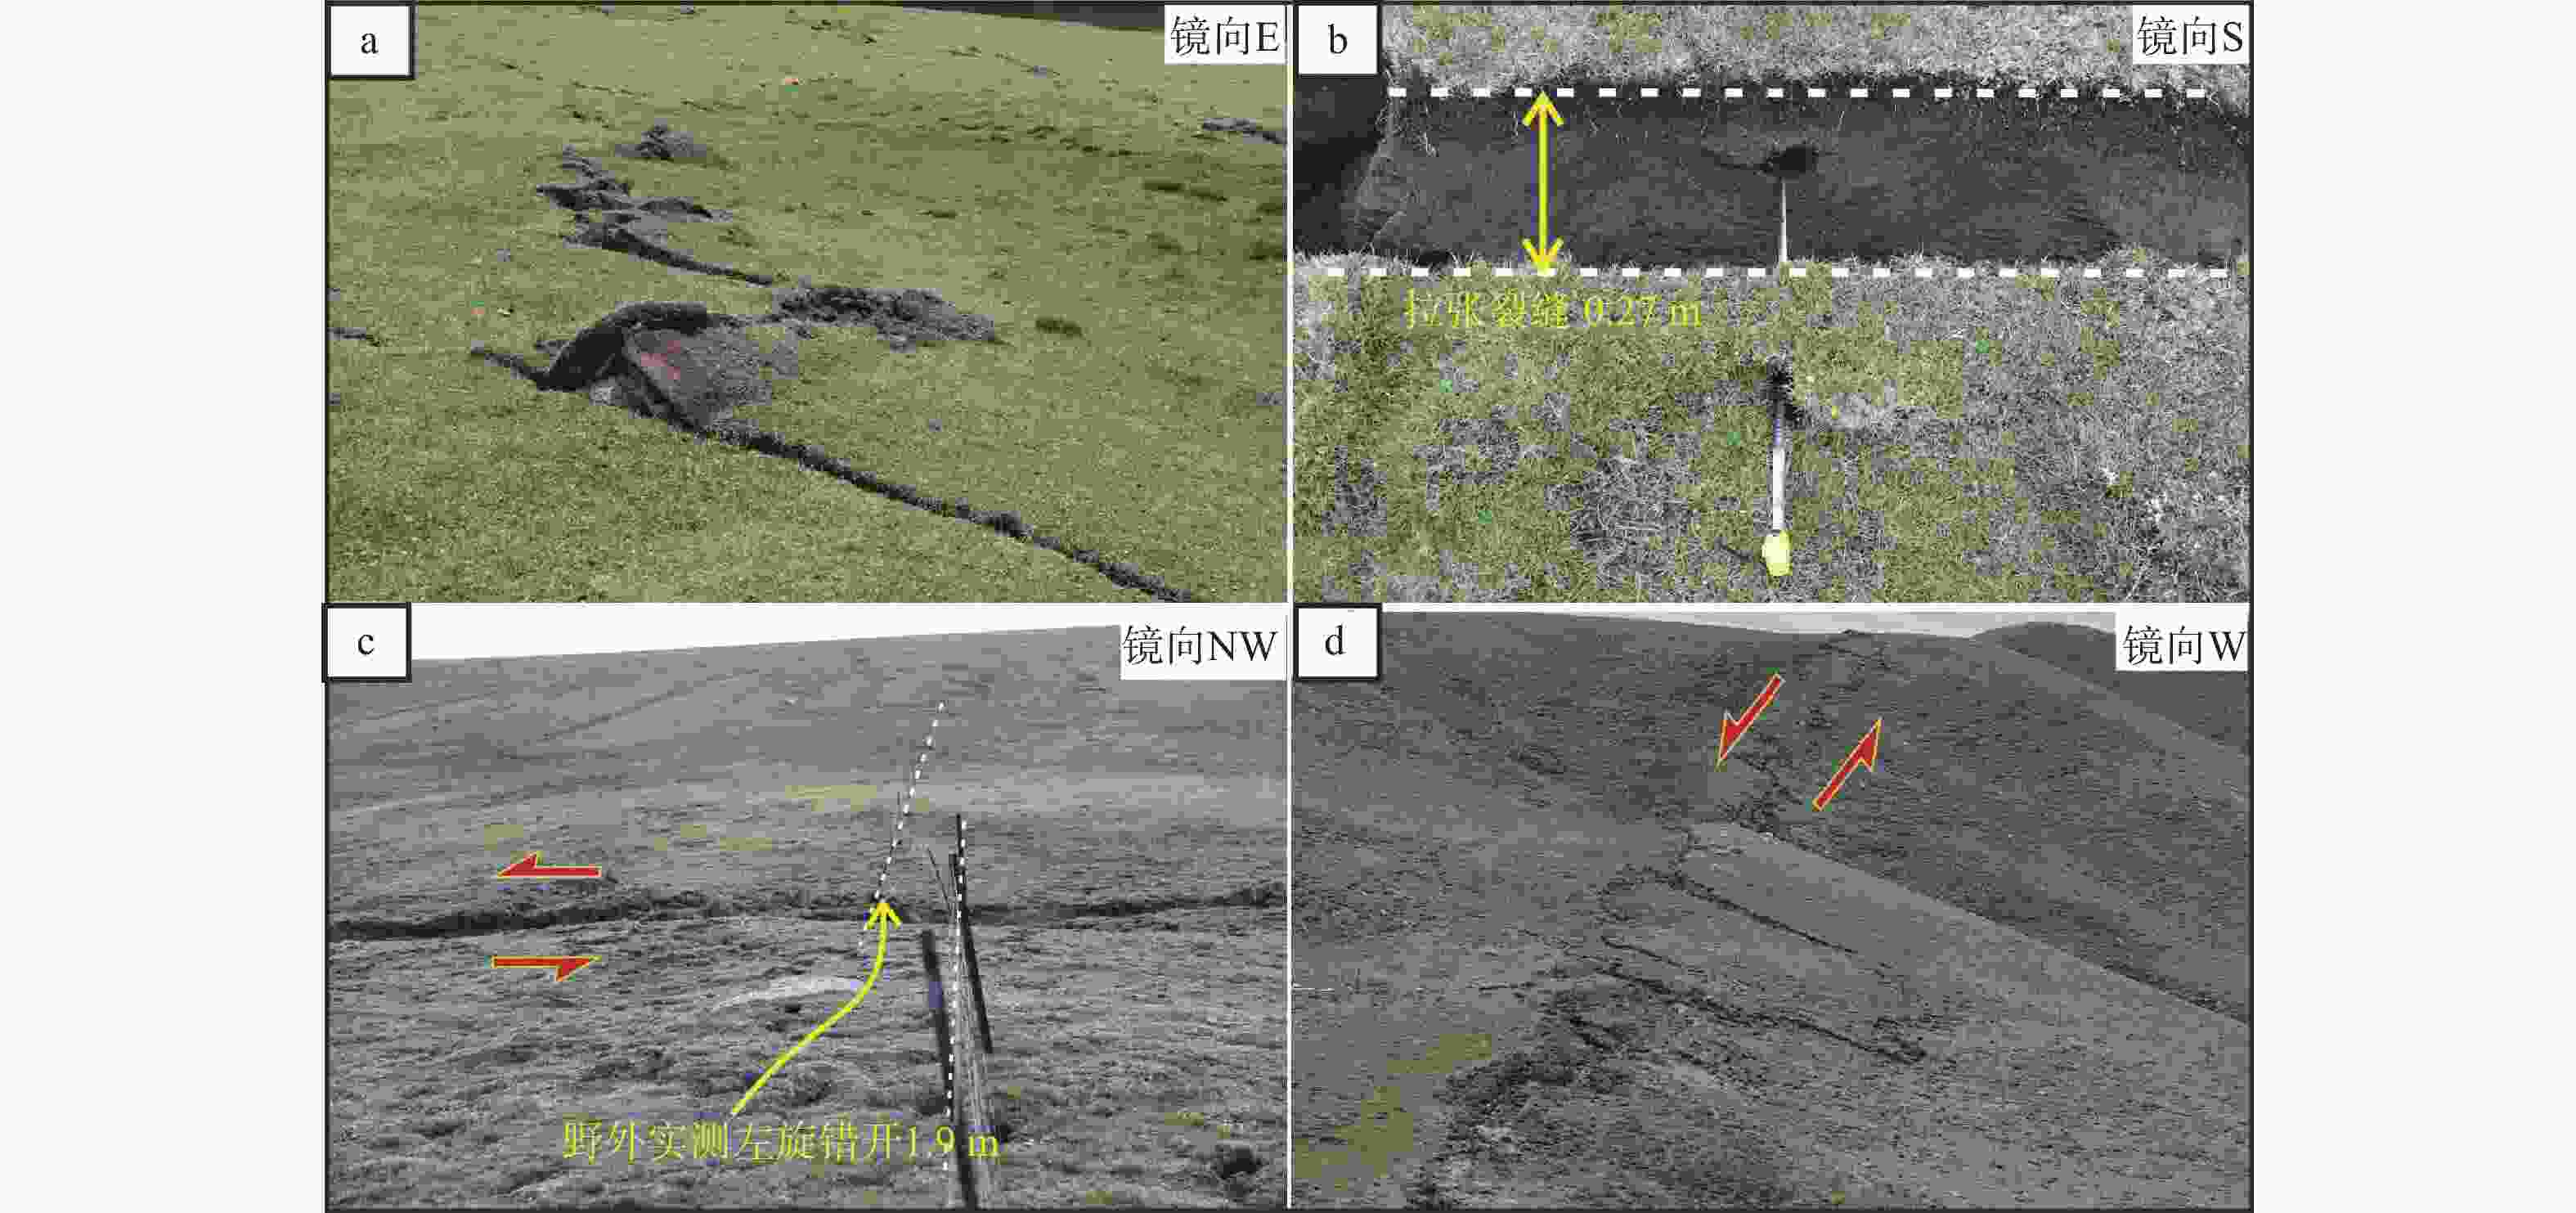
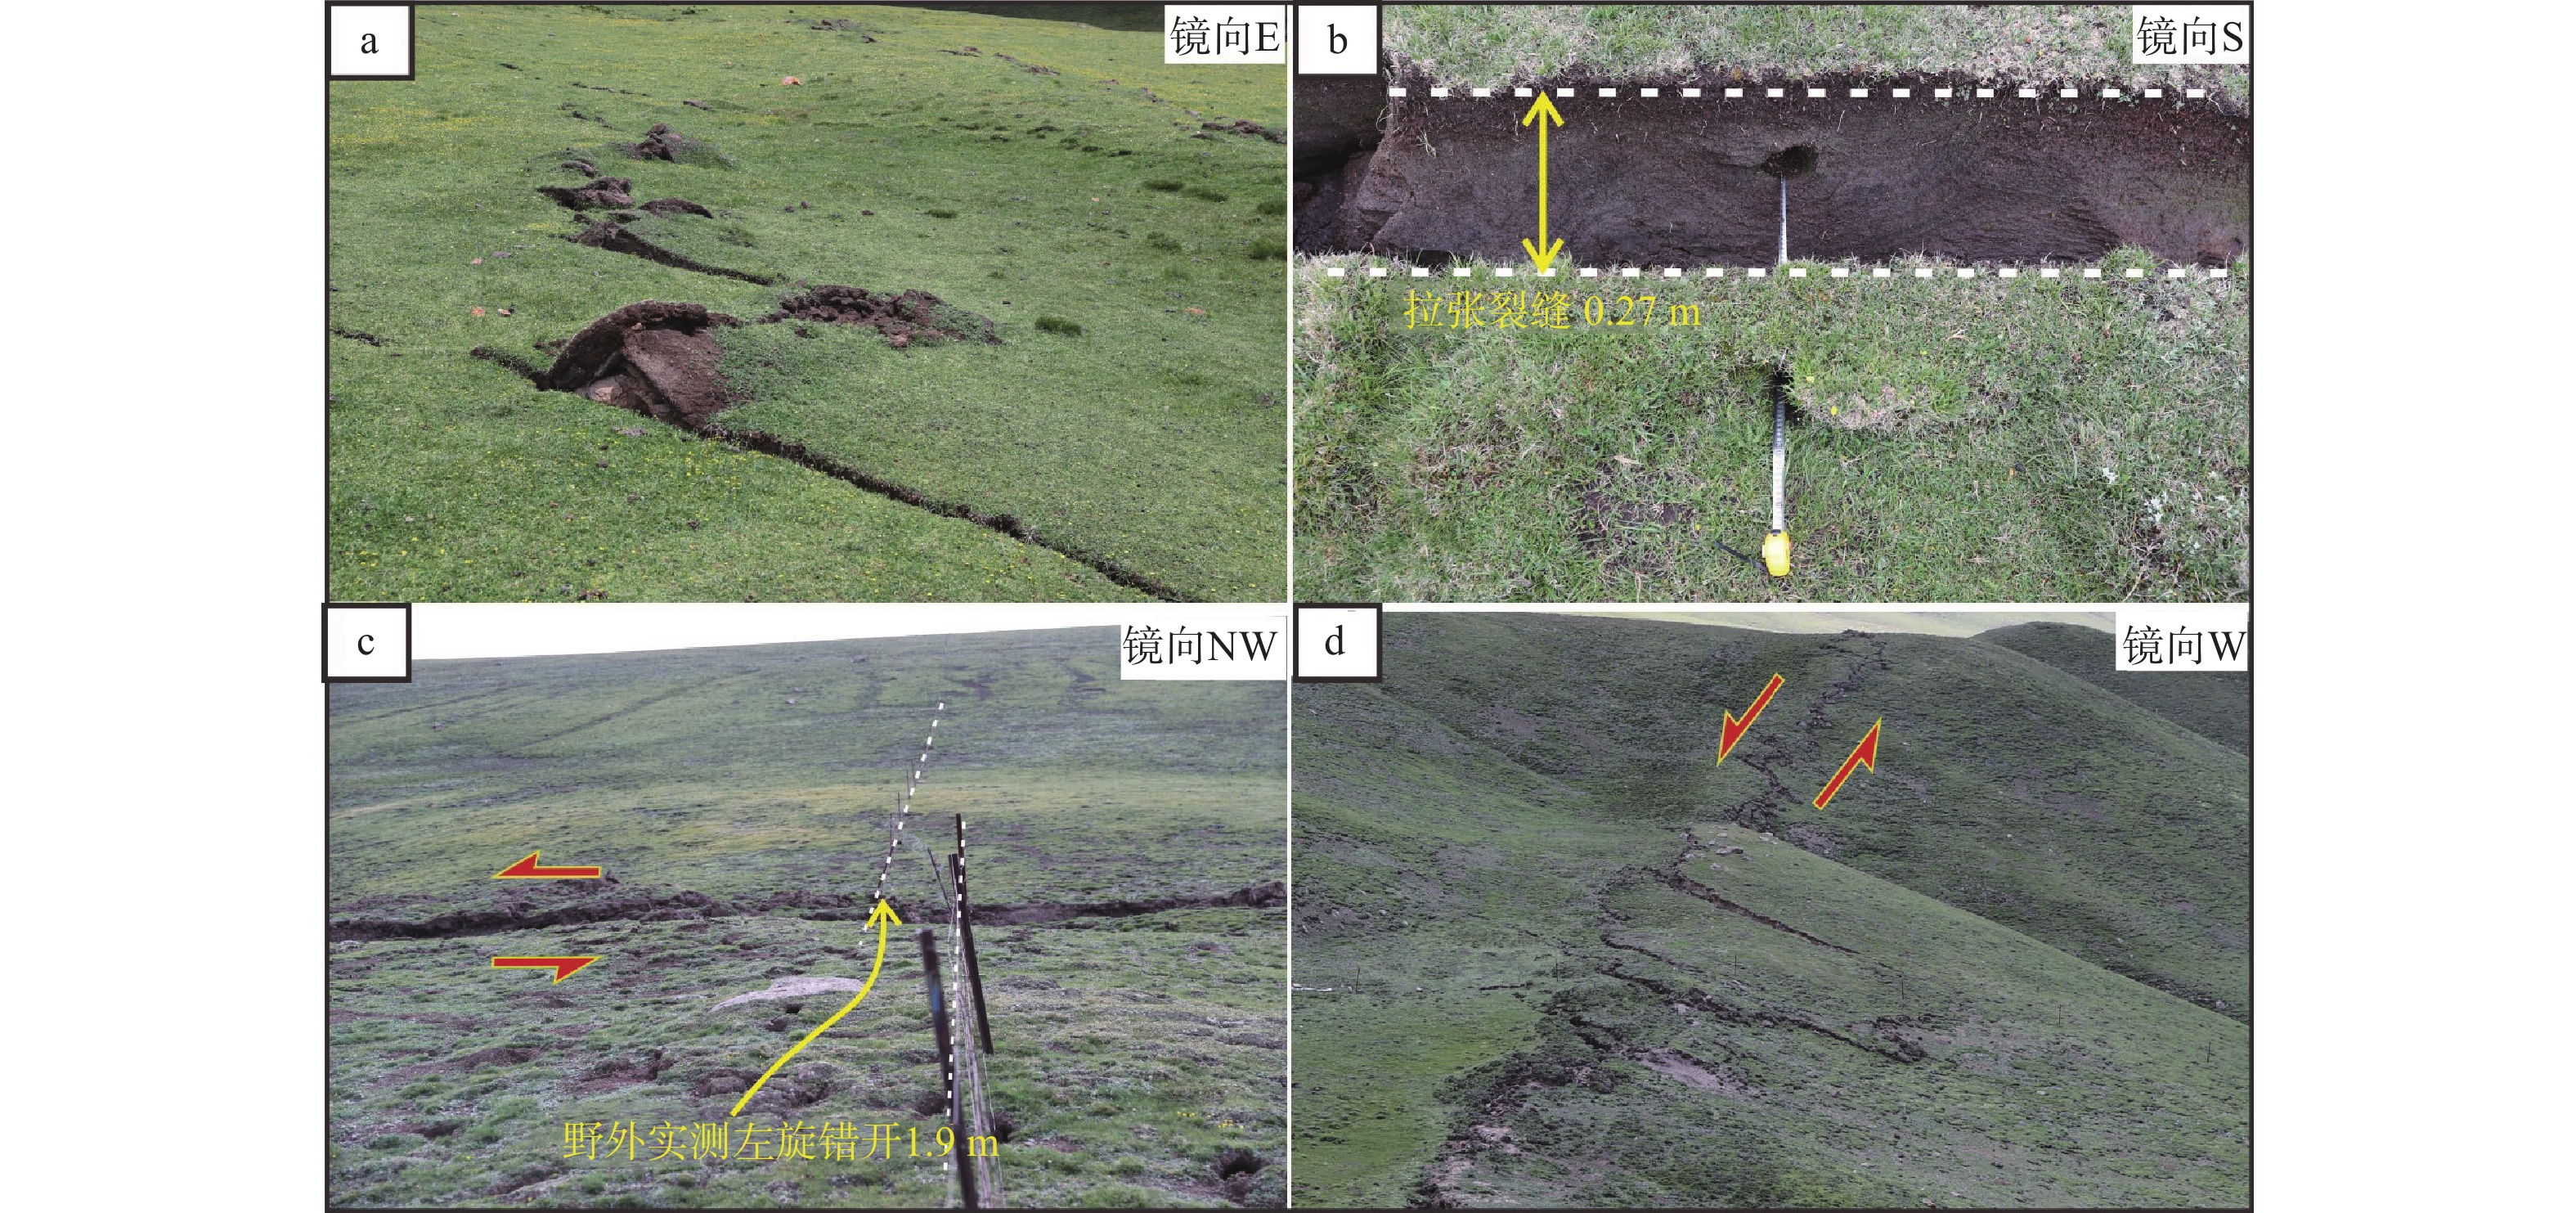
图 4 门源MW 6.6地震代表性地表破裂特征(具体位置见图3b)
a—S1段雁列状展布的小型挤压鼓包和张剪性裂隙;b—S2段内的拉张裂缝;c—S3段内被地震错开的围栏;d—S3段内右阶展布的左旋剪切裂缝
Figure 4. Representative coseismic surface rupture characteristics of the MW 6.6 Menyuan earthquake (see Fig. 3b for specific locations)
(a) Small-scale compressional mole tracks and extensional shear fractures with en echelon distribution within segment S1; (b) Tensional cracks within segment S2; (c) Displaced fence within segment S3; (d) Left-lateral shear fractures with right-stepping within segment S3
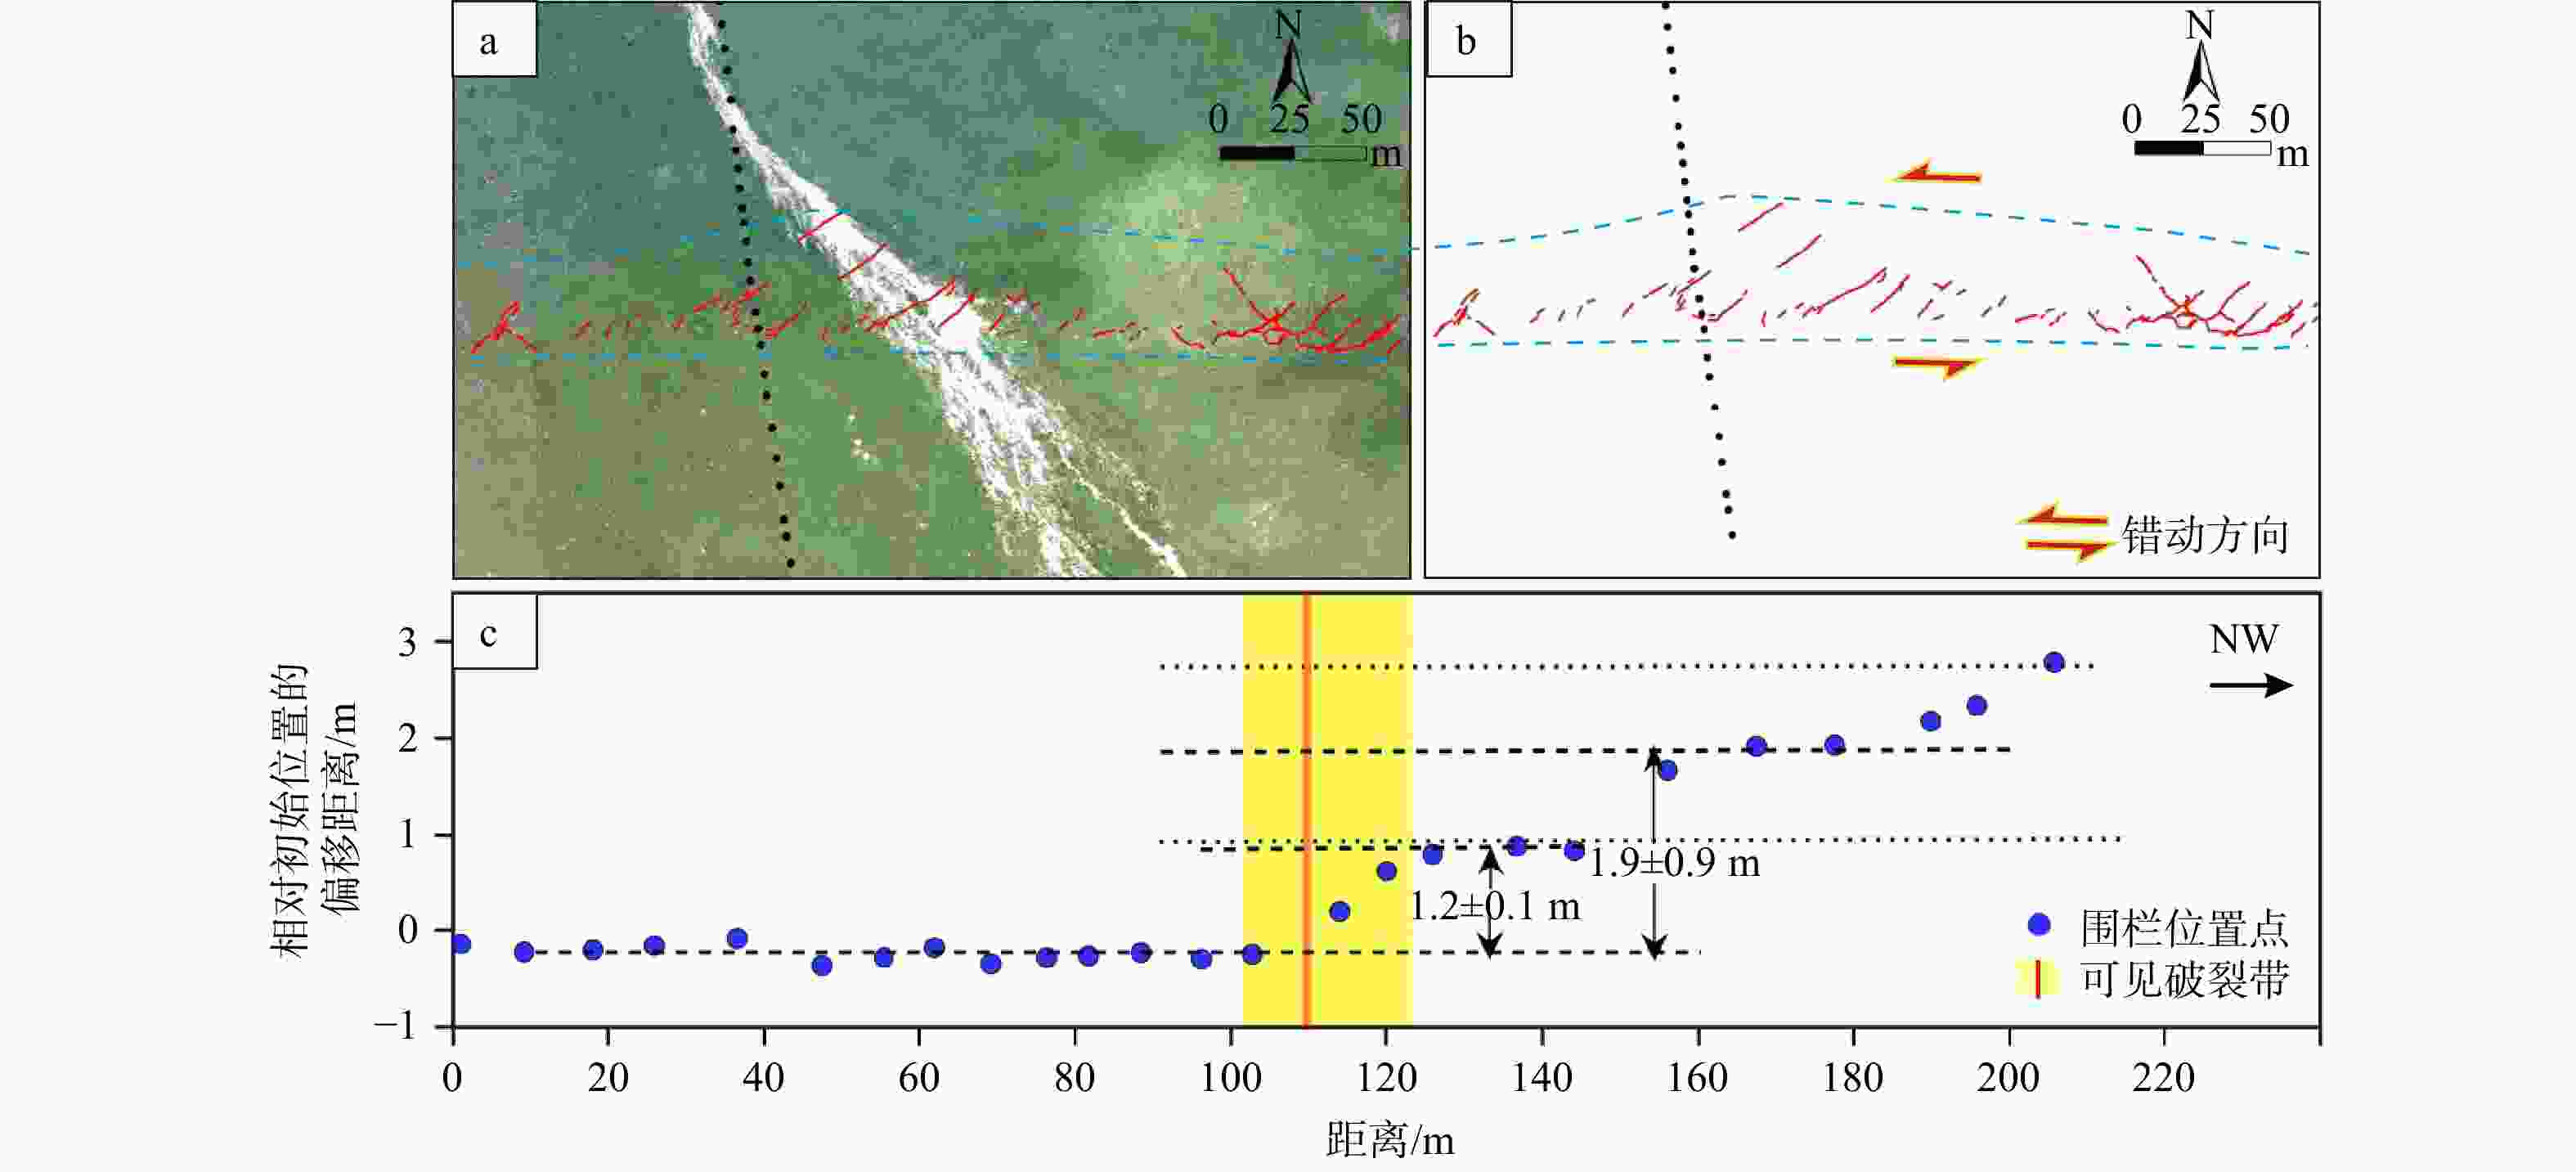
图 5 T2点位的同震位移测量图
图5a、5b中黑色虚线为围栏迹线,红线为地表破裂,蓝色虚线为地表破裂包络线;图5c中黑色粗虚线依据拟合的围栏震前原始走向,细虚线为误差范围a—T2点位围栏的正射影像分布图;b—地表破裂映射与位置点的投影解译图;c—震后围栏各位置点垂直于地表破裂带走向的位移测量
Figure 5. Coseismic displacement measurement at site T2
(a) Orthophoto image showing the distribution of the fence at site T2; (b) Interpretation showing surface rupture mapping and the projection of position points; (c) Measurement of post-earthquake fence-point displacements perpendicular to the strike of the surface rupture zone. In pael a and b, the black dashed lines indicate the fence traces, the red lines indicate surface ruptures, and the blue dashed line indicates the envelope of the surface rupture zone. In panel c, the thick black dashed line represents the fitted original pre-earthquake trend of the fence, and the thin dashed lines indicate the error range.
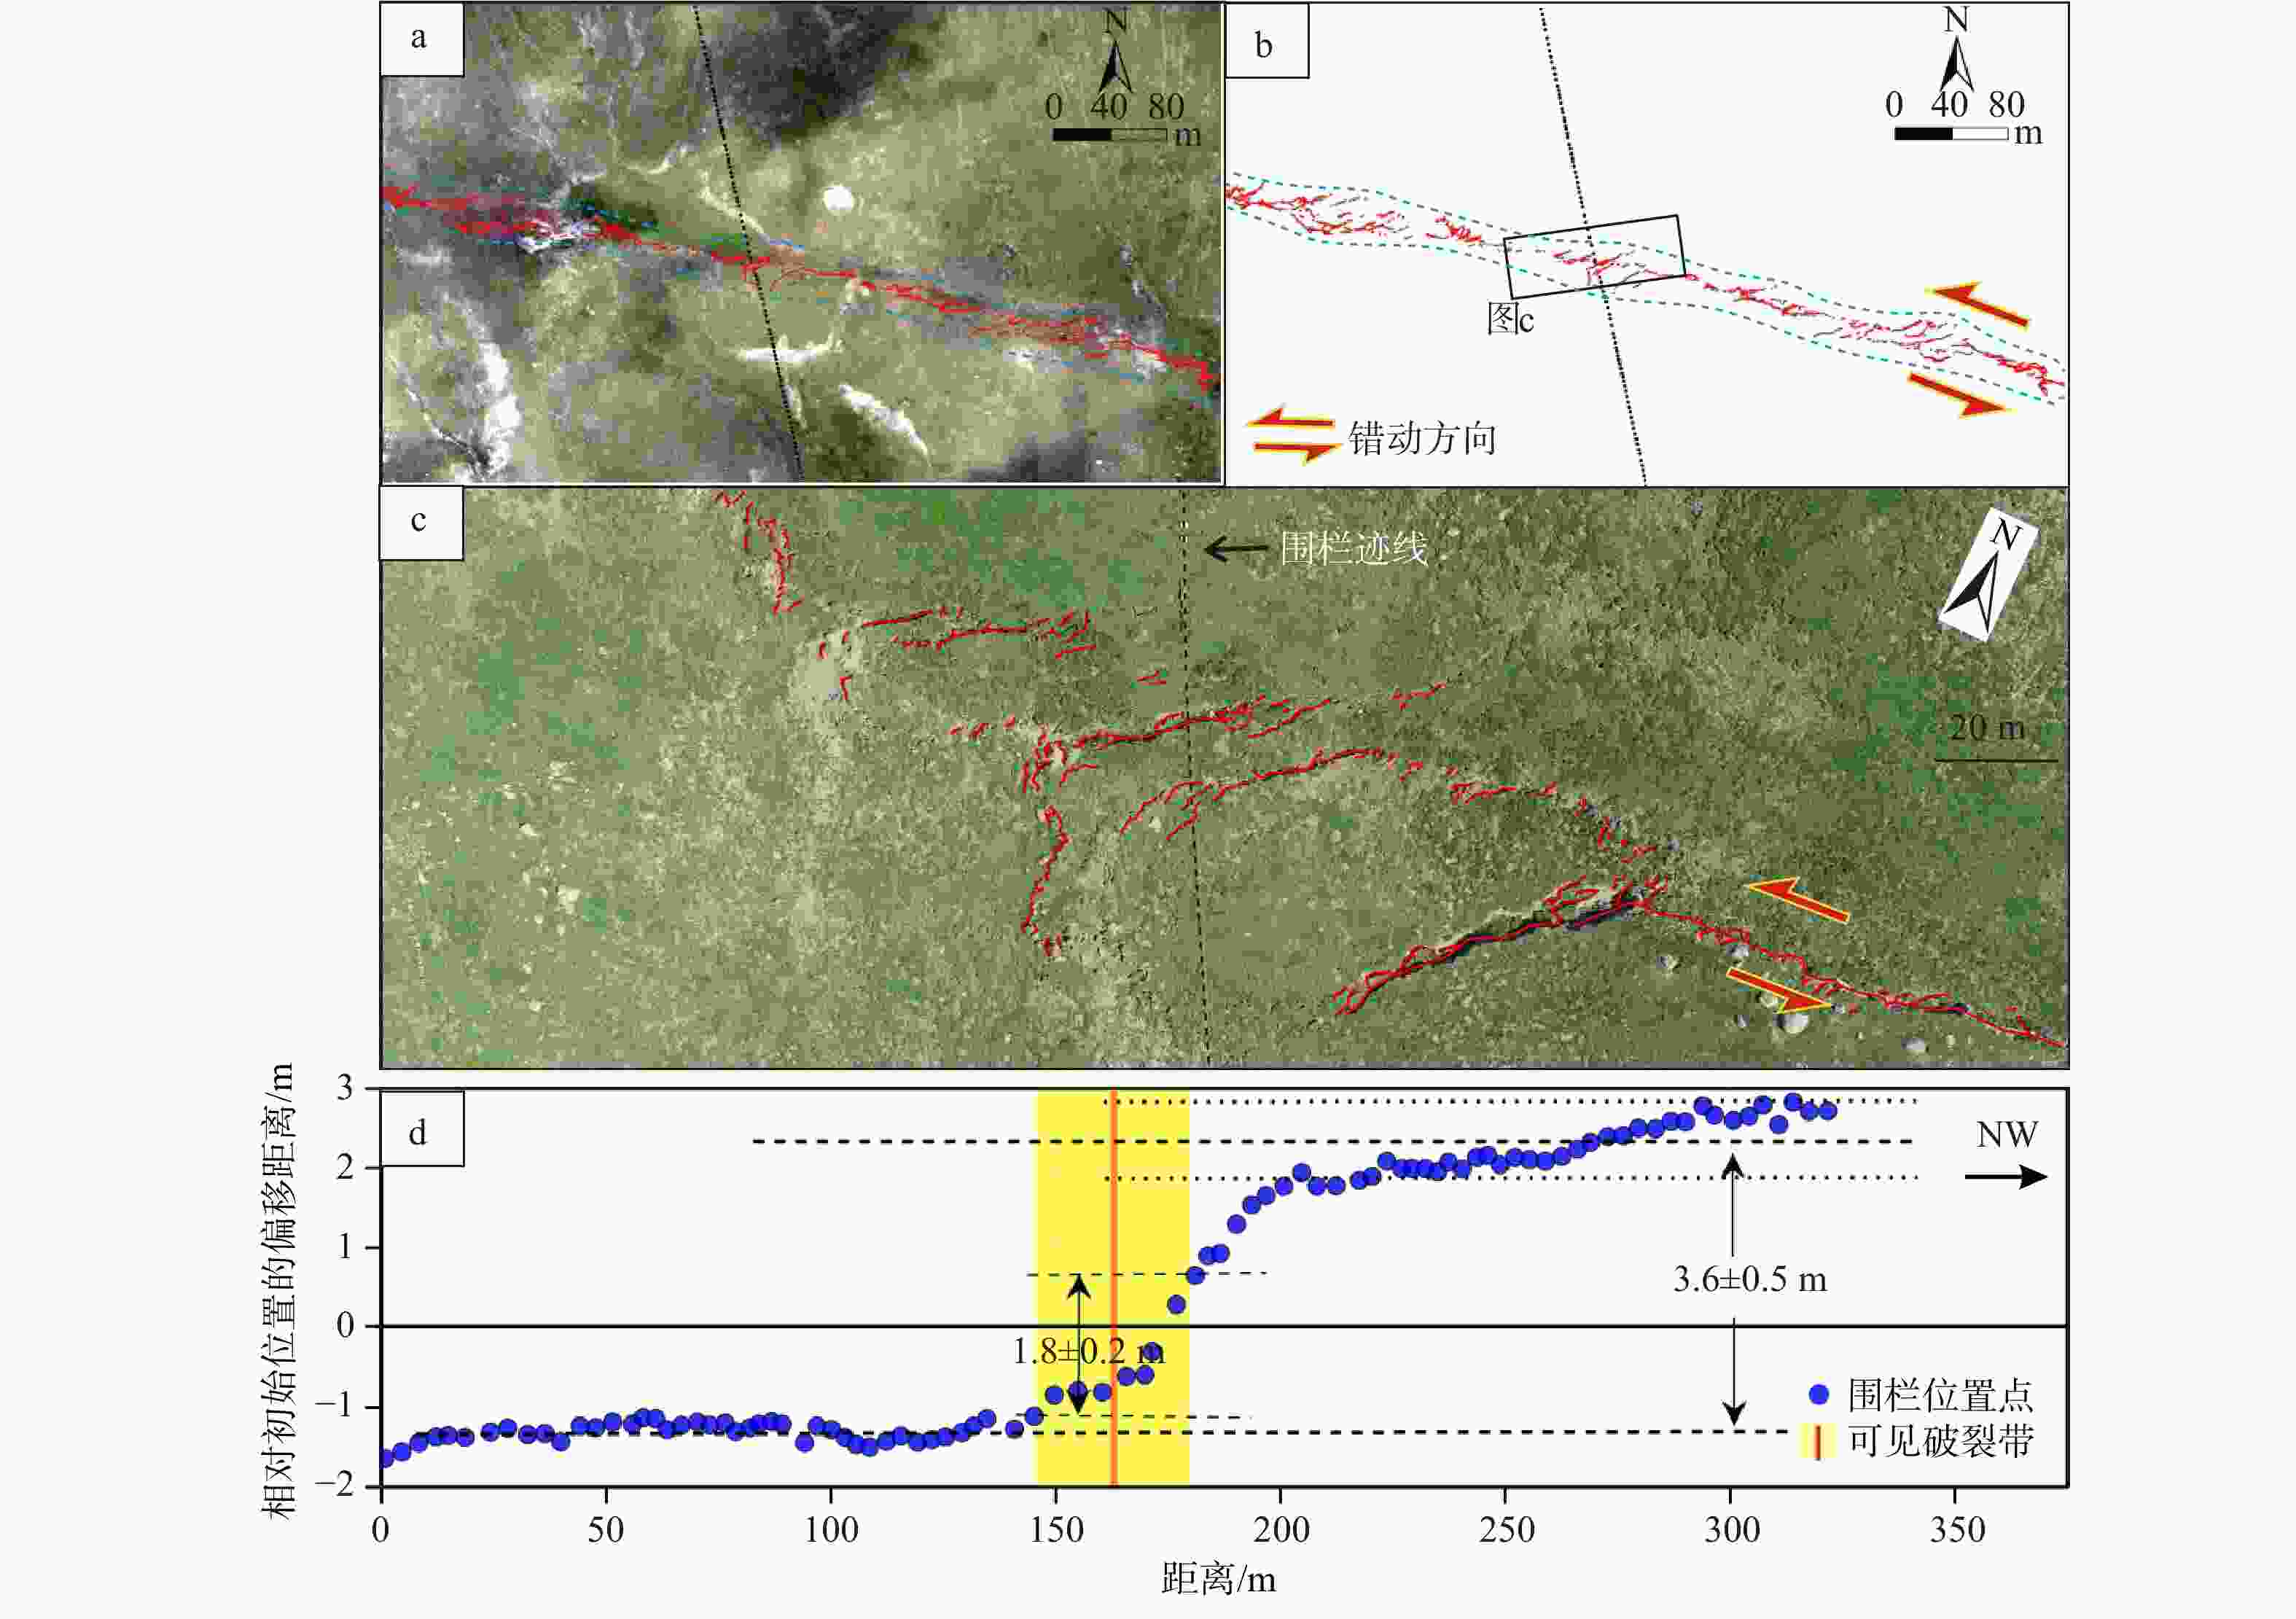
图 6 L3点位的同震位移测量图
图6a、6b、6c中黑色虚线为围栏迹线,红线为地表破裂,蓝色虚线为地表破裂包络线;图6d中黑色粗虚线依据为拟合的围栏震前原始走向,细虚线为误差范围a—围栏基于的正射影像分布图;b—地表破裂映射与位置点的投影解译图;c—基于更高分辨率的DOM所描绘的围栏迹线;d—震后围栏各位置点垂直于地表破裂带走向的位移测量示意图
Figure 6. Coseismic displacement measurement at site L3
(a) Orthophoto showing the distribution of the fence; (b) Interpretation showing surface rupture mapping and the projection of position points; (c) Fence traces mapped from a higher-resolution DOM; (d) Schematic diagram showing the measurement of post-earthquake fence-point displacements perpendicular to the strike of the surface rupture zone In panels a, b, and c, the black dashed lines indicate the fence traces, the red lines indicate surface ruptures, and the blue dashed line indicates the envelope of the surface rupture zone. In panel d, the thick black dashed line represents the fitted original pre-earthquake trend of the fence, and the thin dashed lines indicate the error range.
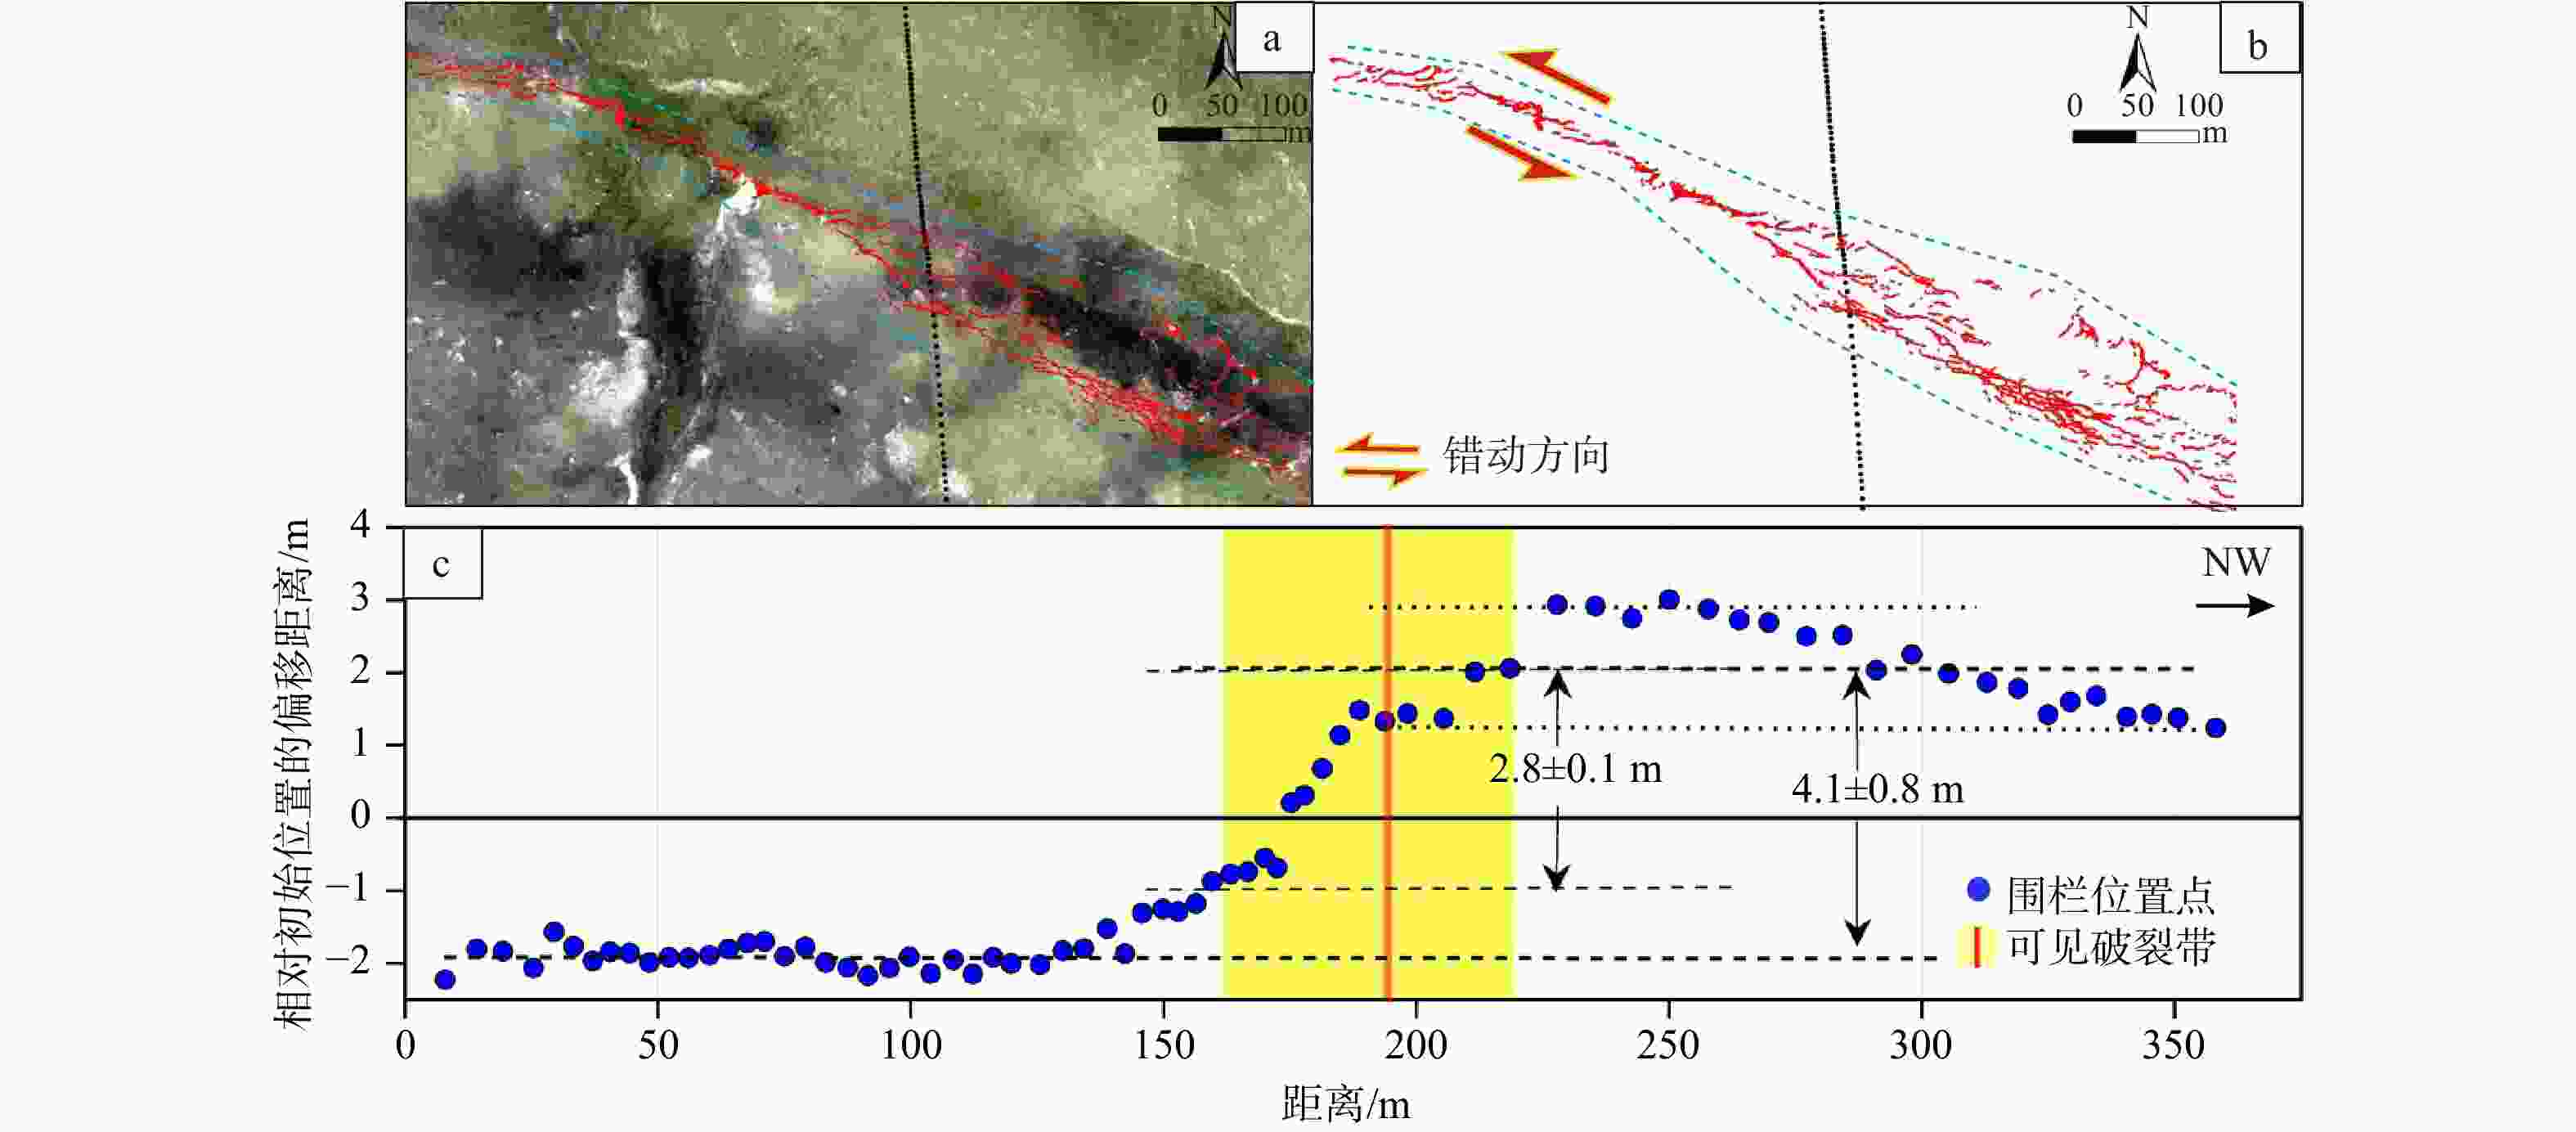
图 7 L2点位的同震位移测量图
图7a、7b中黑色虚线为围栏迹线,红线为地表破裂,蓝色虚线为地表破裂包络线;图7c中黑色粗虚线依据为拟合的围栏震前原始走向,细虚线为误差范围a—L2点位围栏基于的正射影像分布图 b—地表破裂映射与位置点的投影解译图;c—震后围栏各位置点垂直于地表破裂带走向的位移测量.
Figure 7. Coseismic displacement measurement at site L2
(a) Orthophoto showing the distribution of the fence at site L2; (b) Interpretation showing surface rupture mapping and the projection of position points; (c) Measurement of post-earthquake fence-point displacements perpendicular to the strike of the surface rupture zone In panel a and b, the black dashed lines indicate the fence traces, the red lines indicate surface ruptures, and the blue dashed line indicates the envelope of the surface rupture zone. In panel c, the thick black dashed line represents the fitted pre-earthquake original trend of the fence, and the thin dashed lines indicate the error range.
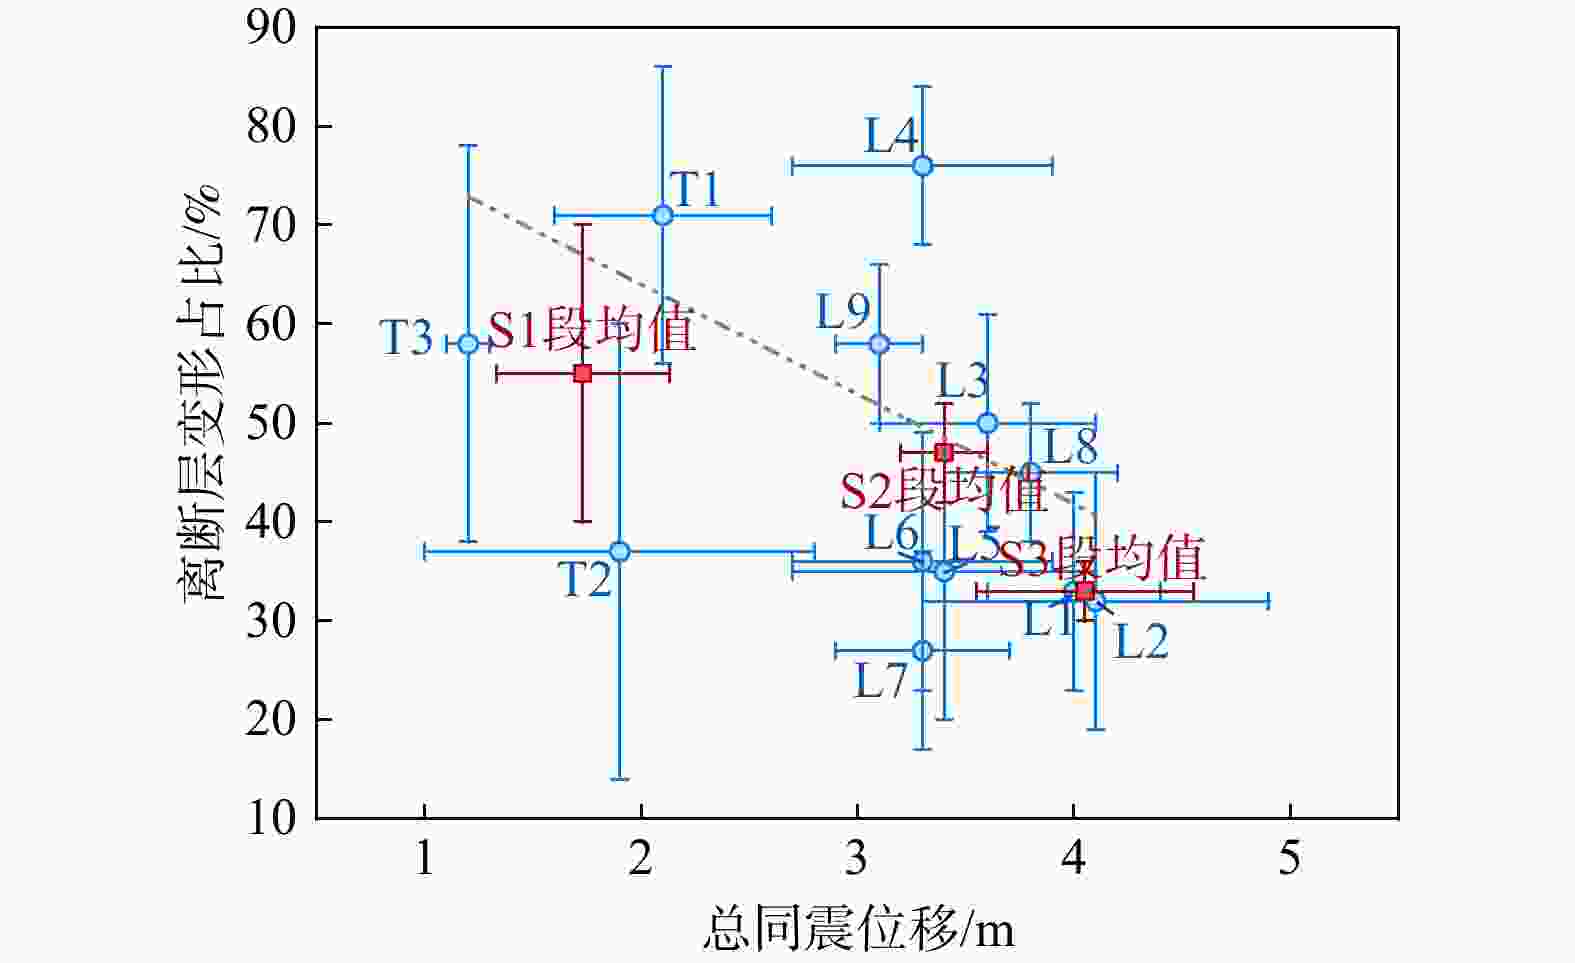
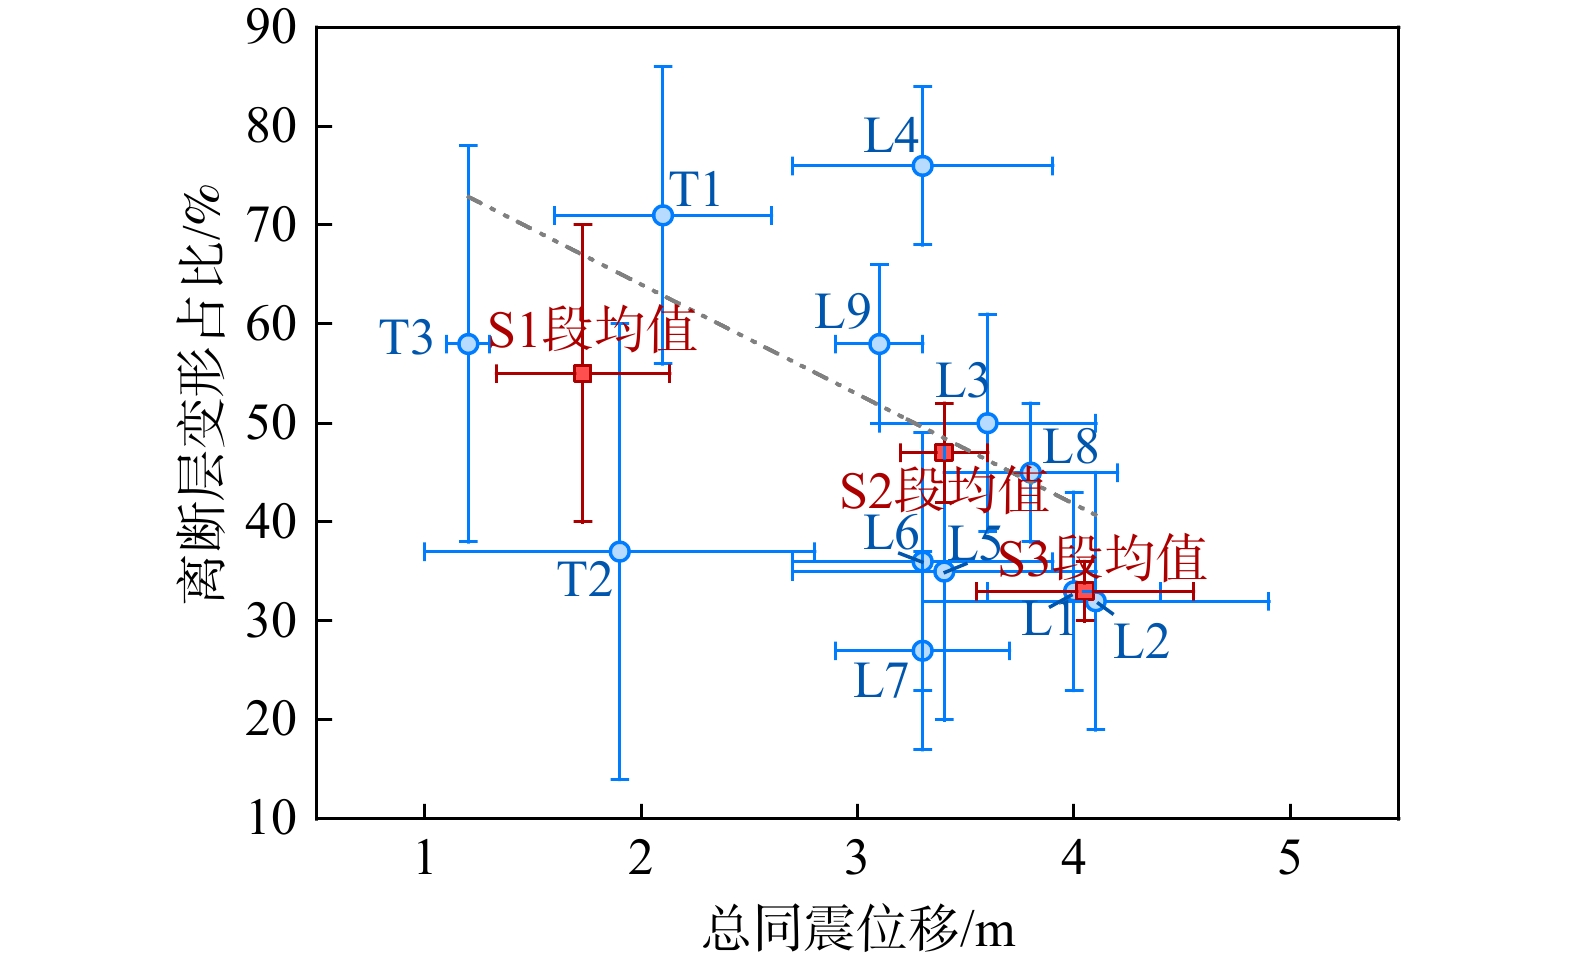
图 8 总同震位移与离断层变形占比关系图
S1段包含点位T1—T3,S2段包含点位L3—L9,S3段包含点位L1、L2;蓝色点为基于围栏的实测点,红色点为S1—S3段的测量均值,线段为点位的误差范围,灰色虚线表示线性拟合关系
Figure 8. Relationship between total coseismic displacement and OFD ratio
Segment S1 includes sites T1–T3, segment S2 includes sites L3–L9, and segment S3 includes sites L1 and L2. The blue dots represent measured values based on fence offsets; the red dots represent the mean values of segments S1–S3. The line segments indicate the error ranges of the measurements, and the gray dashed line is the linear fit.
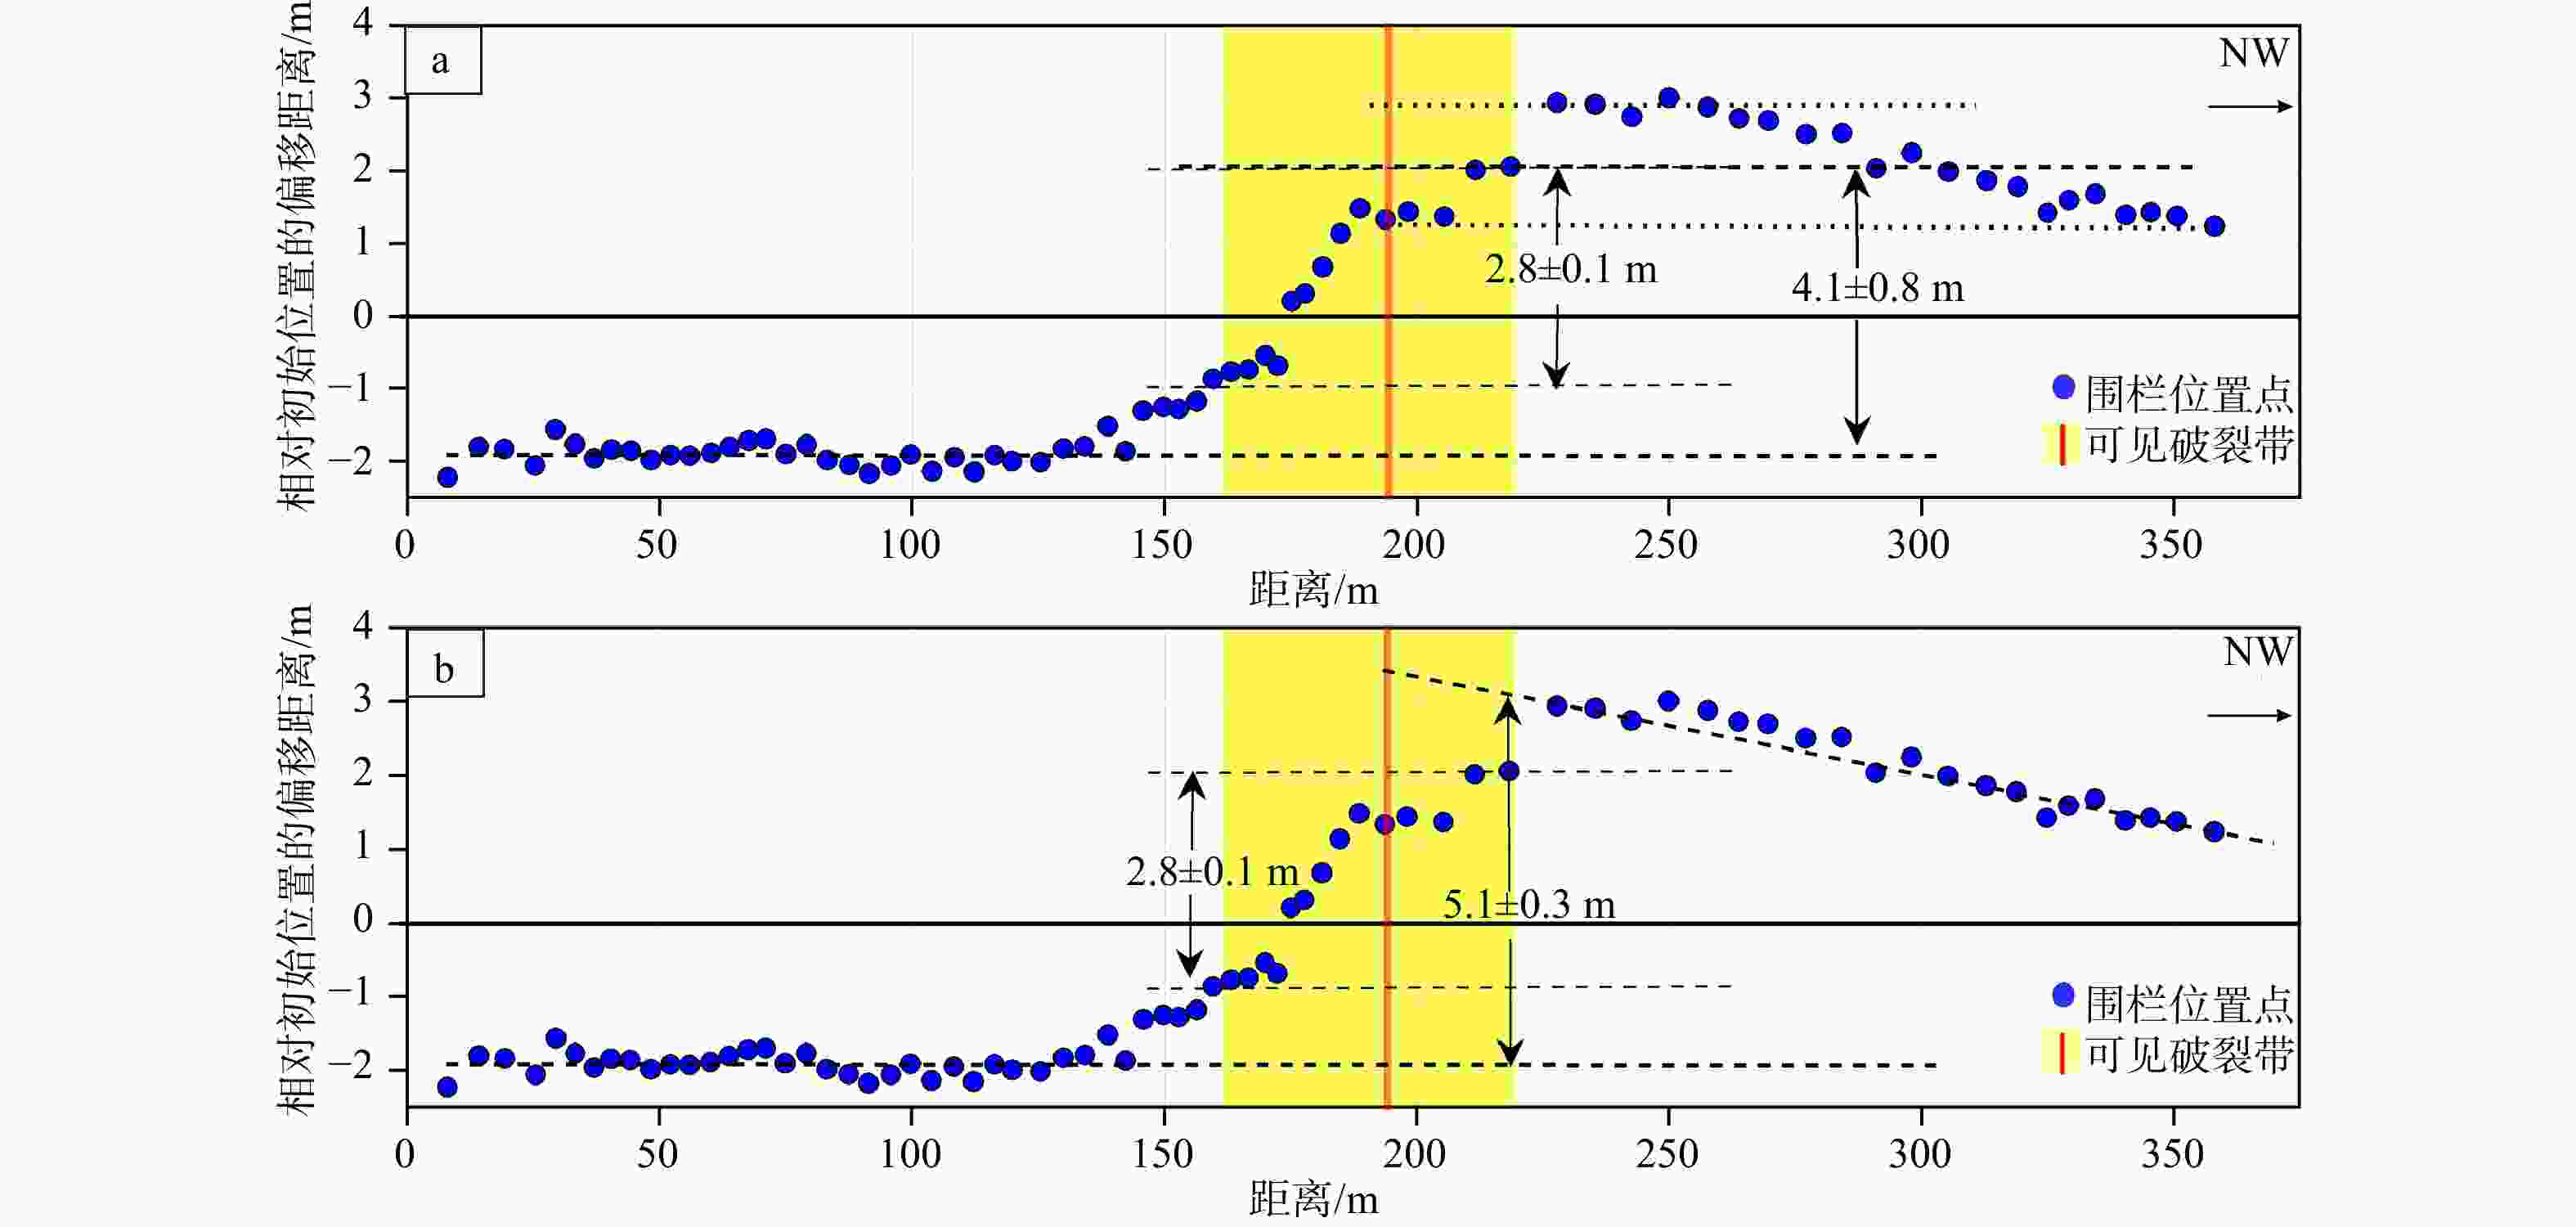
图 9 L2点位采取不同的围栏走向拟合方式得到的总同震位移结果
图中色粗虚线为围栏迹线投影破裂带上的测量示意,细虚线为误差范围,4.1±0.8 m和5.1±0.3 m对应不同测量方法得到的总同震位移a—L2点位基于震后围栏走向保持不变假设的位移测量示意图;b—L2点位基于同震围栏走向发生偏转假设的位移测量示意图
Figure 9. Total displacements obtained by different fitting methods for fence strike at site L2
(a) Schematic diagram of displacement measurements at site L2 under the assumption that the post-earthquake fence orientation remained unchanged; (b) Schematic diagram of displacement measurements at site L2 under the assumption of coseismic deflection of the fence orientationThe thick dashed line in the figure represents the projection of the fence trace on the rupture zone as a measurement indicator, the thin dashed line indicates the error range, and 4.1 ± 0.8 m and 5.1 ± 0.3 m correspond to the total coseismic displacements obtained by different measurement methods.
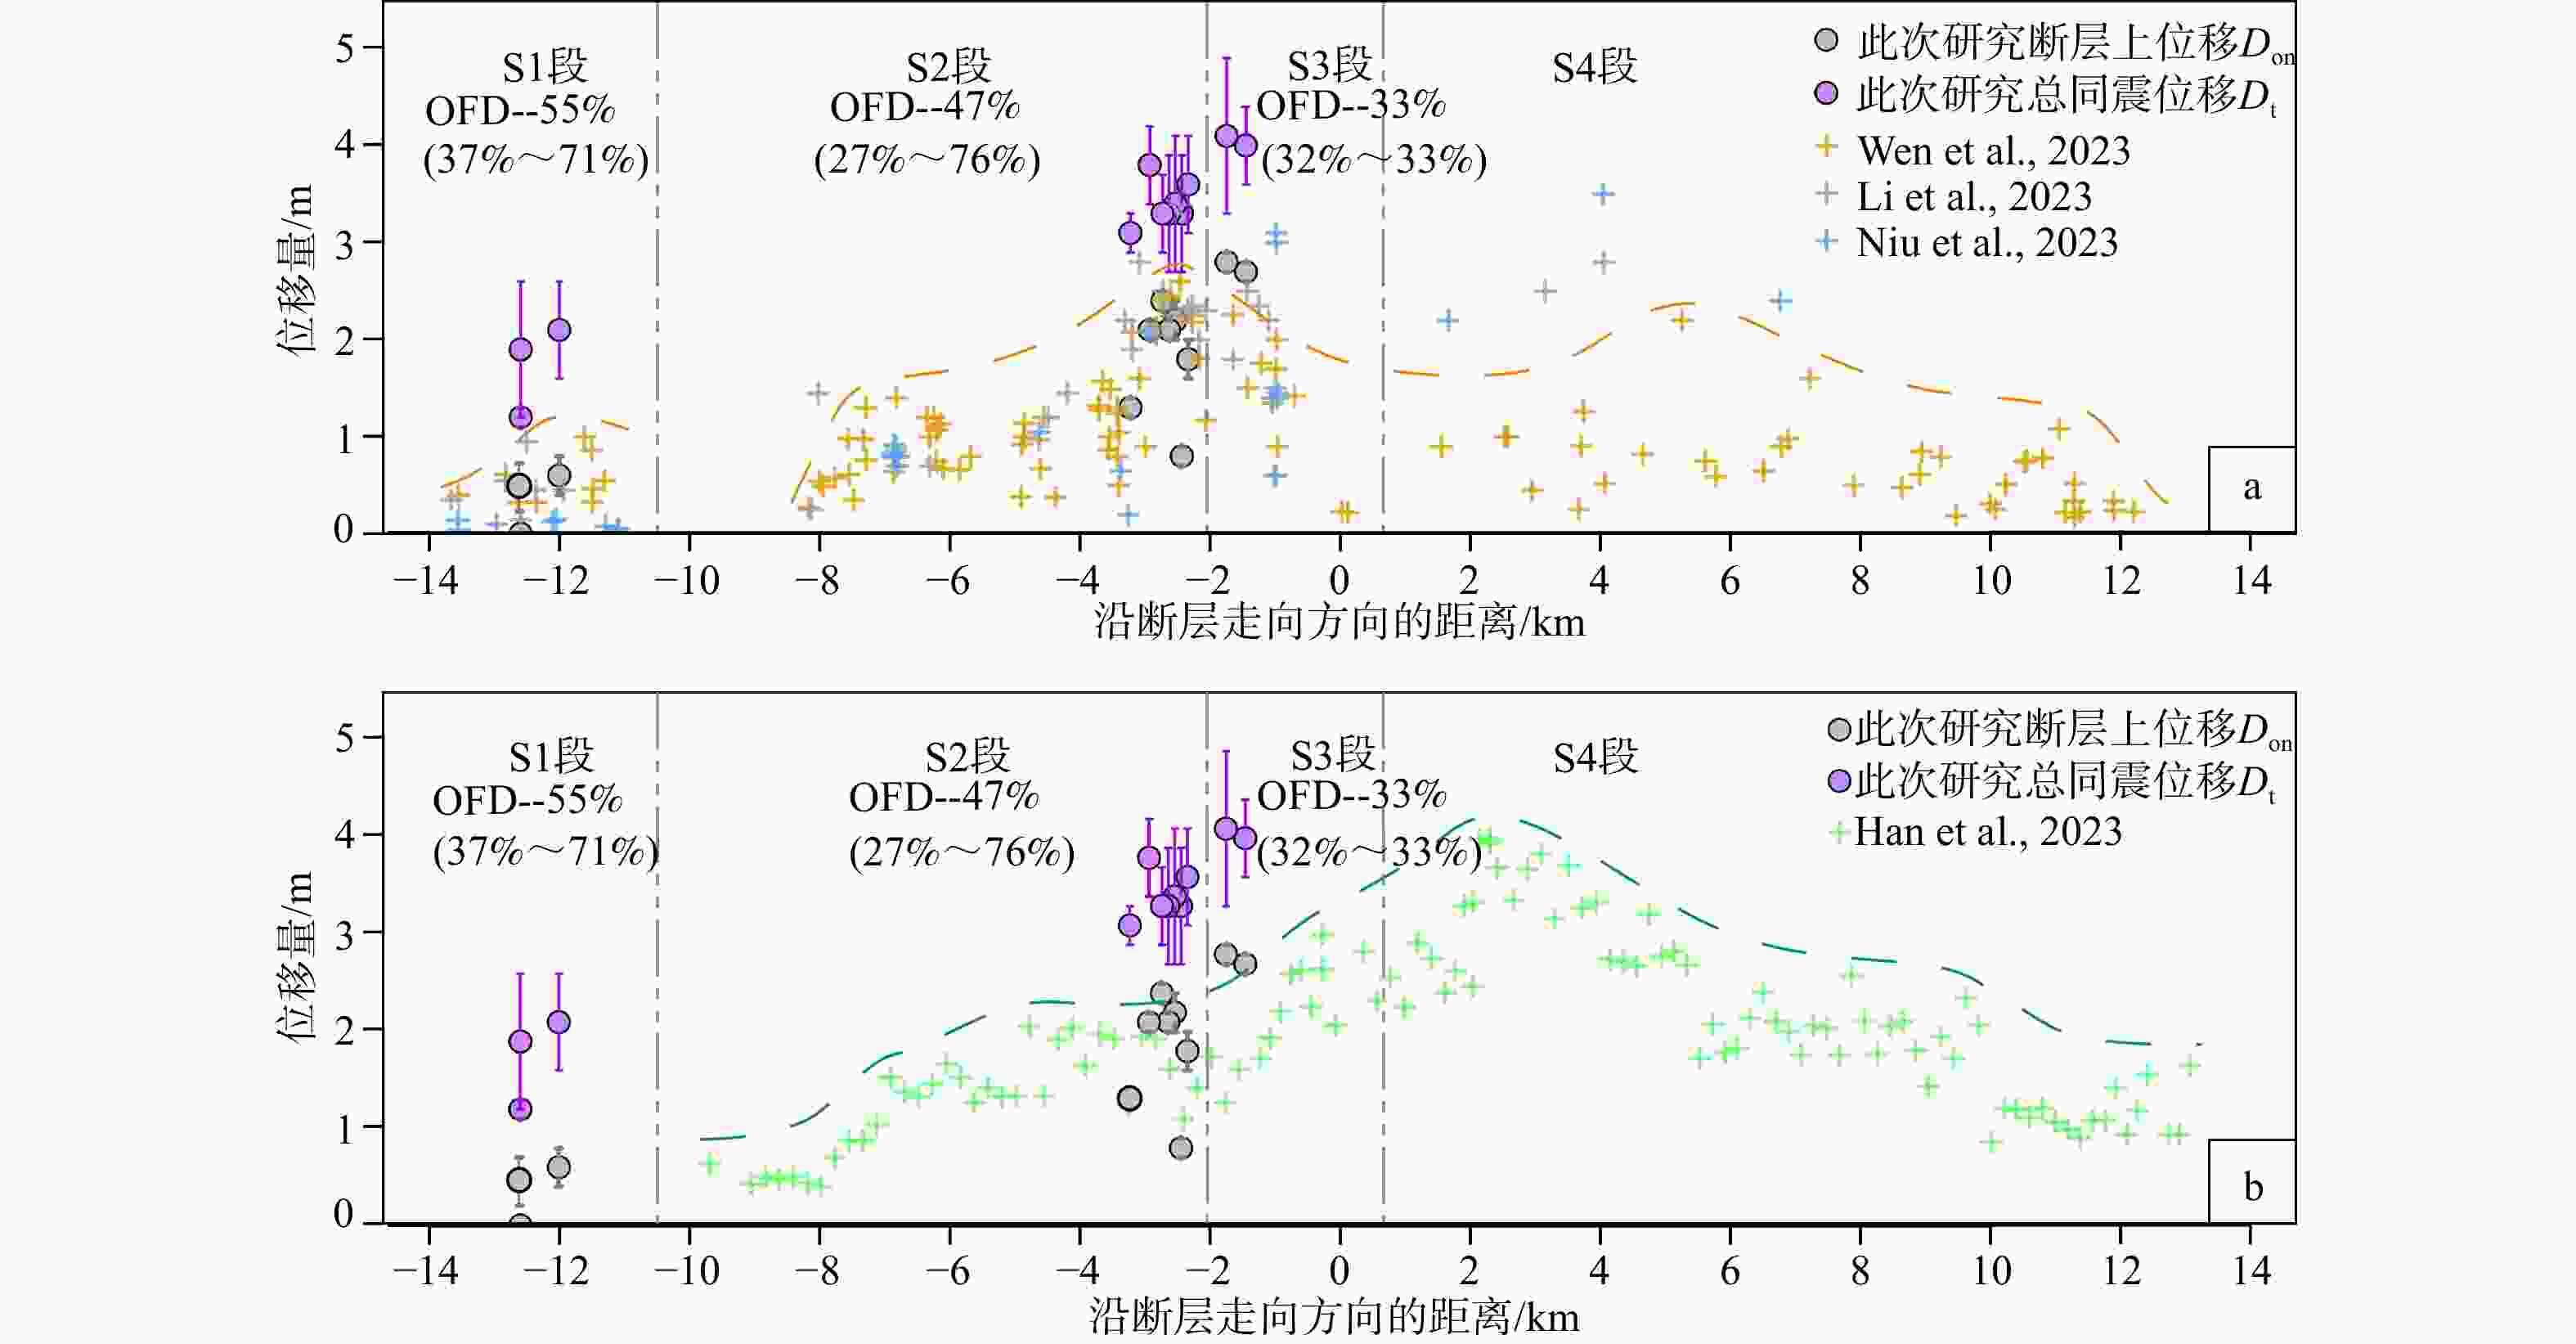
图 10 同震位移沿断层走向方向分布图
圆圈线段代表此次研究的位移测量值与误差范围,黄色和绿色的包络线指示已发表测量结果的最大包络趋势a—研究结果与相关学者基于野外调研(Wen et al., 2023; Li et al., 2023; Niu et al., 2023)的测量结果对比图;b—研究结果与光学影像匹配法(Han et al., 2023)的测量结果对比图
Figure 10. Distribution of coseismic displacement along the fault strike
(a) Comparison between the results of this study and previous measurements based on field investigations (Wen et al., 2023; Li et al., 2023; Niu et al., 2023); (b) Comparison between the results of this study and measurements obtained by optical image matching (Han et al., 2023) Circles with line segments represent the displacement measurements and error ranges of this study; the yellow and green envelopes indicate the maximum envelope trends of published measurements.
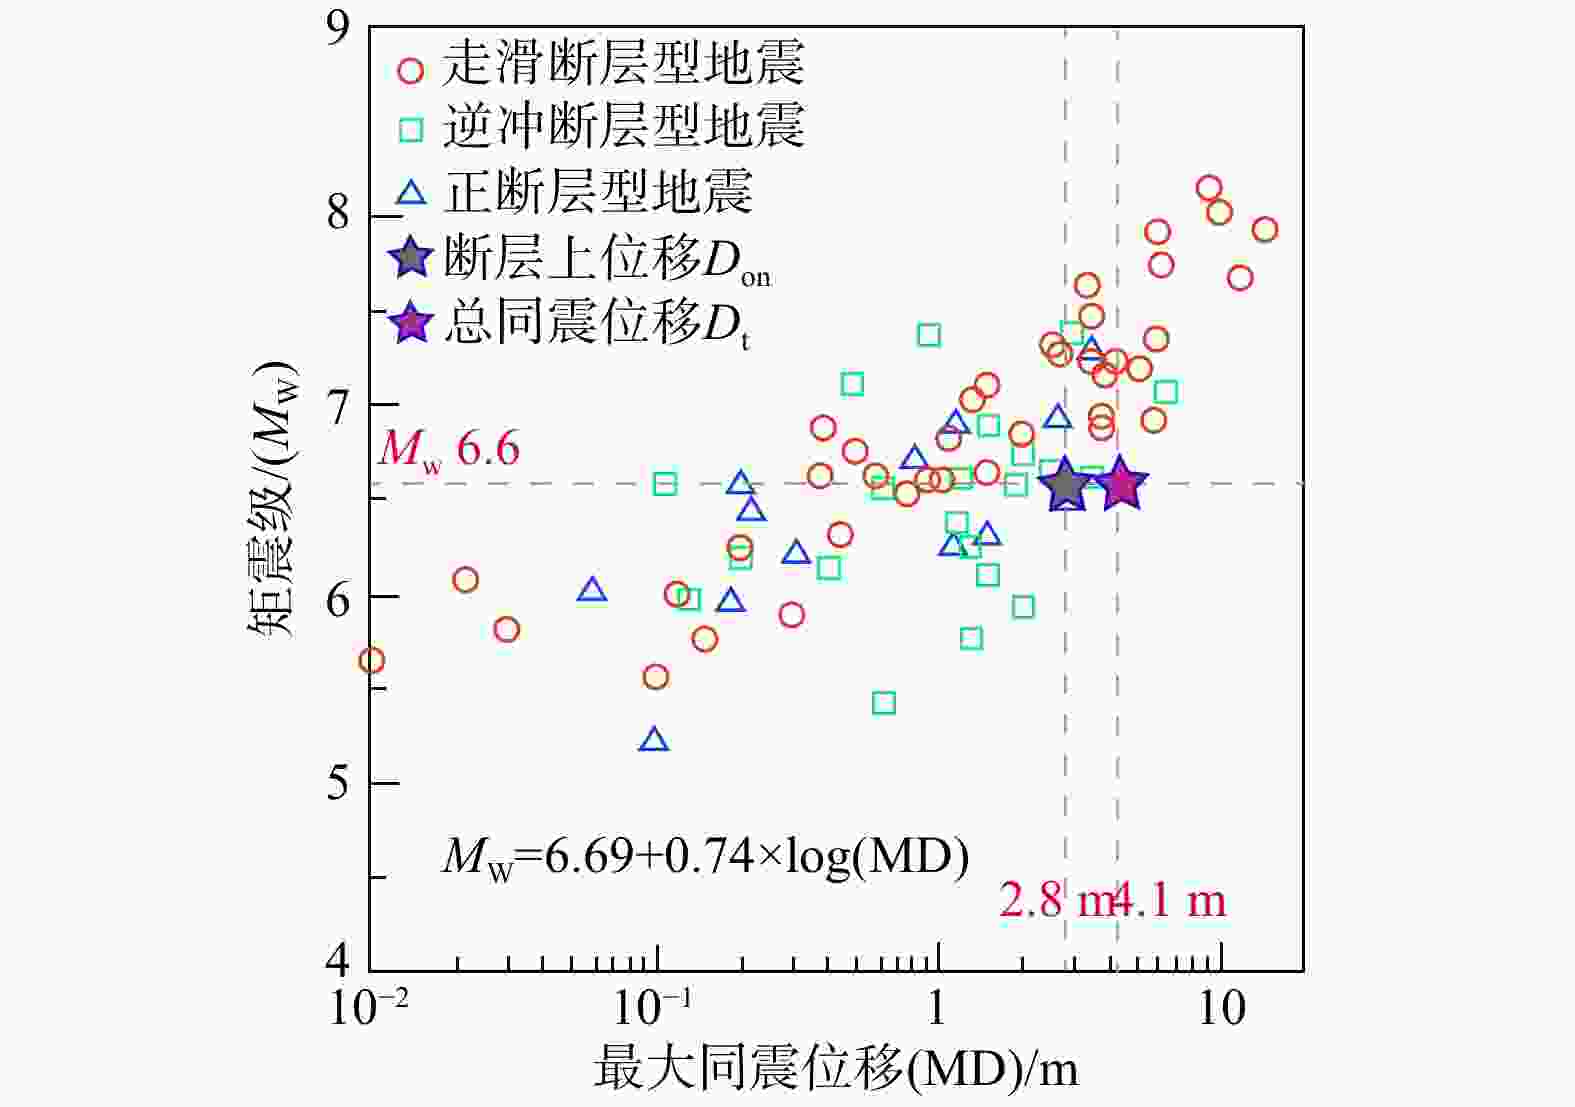
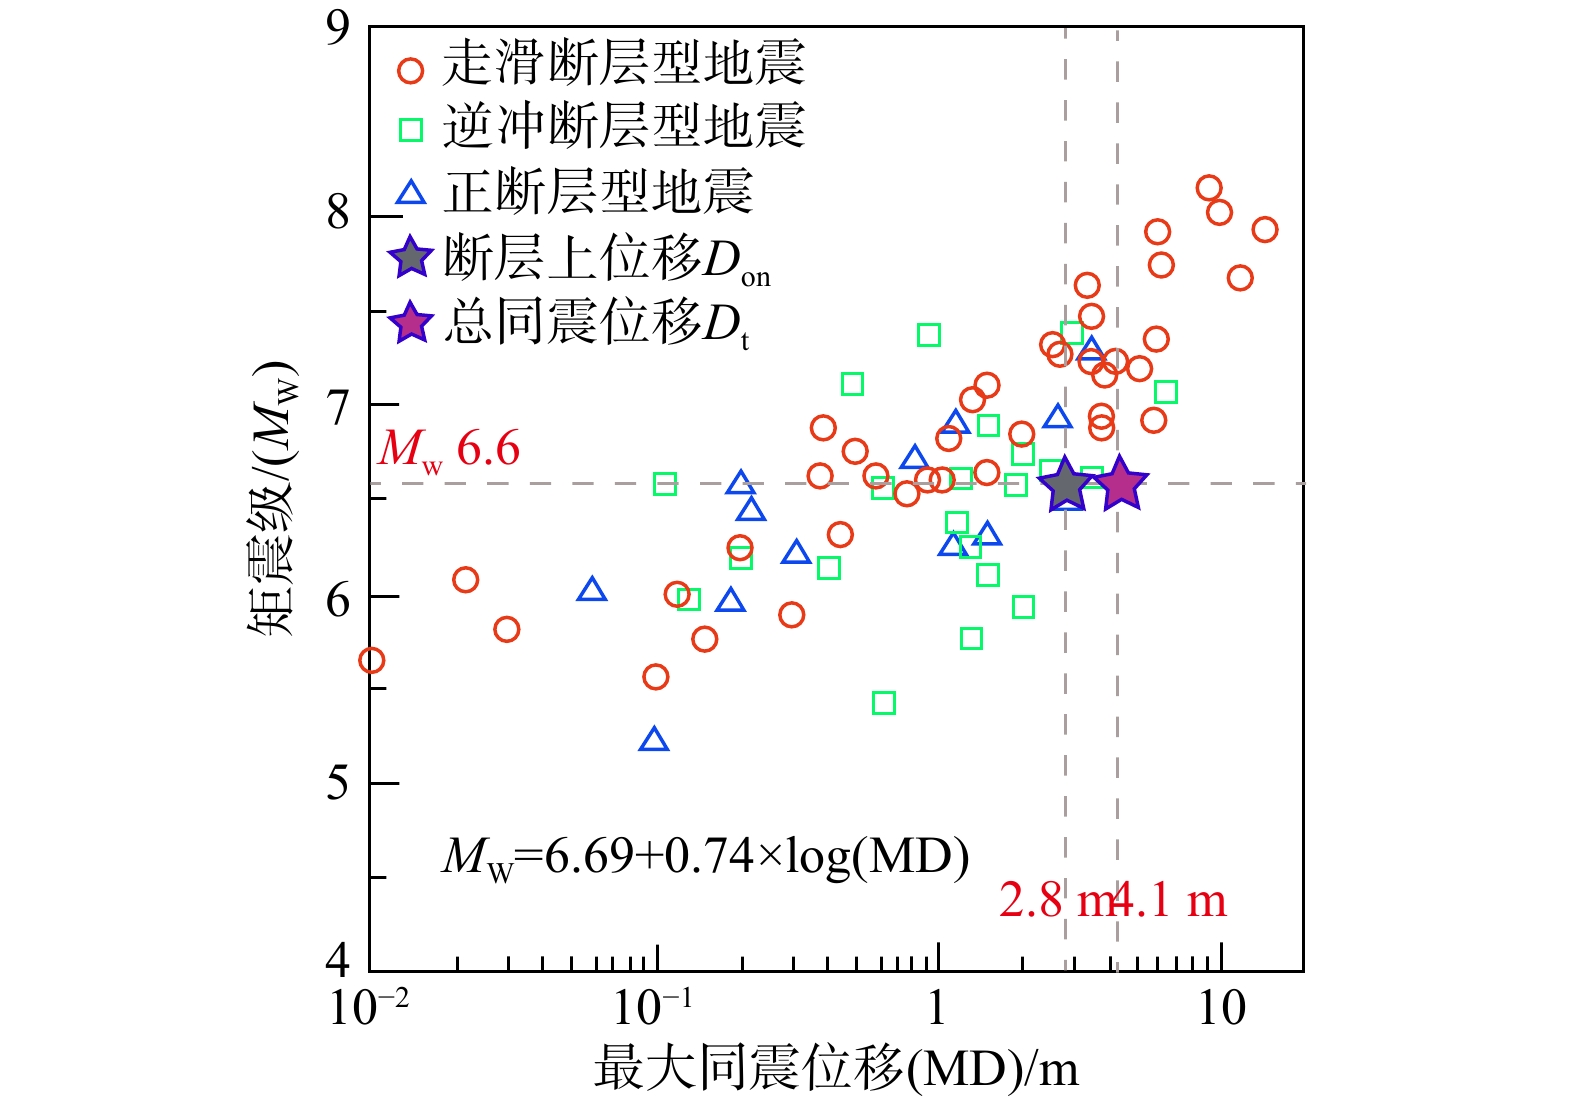
图 11 最大同震位移(MD)与矩震级经验公式图(据Wells and Coppersmith,1994修改)
经验公式中的最大同震位移(MD)即为断层上位移Don
Figure 11. Empirical relationship between maximum coseismic displacement and moment magnitude (modified after Wells and Coppersmith, 1994)
The maximum coseismic displacement in the empirical formula refers to displacement within the visible rupture zone, corresponding to Don in this study
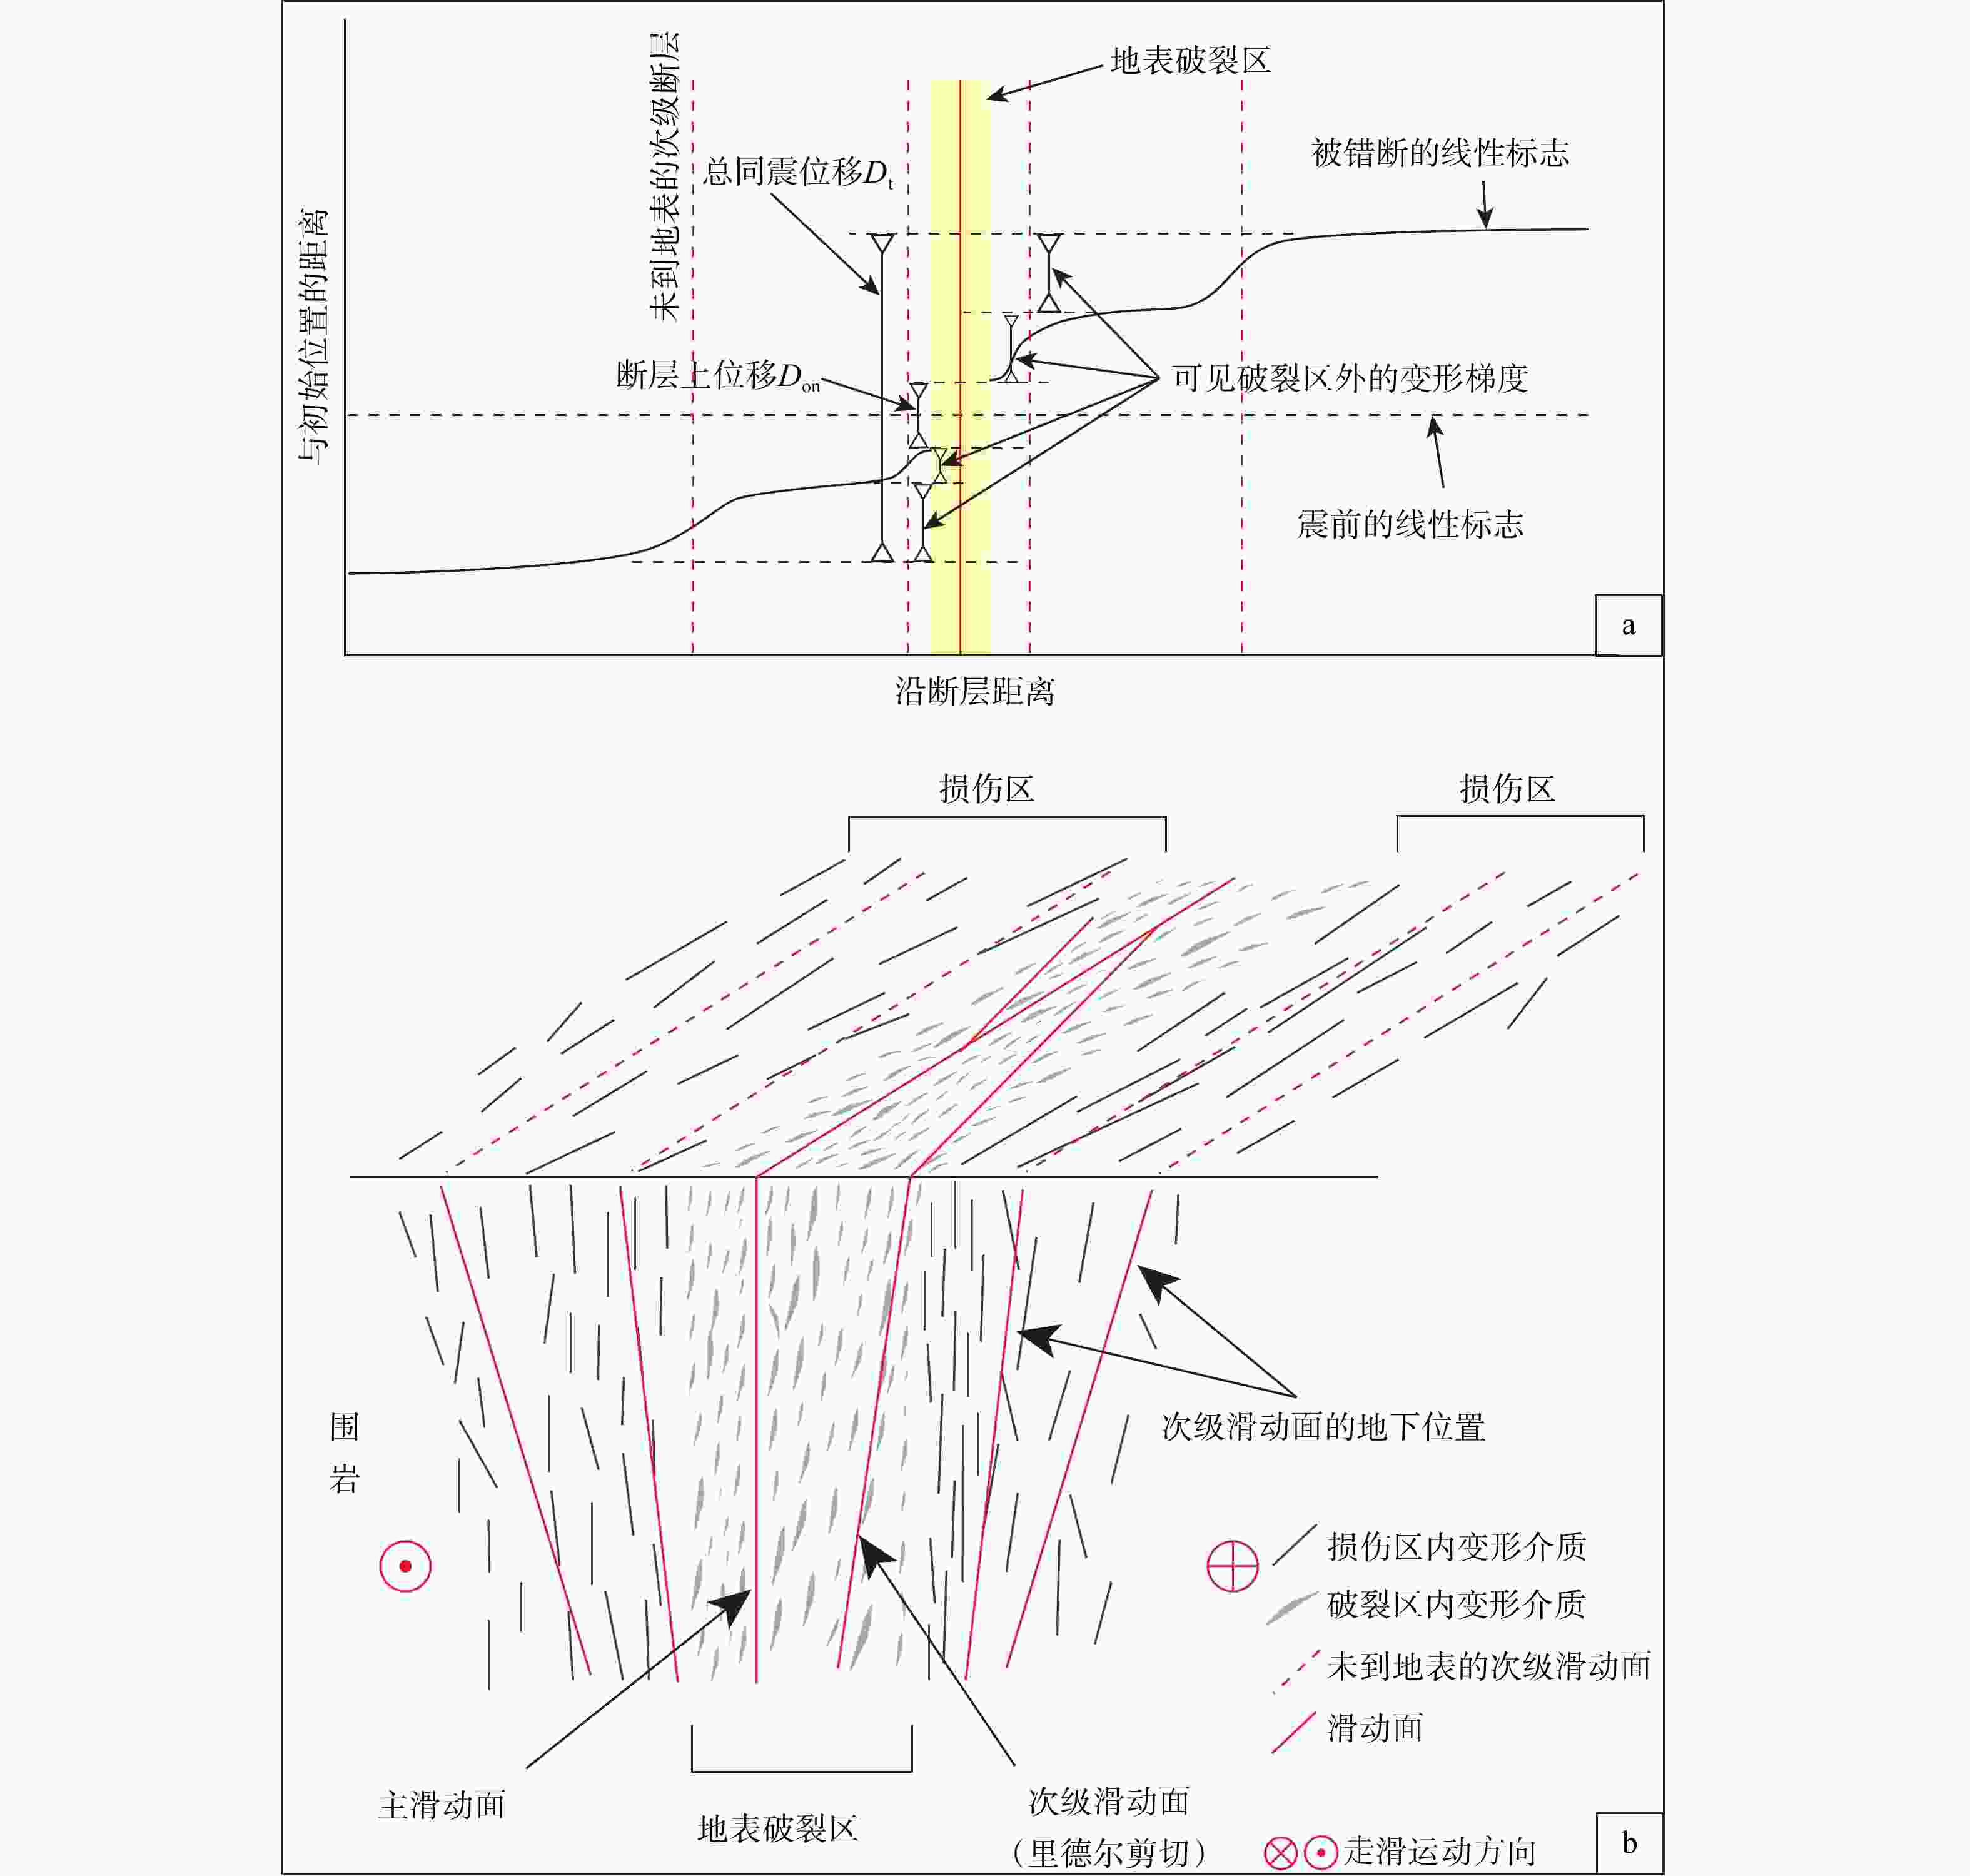
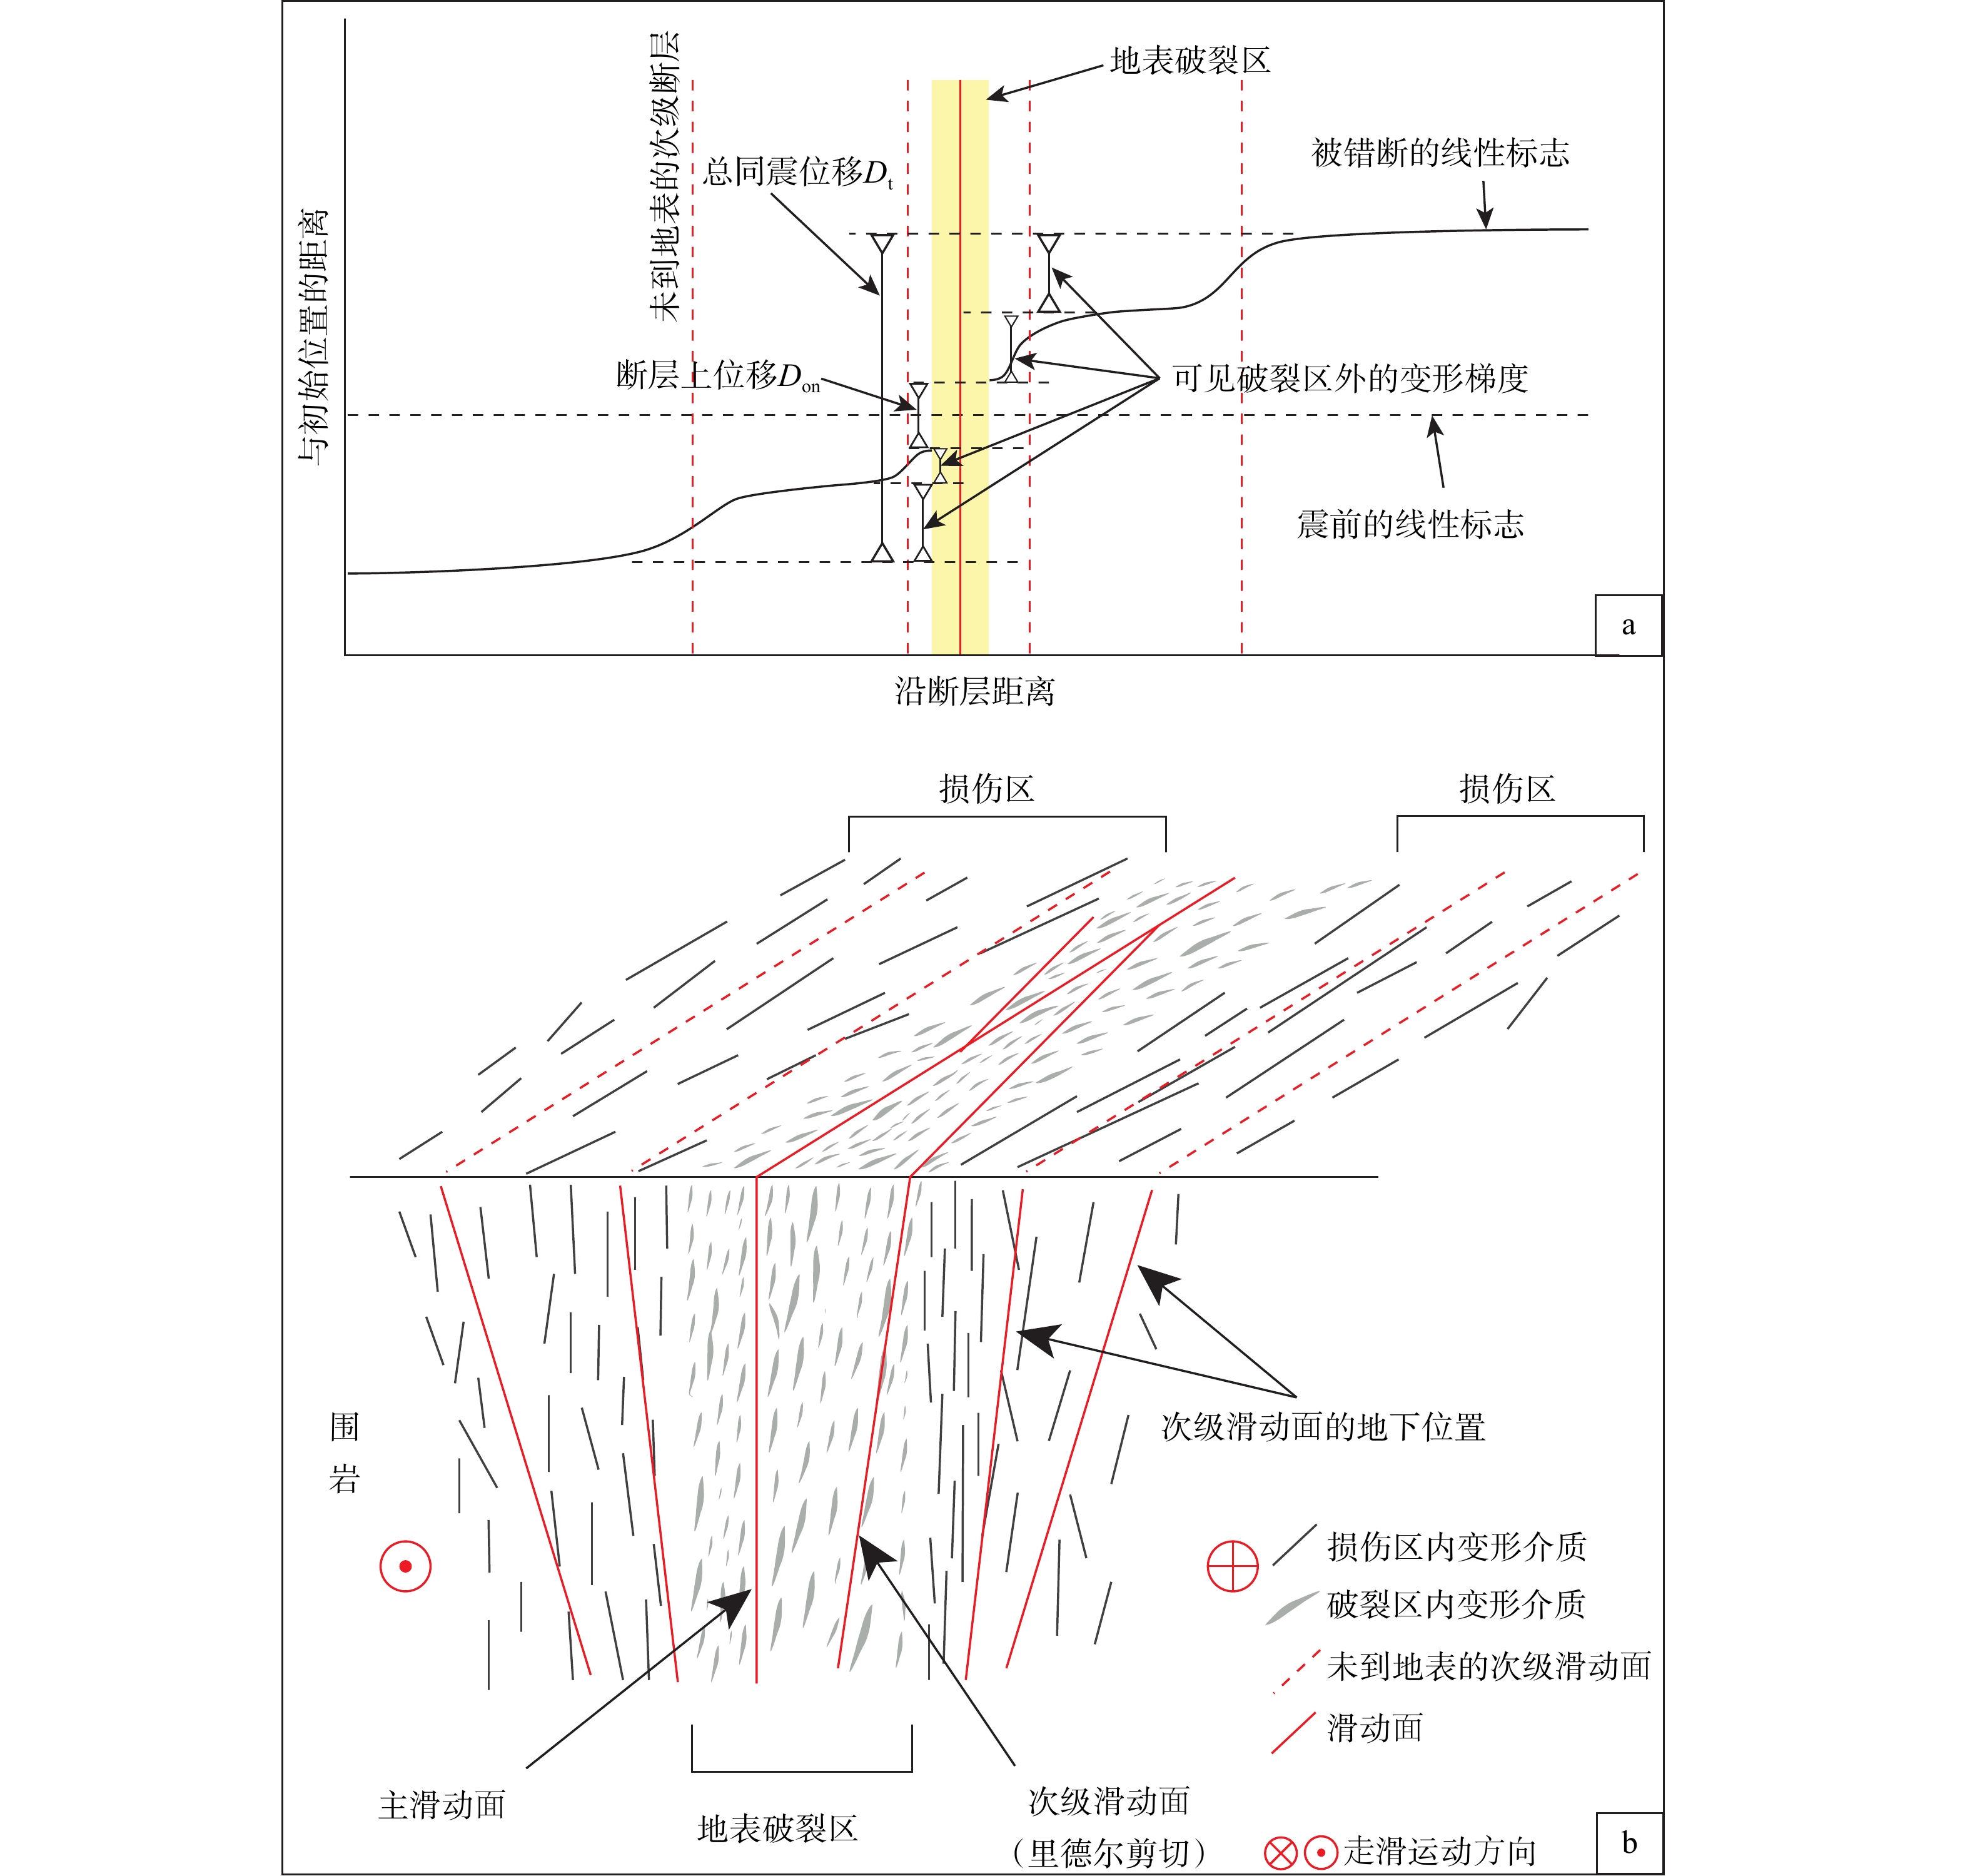
图 12 离断层变形模式图
a—长线性标志的同震位移测量示意(总同震位移包括地表破裂带内及其外部区域的错动);b—断层带结构的块状图模型(断层上位移主要由主滑动面与次级滑动面所吸收;地下次级滑动面的局部化特征与图12a中所示的多个滑动阶跃相对应)
Figure 12. Off-fault deformation model
(a) Schematic diagram showing measurements of the displacement of long linear markers caused by coseismic deformation during an earthquake (The total displacement includes slip within and outside the surface rupture zone); (b) Block model of a fault zone structure (The deformation within the surface rupture zone is primarily accommodated by the principal slip plane and secondary slip planes. The localization characteristics of subsurface secondary slip planes correspond to the multiple slip steps shown in panel a)
表 1 基于围栏测得同震位移沿地表破裂的分布表
Table 1. Distribution of coseismic displacements along the surface rupture measured from fences
围栏编号 坐标位置 距离震中/km 可见破裂带总宽度/m 断层上位移(Don)/m 总同震位移(Dt)/m 离断层变形占比 L1 37.801°N、101.256°E −1.50 100 2.7±0.1 4.0±0.4 33±10% L2 37.802°N、101.253°E −1.80 65 2.8±0.1 4.1±0.8 32±13% L3 37.804°N、101.247°E −2.40 30 1.8±0.2 3.6±0.5 50±11% L4 37.804°N、101.246°E −2.48 10 0.8±0.1 3.3±0.6 76±8% L5 37.804°N、101.245°E −2.58 30 2.2±0.2 3.4±0.7 35±15% L6 37.805°N、101.244°E −2.71 20 2.1±0.1 3.3±0.6 36±13% L7 37.805°N、101.243°E −2.82 20 2.4±0.1 3.3±0.4 27±10% L8 37.805°N、101.241°E −2.91 10 2.1±0.1 3.8±0.4 45±7% L9 37.806°N、101.238°E −3.27 8 1.3±0.1 3.1±0.2 58±8% T1 37.793°N、101.149°E −12.00 20 0.6±0.2 2.1±0.5 71±15% T2 37.793°N、101.143°E −12.50 20 1.2±0.1 1.9±0.9 37±23% T3 37.793°N、101.143°E −12.60 10 0.5±0.2 1.2±0.1 58±20%  下载: 导出CSV
-
[1] ANTOINE S L, KLINGER Y, DELORME A, et al., 2021. Diffuse deformation and surface faulting distribution from submetric image correlation along the 2019 ridgecrest, California, ruptures[J]. Bulletin of the Seismological Society of America, 111(5): 2275-2302. doi: 10.1785/0120210036 [2] ANTOINE S L, KLINGER Y, DELORME A, et al., 2022. Off-fault deformation in regions of complex fault geometries: the 2013, MW7.7, Baluchistan rupture (Pakistan)[J]. Journal of Geophysical Research: Solid Earth, 127(11): e2022JB024480. doi: 10.1029/2022JB024480 [3] AVOUAC J P, TAPPONNIER P, 1993. Kinematic model of active deformation in Central Asia[J]. Geophysical Research Letters, 20(10): 895-898. doi: 10.1029/93GL00128 [4] BARNHART W D, GOLD R D, HOLLINGSWORTH J, 2020. Localized fault-zone dilatancy and surface inelasticity of the 2019 Ridgecrest earthquakes[J]. Nature Geoscience, 13(10): 699-704. doi: 10.1038/s41561-020-0628-8 [5] BEN-ZION Y, SAMMIS C G, 2003. Characterization of fault zones[J]. Pure and Applied Geophysics, 160(3-4): 677-715. [6] BEN-ZION Y, AMPUERO J P, 2009. Seismic radiation from regions sustaining material damage[J]. Geophysical Journal International, 178(3): 1351-1356. doi: 10.1111/j.1365-246X.2009.04285.x [7] BURCHFIEL B C, ZHANG P Z, WANG Y P, et al., 1991. Geology of the Haiyuan fault zone, Ningxia-Hui Autonomous Region, China, and its relation to the evolution of the northeastern margin of the Tibetan Plateau[J]. Tectonics, 10(6): 1091-1110. doi: 10.1029/90TC02685 [8] CHESTER F M, CHESTER J S, 1998. Ultracataclasite structure and friction processes of the Punchbowl fault, San Andreas system, California[J]. Tectonophysics, 295(1-2): 199-221. doi: 10.1016/S0040-1951(98)00121-8 [9] DAY S M, DALGUER L A, LAPUSTA N, et al., 2005. Comparison of finite difference and boundary integral solutions to three-dimensional spontaneous rupture[J]. Journal of Geophysical Research: Solid Earth, 110(B12): B12307. doi: 10.1029/2005jb003813 [10] DOLAN J F, HARAVITCH B D, 2014. How well do surface slip measurements track slip at depth in large strike-slip earthquakes? The importance of fault structural maturity in controlling on-fault slip versus off-fault surface deformation[J]. Earth and Planetary Science Letters, 388: 38-47. doi: 10.1016/j.epsl.2013.11.043 [11] FAULKNER D R, LEWIS A C, RUTTER E H, 2003. On the internal structure and mechanics of large strike-slip fault zones: Field observations of the Carboneras fault in southeastern Spain[J]. Tectonophysics, 367(3-4): 235-251. doi: 10.1016/S0040-1951(03)00134-3 [12] FINZI Y, HEARN E H, BEN-ZION Y, et al., 2009. Structural properties and deformation patterns of evolving strike-slip faults: Numerical simulations incorporating damage rheology[J]. Pure and Applied Geophysics, 166(10-11): 1537-1573. doi: 10.1007/978-3-0346-0138-2_2 [13] GAO F, ZIELKE O, HAN Z J, et al., 2022. Faulted landforms, slip-rate, and tectonic implications of the eastern Lenglongling fault, northeastern Tibetan Plateau[J]. Tectonophysics, 823: 229195. doi: 10.1016/j.tecto.2021.229195 [14] GAUDEMER Y, TAPPONNIER P, MEYER B, et al., 1995. Partitioning of crustal slip between linked, active faults in the eastern Qilian Shan, and evidence for a major seismic gap, the “Tianzhu gap”, on the western Haiyuan Fault, Gansu (China)[J]. Geophysical Journal International, 120(3): 599-645. doi: 10.1111/j.1365-246X.1995.tb01842.x [15] GOLD R D, REITMAN N G, BRIGGS R W, et al., 2015. On-and off-fault deformation associated with the September 2013 MW7.7 Balochistan earthquake: Implications for geologic slip rate measurements[J]. Tectonophysics, 660: 65-78. doi: 10.1016/j.tecto.2015.08.019 [16] GUO P, HAN Z J, MAO Z B, et al., 2019. Paleoearthquakes and rupture behavior of the Lenglongling fault: Implications for seismic hazards of the northeastern margin of the Tibetan Plateau[J]. Journal of Geophysical Research: Solid Earth, 124(2): 1520-1543. doi: 10.1029/2018JB016586 [17] HAN L F, LIU-ZENG J, YAO W Q, et al., 2021. Coseismic slip gradient at the western terminus of the 1920 Haiyuan MW7.9 earthquake[J]. Journal of Structural Geology, 152: 104442. doi: 10.1016/j.jsg.2021.104442 [18] HAN L F, LIU-ZENG J, YAO W Q, et al., 2024. Discontinuous surface ruptures and slip distributions in the epicentral region of the 2021 MW7.4 Maduo earthquake, China[J]. Remote Sensing, 16(7): 1250. doi: 10.3390/rs16071250 [19] HAN L F, YAO W Q, LIU-ZENG J, et al., 2026. Reevaluation of geomorphic offsets along the 1920 Haiyuan earthquake rupture, China: a discussion of uncertainties in slip measurements and COPD analyses using high-resolution topography[J]. Tectonophysics, 922: 231071. doi: 10.1016/j.tecto.2026.231071 [20] HAN N N, ZHANG G H, SHAN X J, et al., 2023. Coseismic surface horizontal deformation of the 2022 MW6.6 Menyuan, Qinghai, China, earthquake from optical pixel correlation of GF‐7 stereo satellite images[J]. Seismological Research Letters, 94(4): 1747-1760. doi: 10.1785/0220220332 [21] HAN S, WU Z H, GAO Y, et al., 2022. Surface rupture investigation of the 2022 Menyuan MS6.9 earthquake, Qinghai, China: Implications for the fault behavior of the Lenglongling fault and regional intense earthquake risk[J]. Journal of Geomechanics, 28(2): 155-168. (in Chinese with English abstract) [22] HUANG C C, ZHANG G H, ZHAO D Z, et al., 2022. Rupture process of the 2022 MW6.6 Menyuan, China, earthquake from joint inversion of accelerogram data and InSAR measurements[J]. Remote Sensing, 14(20): 5104. doi: 10.3390/rs14205104 [23] IGCEA, NBCEA, 1990. Active Haiyuan fault zone monograph[M]. Beijing: Seismological Press. (in Chinese) [24] KING G, NÁBĚLEK J, 1985. Role of fault bends in the initiation and termination of earthquake rupture[J]. Science, 228(4702): 984-987. doi: 10.1126/science.228.4702.984 [25] KLINGER Y, OKUBO K, VALLAGE A, et al., 2018. Earthquake damage patterns resolve complex rupture processes[J]. Geophysical Research Letters, 45(19): 10279-10287. doi: 10.1029/2018gl078842 [26] LASSERRE C, GAUDEMER Y, TAPPONNIER P, et al. , 2002. Fast late Pleistocene slip rate on the Leng Long Ling segment of the Haiyuan fault, Qinghai, China[J]. Journal of Geophysical Research: Solid Earth, 107(B11): ETG 4-1-ETG 4-15. [27] LI J, FANG L H, ZHANG L, et al., 2026. Coseismic rupture and aftershock migration governed by multiple fault geometries: the 2022 MW6.6 Menyuan Earthquake[J]. Seismological Research Letters, 97(2A): 832-844. doi: 10.1785/0220250355 [28] LI K, TAPPONNIER P, XU X W, et al., 2023b. The 2022, MS 6.9 Menyuan earthquake: Surface rupture, Paleozoic suture re-activation, slip-rate and seismic gap along the Haiyuan fault system, NE Tibet[J]. Earth and Planetary Science Letters, 622: 118412. doi: 10.1016/j.epsl.2023.118412 [29] LI Z H, HAN B Q, LIU Z J, et al., 2022. Source parameters and slip distributions of the 2016 and 2022 Menyuan, Qinghai earthquakes constrained by InSAR observations[J]. Geomatics and Information Science of Wuhan University, 47(6): 887-897. (in Chinese with English abstract) [30] LIU J, SIEH K, HAUKSSON E, 2003. A structural interpretation of the aftershock “cloud” of the 1992 MW7.3 Landers earthquake[J]. Bulletin of the Seismological Society of America, 93(3): 1333-1344. doi: 10.1785/0120030146 [31] LIU J H, JÓNSSON S, LI X, et al., 2025. Extensive off-fault damage around the 2023 Kahramanmaraş earthquake surface ruptures[J]. Nature Communications, 16(1): 1286. doi: 10.1038/s41467-025-56466-w [32] LIU X L, XIA T, LIU J, et al., 2022. Distributed characteristics of the surface deformations associated with the 2021 MW7.4 Madoi earthquake, Qinghai, China[J]. Seismology and Geology, 44(2): 461-483. (in Chinese with English abstract) [33] LIU-ZENG J, KLINGER Y, XU X, et al., 2007. Millennial recurrence of large earthquakes on the Haiyuan fault near Songshan, Gansu Province, China[J]. Bulletin of the Seismological Society of America, 97(1B): 14-34. doi: 10.1785/0120050118 [34] LIU-ZENG J, LIU Z J, LIU X L, et al., 2024. Fault orientation trumps fault maturity in controlling coseismic rupture characteristics of the 2021 Maduo earthquake[J]. AGU Advances, 5(2): e2023AV001134 doi: 10.1029/2023AV001134 [35] LYAKHOVSKY V, BEN-ZION Y, 2008. Scaling relations of earthquakes and aseismic deformation in a damage rheology model[J]. Geophysical Journal International, 172(2): 651-662. doi: 10.1111/j.1365-246X.2007.03652.x [36] MILLINER C W D, DOLAN J F, HOLLINGSWORTH J, et al., 2015. Quantifying near-field and off-fault deformation patterns of the 1992 Mw 7.3 Landers earthquake[J]. Geochemistry, Geophysics, Geosystems, 16(5): 1577-1598. doi: 10.1002/2014GC005693 [37] MILLINER C W D, DOLAN J F, HOLLINGSWORTH J, et al., 2016. Comparison of coseismic near-field and off-fault surface deformation patterns of the 1992 MW 7.3 Landers and 1999 MW 7.1 Hector Mine earthquakes: implications for controls on the distribution of surface strain[J]. Geophysical Research Letters, 43(19): 10115-10124. doi: 10.1002/2016gl069841 [38] NELSON M R, JONES C H, 1987. Paleomagnetism and crustal rotations along a shear zone, Las Vegas Range, southern Nevada[J]. Tectonics, 6(1): 13-33. doi: 10.1029/TC006i001p00013 [39] NIU P F, HAN Z J, LI K C, et al., 2023. The 2022 MW6.7 Menyuan earthquake on the northeastern margin of the Tibetan Plateau, China: complex surface ruptures and large slip[J]. Bulletin of the Seismological Society of America, 113(3): 976-996. doi: 10.1785/0120220163 [40] OSKIN M E, ARROWSMITH J R, CORONA A H, et al., 2012. Near-field deformation from the El Mayor–Cucapah earthquake revealed by differential LiDAR[J]. Science, 335(6069): 702-705. doi: 10.1126/science.1213778 [41] PAN J W, LI H B, CHEVALIER M L, et al., 2022. Coseismic surface rupture and seismogenic structure of the 2022 MS6.9 Menyuan earthquake, Qinghai Province, China[J]. Acta Geologica Sinica, 96(1): 215-231. (in Chinese with English abstract) [42] ROCKWELL T K, 2002. Lateral offsets on surveyed cultural features resulting from the 1999 Izmit and Duzce earthquakes, Turkey[J]. Bulletin of the Seismological Society of America, 92(1): 79-94. doi: 10.1785/0120000809 [43] ROCKWELL T K, KLINGER Y, 2013. Surface rupture and slip distribution of the 1940 Imperial Valley earthquake, Imperial Fault, southern California: Implications for rupture segmentation and dynamics[J]. Bulletin of the Seismological Society of America, 103(2A): 629-640. [44] SAMMIS C G, ROSAKIS A J, BHAT H S, 2009. Effects of off-fault damage on earthquake rupture propagation: experimental studies[J]. Pure and Applied Geophysics, 166(10-11): 1629-1648. doi: 10.1007/978-3-0346-0138-2_5 [45] SCHWARTZ D P, COPPERSMITH K J, 1984. Fault behavior and characteristic earthquakes: Examples from the Wasatch and San Andreas fault zones[J]. Journal of Geophysical Research: Solid Earth, 89(B7): 5681-5698. doi: 10.1029/JB089iB07p05681 [46] SCOTT C P, ARROWSMITH J R, NISSEN E, et al., 2018. The M7 2016 Kumamoto, Japan, earthquake: 3-D deformation along the fault and within the damage zone constrained from differential lidar topography[J]. Journal of Geophysical Research: Solid Earth, 123(7): 6138-6155. doi: 10.1029/2018JB015581 [47] SHAO Y X, LIU J, GAO Y P, et al., 2022. Coseismic displacement measurement and distributed deformation characterization: a case of 2021 MW 7.4 Madoi earthquake[J]. Seismology and Geology, 44(2): 506-523. (in Chinese with English abstract) [48] SHI Z Q, BEN-ZION Y, 2006. Dynamic rupture on a bimaterial interface governed by slip-weakening friction[J]. Geophysical Journal International, 165(2): 469-484. doi: 10.1111/j.1365-246X.2006.02853.x [49] STYRON R, PAGANI M, 2020. The GEM global active faults database[J]. Earthquake Spectra, 36(S1): 160-180. doi: 10.1177/8755293020944182 [50] TAPPONNIER P, MOLNAR P, 1977. Active faulting and tectonics in China[J]. Journal of Geophysical Research, 82(20): 2905-2930. doi: 10.1029/JB082i020p02905 [51] TAPPONNIER P, XU Z Q, ROGER F, et al., 2001. Oblique stepwise rise and growth of the Tibet Plateau[J]. Science, 294(5547): 1671-1677. doi: 10.1126/science.105978 [52] TITUS S J, DYSON M, DEMETS C, et al., 2011. Geologic versus geodetic deformation adjacent to the San Andreas fault, central California[J]. Geological Society of America Bulletin, 123(5-6): 794-820. doi: 10.1130/B30150.1 [53] VALLAGE A, KLINGER Y, LACASSIN R, et al., 2016. Geological structures control on earthquake ruptures: the MW7.7, 2013, Balochistan earthquake, Pakistan[J]. Geophysical Research Letters, 43(19): 10155-10163. doi: 10.1002/2016gl070418 [54] VIDALE J E, LI Y G, 2003. Damage to the shallow Landers fault from the nearby Hector Mine earthquake[J]. Nature, 421(6922): 524-526. doi: 10.1038/nature01354 [55] VISAGE S, SOULOUMIAC P, CUBAS N, et al., 2023. Evolution of the off-fault deformation of strike-slip faults in a sand-box experiment[J]. Tectonophysics, 847: 229704. doi: 10.1016/j.tecto.2023.229704 [56] WANG H, LIU-ZENG J, NG A H M, et al., 2017. Sentinel-1 observations of the 2016 Menyuan earthquake: a buried reverse event linked to the left-lateral Haiyuan fault[J]. International Journal of Applied Earth Observation and Geoinformation, 61: 14-21. doi: 10.1016/j.jag.2017.04.011 [57] WELLS D L, COPPERSMITH K J, 1994. New empirical relationships among magnitude, rupture length, rupture width, rupture area, and surface displacement[J]. Bulletin of the Seismological Society of America, 84(4): 974-1002. doi: 10.1785/BSSA0840040974 [58] WEN Y M, YUAN D Y, XIE H, et al., 2023. Typical fine structure and seismogenic mechanism analysis of the surface rupture of the 2022 Menyuan MW 6.7 earthquake[J]. Remote Sensing, 15(18): 4375. doi: 10.3390/rs15184375 [59] WESNOUSKY S G, 1988. Seismological and structural evolution of strike-slip faults[J]. Nature, 335(6188): 340-343. doi: 10.1038/335340a0 [60] WESNOUSKY S G, 2006. Predicting the endpoints of earthquake ruptures[J]. Nature, 444(7117): 358-360. doi: 10.1038/nature05275 [61] WESNOUSKY S G, 2008. Displacement and geometrical characteristics of earthquake surface ruptures: issues and implications for seismic-hazard analysis and the process of earthquake rupture[J]. Bulletin of the Seismological Society of America, 98(4): 1609-1632. doi: 10.1785/0120070111 [62] XU D Y, LI Z B, ZHANG Z G, et al., 2024. The 2022 MW 6.6 Menyuan earthquake: an early-terminated runaway rupture by the complex fault geometry[J]. Earth and Planetary Science Letters, 638: 118746. doi: 10.1016/j.epsl.2024.118746 [63] YAO W Q, LIU-ZENG J, KLINGER Y, et al., 2022. Late Quaternary slip rate of the Zihong Shan branch and its implications for strain partitioning along the Haiyuan fault, northeastern Tibetan Plateau[J]. Journal of Geophysical Research: Solid Earth, 127(5): e2021JB023162. doi: 10.1029/2021JB023162 [64] YAO W Q, WANG Z J, LIU J, et al., 2022. Discussion on coseismic surface rupture length of the 2021 MW7.4 Madoi earthquake, Qinghai, China[J]. Seismology and Geology, 44(2): 541-559. (in Chinese with English abstract) [65] YAO W Q, LIU-ZENG J, SHI X H, et al., 2024. Rupture branching, propagation, and termination at the eastern end of the 2021 MW 7.4 Maduo earthquake, northern Tibetan plateau[J]. Tectonophysics, 876: 230262. doi: 10.1016/j.tecto.2024.230262 [66] YUAN D Y, XIE H, SU R H, et al., 2023. Characteristics of co-seismic surface rupture zone of Menyuan MS6.9 earthquake in Qinghai Province on January 8, 2022 and seismogenic mechanism[J]. Chinese Journal of Geophysics, 66(1): 229-244. (in Chinese with English abstract) [67] ZHANG P Z, SHEN Z K, WANG M, et al., 2004. Continuous deformation of the Tibetan Plateau from global positioning system data[J]. Geology, 32(9): 809-812. doi: 10.1130/G20554.1 [68] ZHAO Q, JIANG F Y, ZHU L Y, et al., 2023. Synthetic aperture radar interferometry–based coseismic deformation and slip distribution of the 2022 Menyuan MS6.9 earthquake in Qinghai, China[J]. Geodesy and Geodynamics, 14(6): 541-550. doi: 10.1016/j.geog.2023.07.004 [69] ZHU L Y, JI L Y, LIU C J, et al., 2022. The 8 January 2022, Menyuan earthquake in Qinghai, China: a representative event in the Qilian-Haiyuan fault zone observed using Sentinel-1 SAR images[J]. Remote Sensing, 14(23): 6078. doi: 10.3390/rs14236078 [70] ZINKE R, HOLLINGSWORTH J, DOLAN J F, 2014. Surface slip and off-fault deformation patterns in the 2013 Mw 7.7 Balochistan, Pakistan earthquake: Implications for controls on the distribution of near-surface coseismic slip[J]. Geochemistry, Geophysics, Geosystems, 15(12): 5034-5050. doi: 10.1002/2014GC005538 [71] 国家地震局地质研究所, 宁夏回族自治区地震局, 1990. 海原活动断裂带[M]. 北京: 地震出版社. [72] 韩帅, 吴中海, 高扬, 等, 2022. 2022年1月8日青海门源MS 6.9地震地表破裂考察的初步结果及对冷龙岭断裂活动行为和区域强震危险性的启示[J]. 地质力学学报, 28(2): 155-168. doi: 10.12090/j.issn.1006-6616.2022013 [73] 李振洪, 韩炳权, 刘振江, 等, 2022. InSAR数据约束下2016年和2022年青海门源地震震源参数及其滑动分布[J]. 武汉大学学报(信息科学版), 47(6): 887-897. doi: 10.13203/j.whugis20220037 [74] 刘小利, 夏涛, 刘静, 等, 2022. 2021年青海玛多MW7.4地震分布式同震地表裂缝特征[J]. 地震地质, 44(2): 461-483. [75] 潘家伟, 李海兵, CHEVALIER M L, 等, 2022. 2022年青海门源MS 6.9地震地表破裂带及发震构造研究[J]. 地质学报, 96(1): 215-231. doi: 10.3969/j.issn.0001-5717.2022.01.018 [76] 邵延秀, 刘静, 高云鹏, 等, 2022. 同震地表破裂的位移测量与弥散变形分析: 以2021年青海玛多MW7.4地震为例[J]. 地震地质, 44(2): 506-523. [77] 姚文倩, 王子君, 刘静, 等, 2022. 2021年青海玛多MW7.4地震同震地表破裂长度的讨论[J]. 地震地质, 44(2): 541-559. doi: 10.3969/j.issn.0253-4967.2022.02.016 [78] 袁道阳, 谢虹, 苏瑞欢, 等, 2023. 2022年1月8日青海门源MS6.9地震地表破裂带特征与发震机制[J]. 地球物理学报, 66(1): 229-244. -

 下载:
下载:





计量
- 文章访问数: 447
- HTML全文浏览量: 147
- PDF下载量: 147
- 被引次数: 0
