


Numerical simulation analysis of seismically triggered load and ball-and-pillow structures in the lacustrine sediment
-
摘要: 湖相沉积中地震成因的软沉积变形构造,为构造活动区古地震事件研究提供了可靠的地层记录。负载与球−枕构造作为常见的变形类型,通常由不同沉积层反密度差所引发的重力失稳所致,但其形成机制及与地震强度之间的量化关系仍缺乏明确阐释。文章采用FLUENT多相流数值模拟方法,反演了在不同地震加速度(0.125g、0.25g、0.5g和0.8g)及不同物理性质(密度、动力黏度和层厚)条件下饱和砂−黏土层中负载与球−枕构造的形成过程,探讨了沉积层物理性质对此类变形构造发育的影响及其与地震强度之间的关系。模拟结果表明:地震加速度越大,砂−黏土层界面越早出现负载与火焰构造,且由小型负载构造逐渐发展为较大规模的负载与球−枕构造;在相同地震加速度条件下,上覆砂层和下伏黏土层的密度差越大、动力黏度差越小、上覆砂层越厚,负载与球−枕构造的变形程度和规模也更显著。数值模拟得到的负载与球−枕构造形态与塔什库尔干湖相沉积层中野外观测案例高度一致,既验证了其力学机制,也为软沉积变形构造与古地震研究提供了新的技术途径和直观依据。Abstract:
Objective Seismically triggered soft-sediment deformation structures (SSDSs) in the lacustrine sediments serve as reliable stratigraphic records for studying paleoearthquake events in tectonically active regions. Load and ball-and-pillow structures, as common types of SSDSs, are generally attributed to gravitational instability caused by an inverse density gradient between adjacent sedimentary layers. However, their formation mechanisms and the quantitative relationship between their development and seismic intensity remain poorly constrained. Methods This study employs the multiphase-flow numerical simulation approach implemented in ANSYS Fluent to simulate the formation of load and ball-and-pillow structures in saturated sand–clay layers under different peak ground accelerations (PGAs; 0.125g, 0.25g, 0.5g, and 0.8g) and varying physical properties, including density, dynamic viscosity and layer thicknesses). The effects of sediment physical properties on the development of these deformation structures and their relationship with seismic intensity were investigated. Results The results show that as the PGA increases, load and flame structures develop earlier at the sand–clay interface and progressively evolve from small load structures into larger-scale load and ball-and-pillow structures. Under the same PGA, a larger density contrast, a smaller dynamic viscosity contrast, and a thicker overlying sand layer result in greater deformation and larger-scale development of load and ball-and-pillow structures. Conclusions The morphologies of the load and ball-and-pillow structures produced by the numerical simulations are highly consistent with those observed in lacustrine sediments in the Tashkorgan area. This agreement supports the proposed mechanical mechanism of their formation and provides a quantitative basis for understanding the development of SSDSs under different seismic and sedimentary conditions. Significance This finding verifies the seismic trigger of SSDSs in this region and provides a new technological insight into the study of SSDSs and paleoearthquakes. -
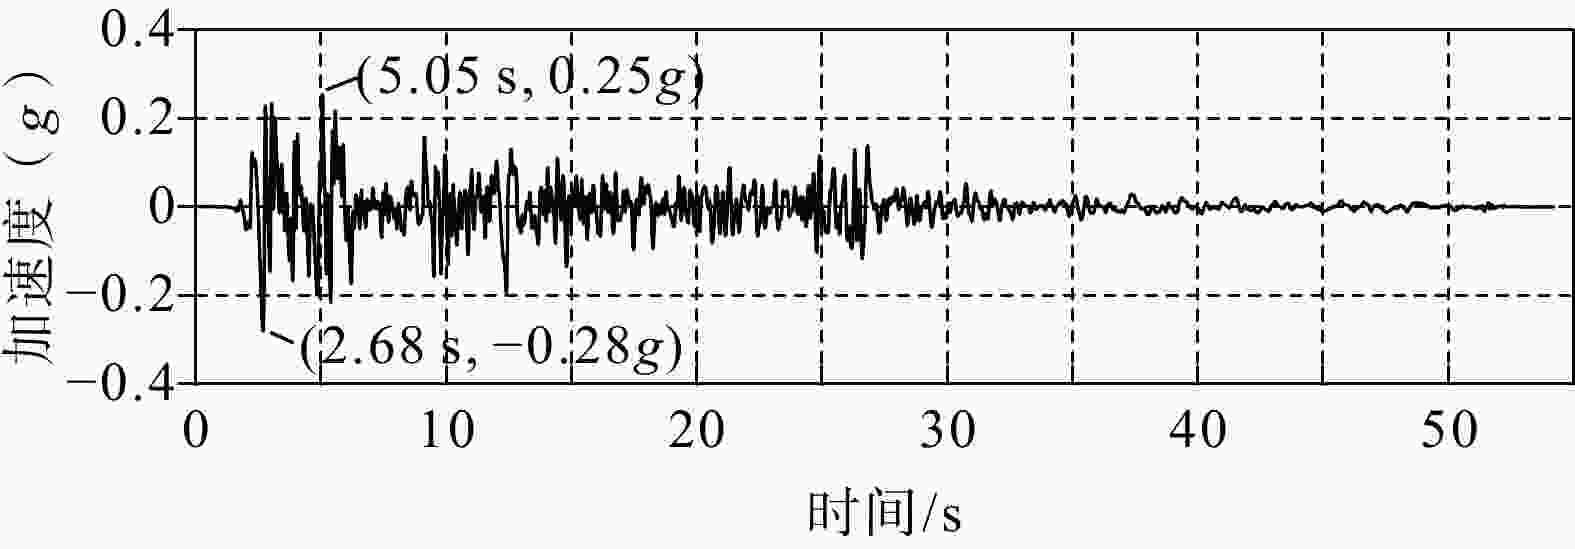
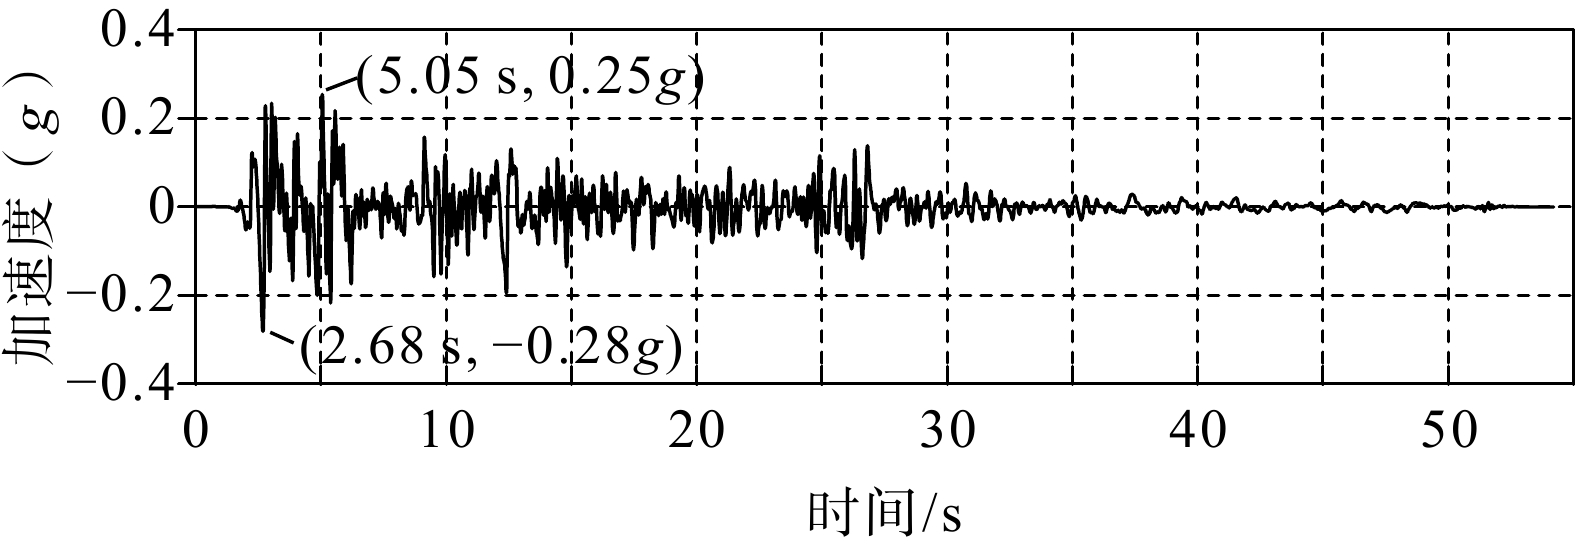
图 1 El Centro地震波加速度时程曲线
g—重力加速度,9.81 m/s2
Figure 1. Acceleration time history of the El Centro earthquake
g–gravitational acceleration,9.81 m/s2
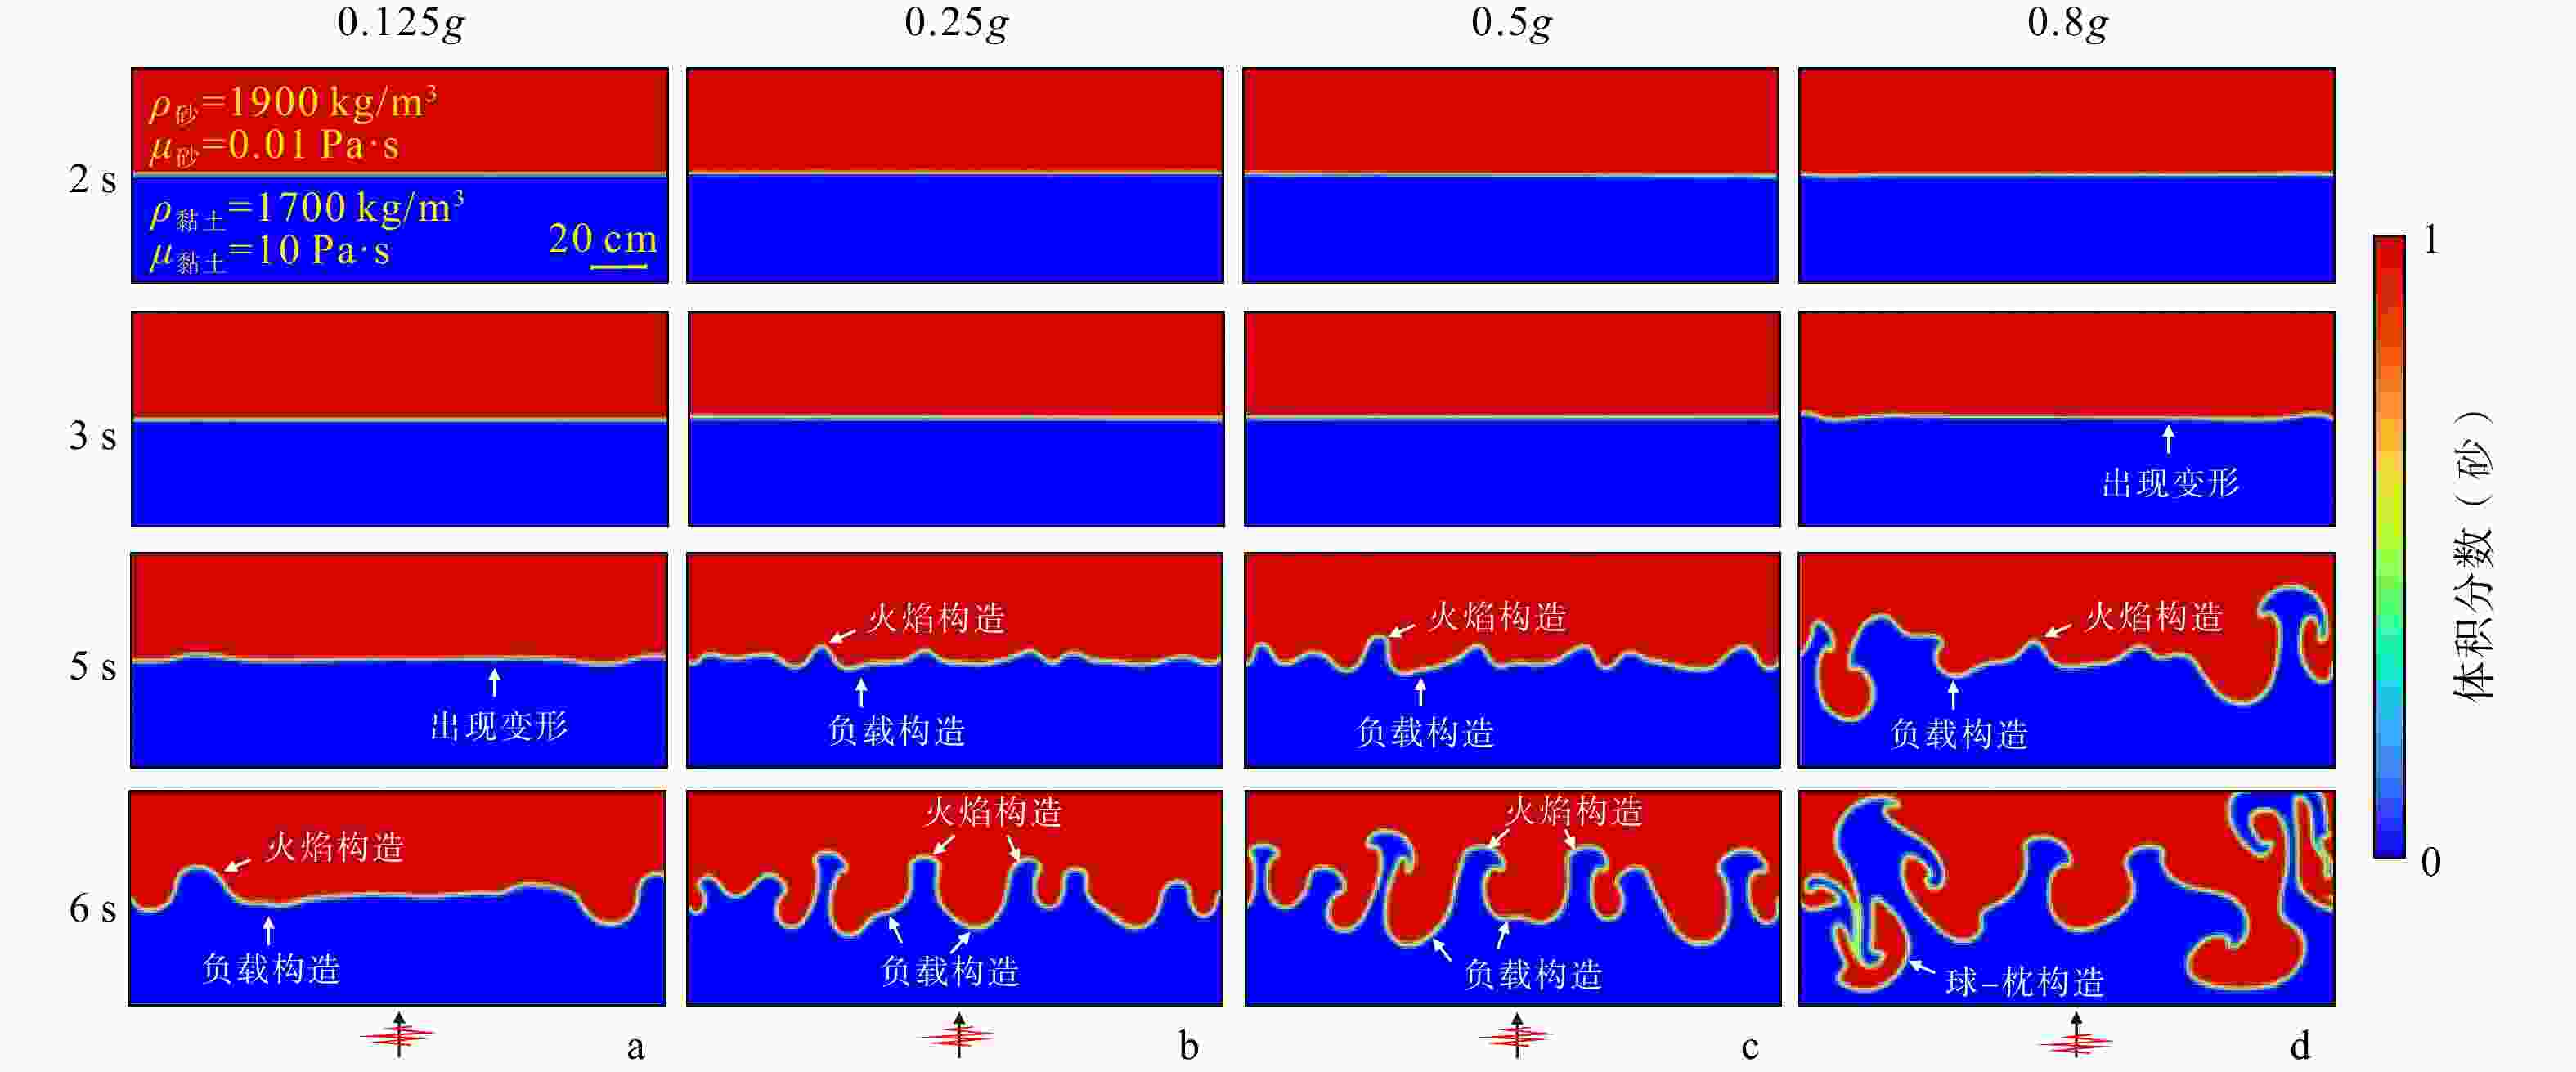
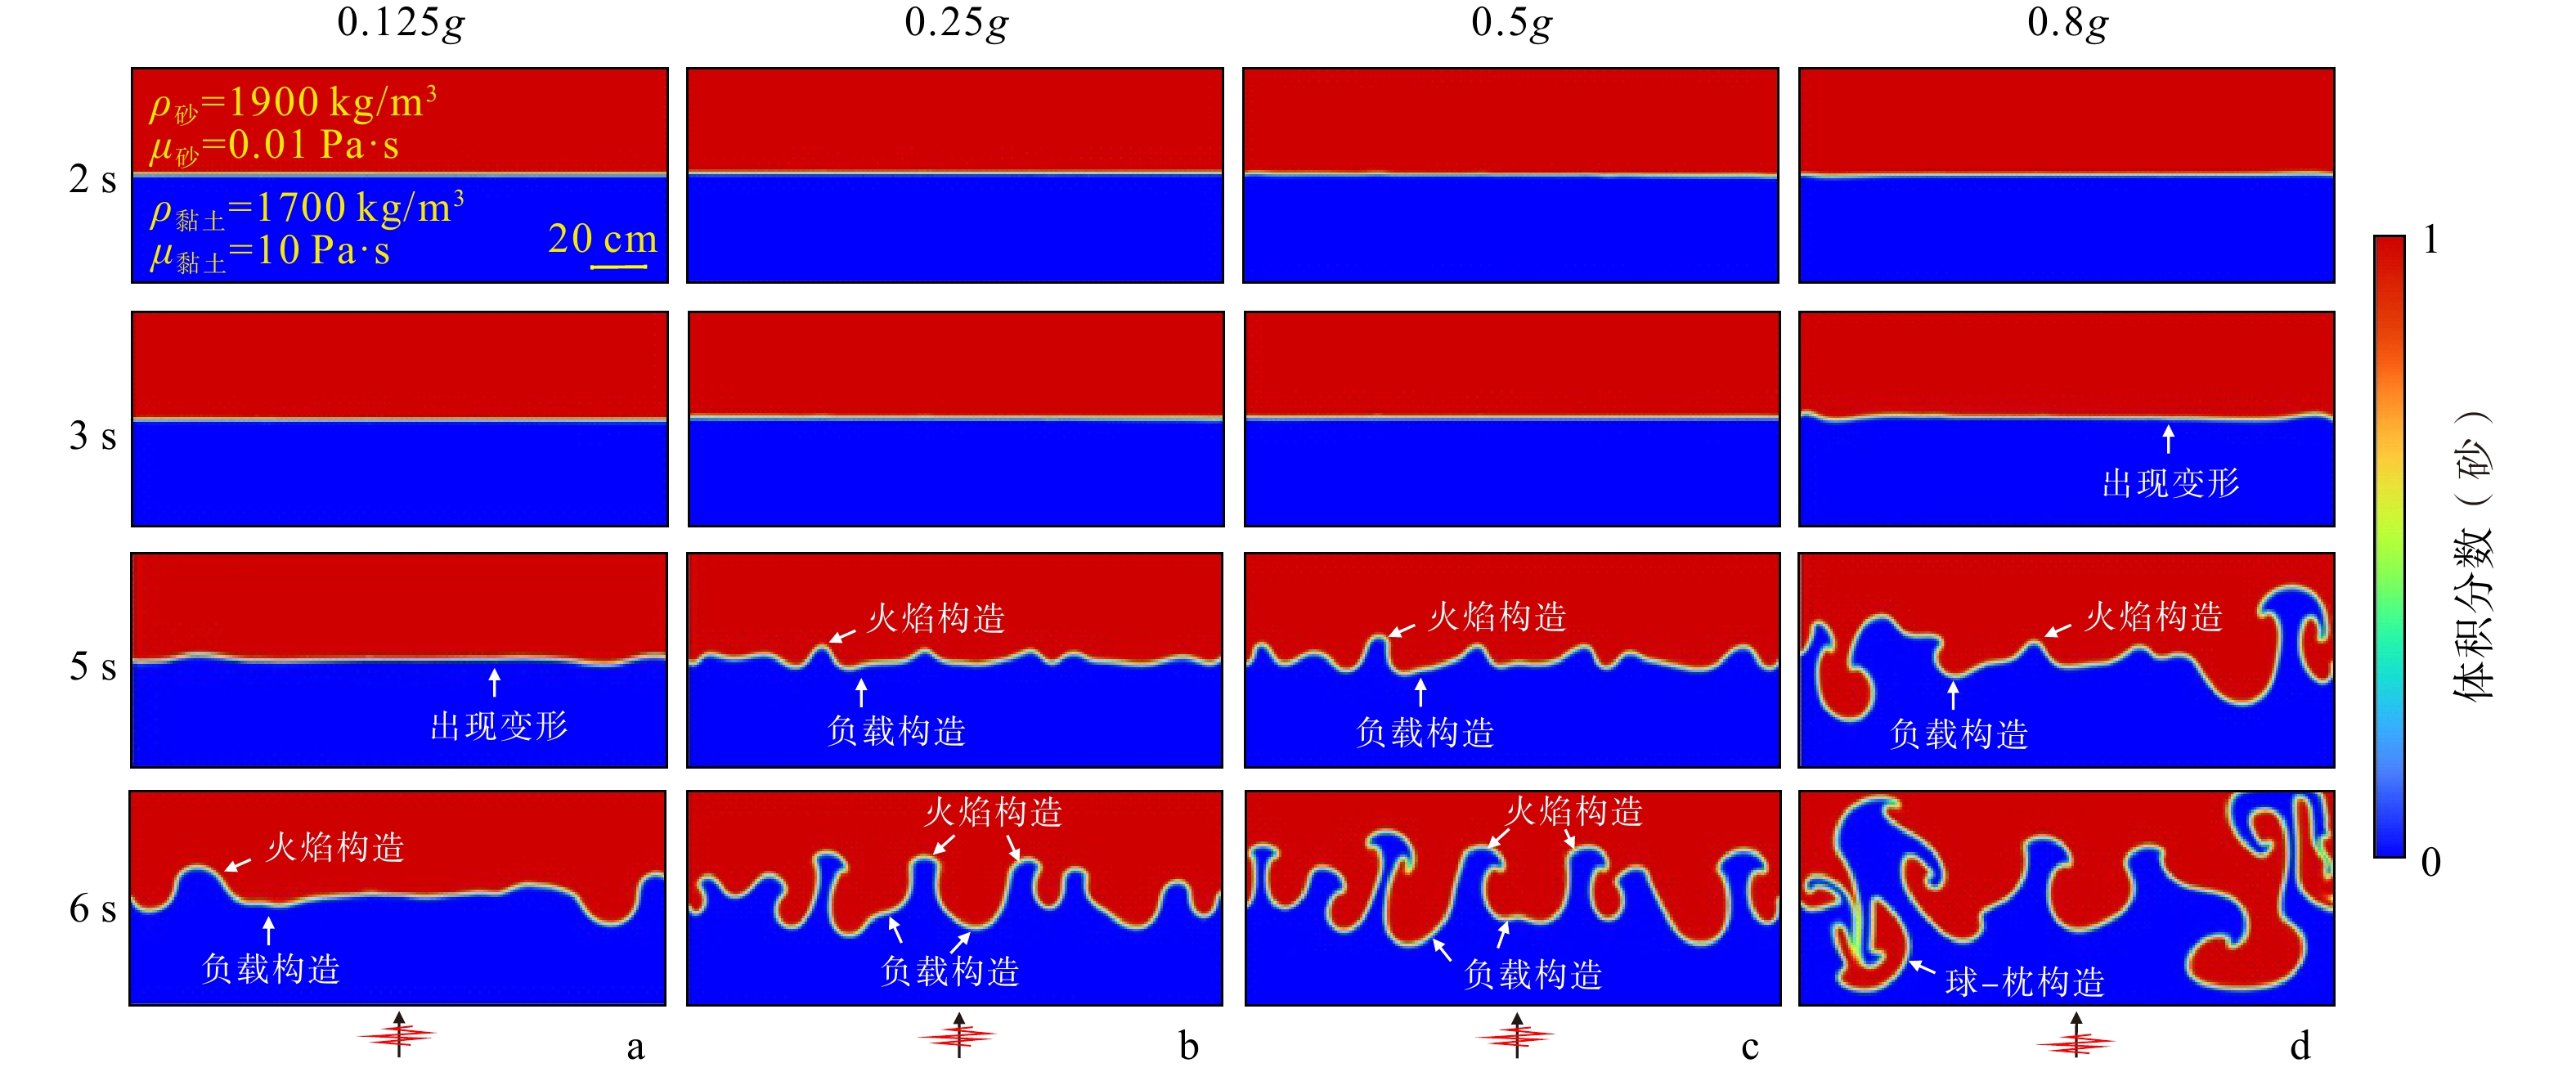
图 2 不同地震峰值加速度作用下砂−黏土层在2 s、3 s、5 s和6 s时刻的变形特征
g—重力加速度,9.81 m/s2;ρ—流体混合物的密度;μ—流体混合物的动力黏度;图底箭头为地震波输入方向a—地震峰值加速度为0.125g;b—地震峰值加速度为0.25g;c—地震峰值加速度为0.5g;d—地震峰值加速度为0.8g
Figure 2. Deformation characteristics of the sand–clay layer at 2, 3, 5, and 6 s under different peak ground accelerations
(a) Peak ground acceleration (PGA) of 0.125g;(b) PGA of 0.25g;(c) PGA of 0.5g;(d) PGA of 0.8gg–gravitational acceleration,9.81 m/s2; ρ–density of the fluid mixture; μ–dynamic viscosity of the fluid mixture. The arrows at the bottom of subfigures indicate the directions of seismic-wave input.
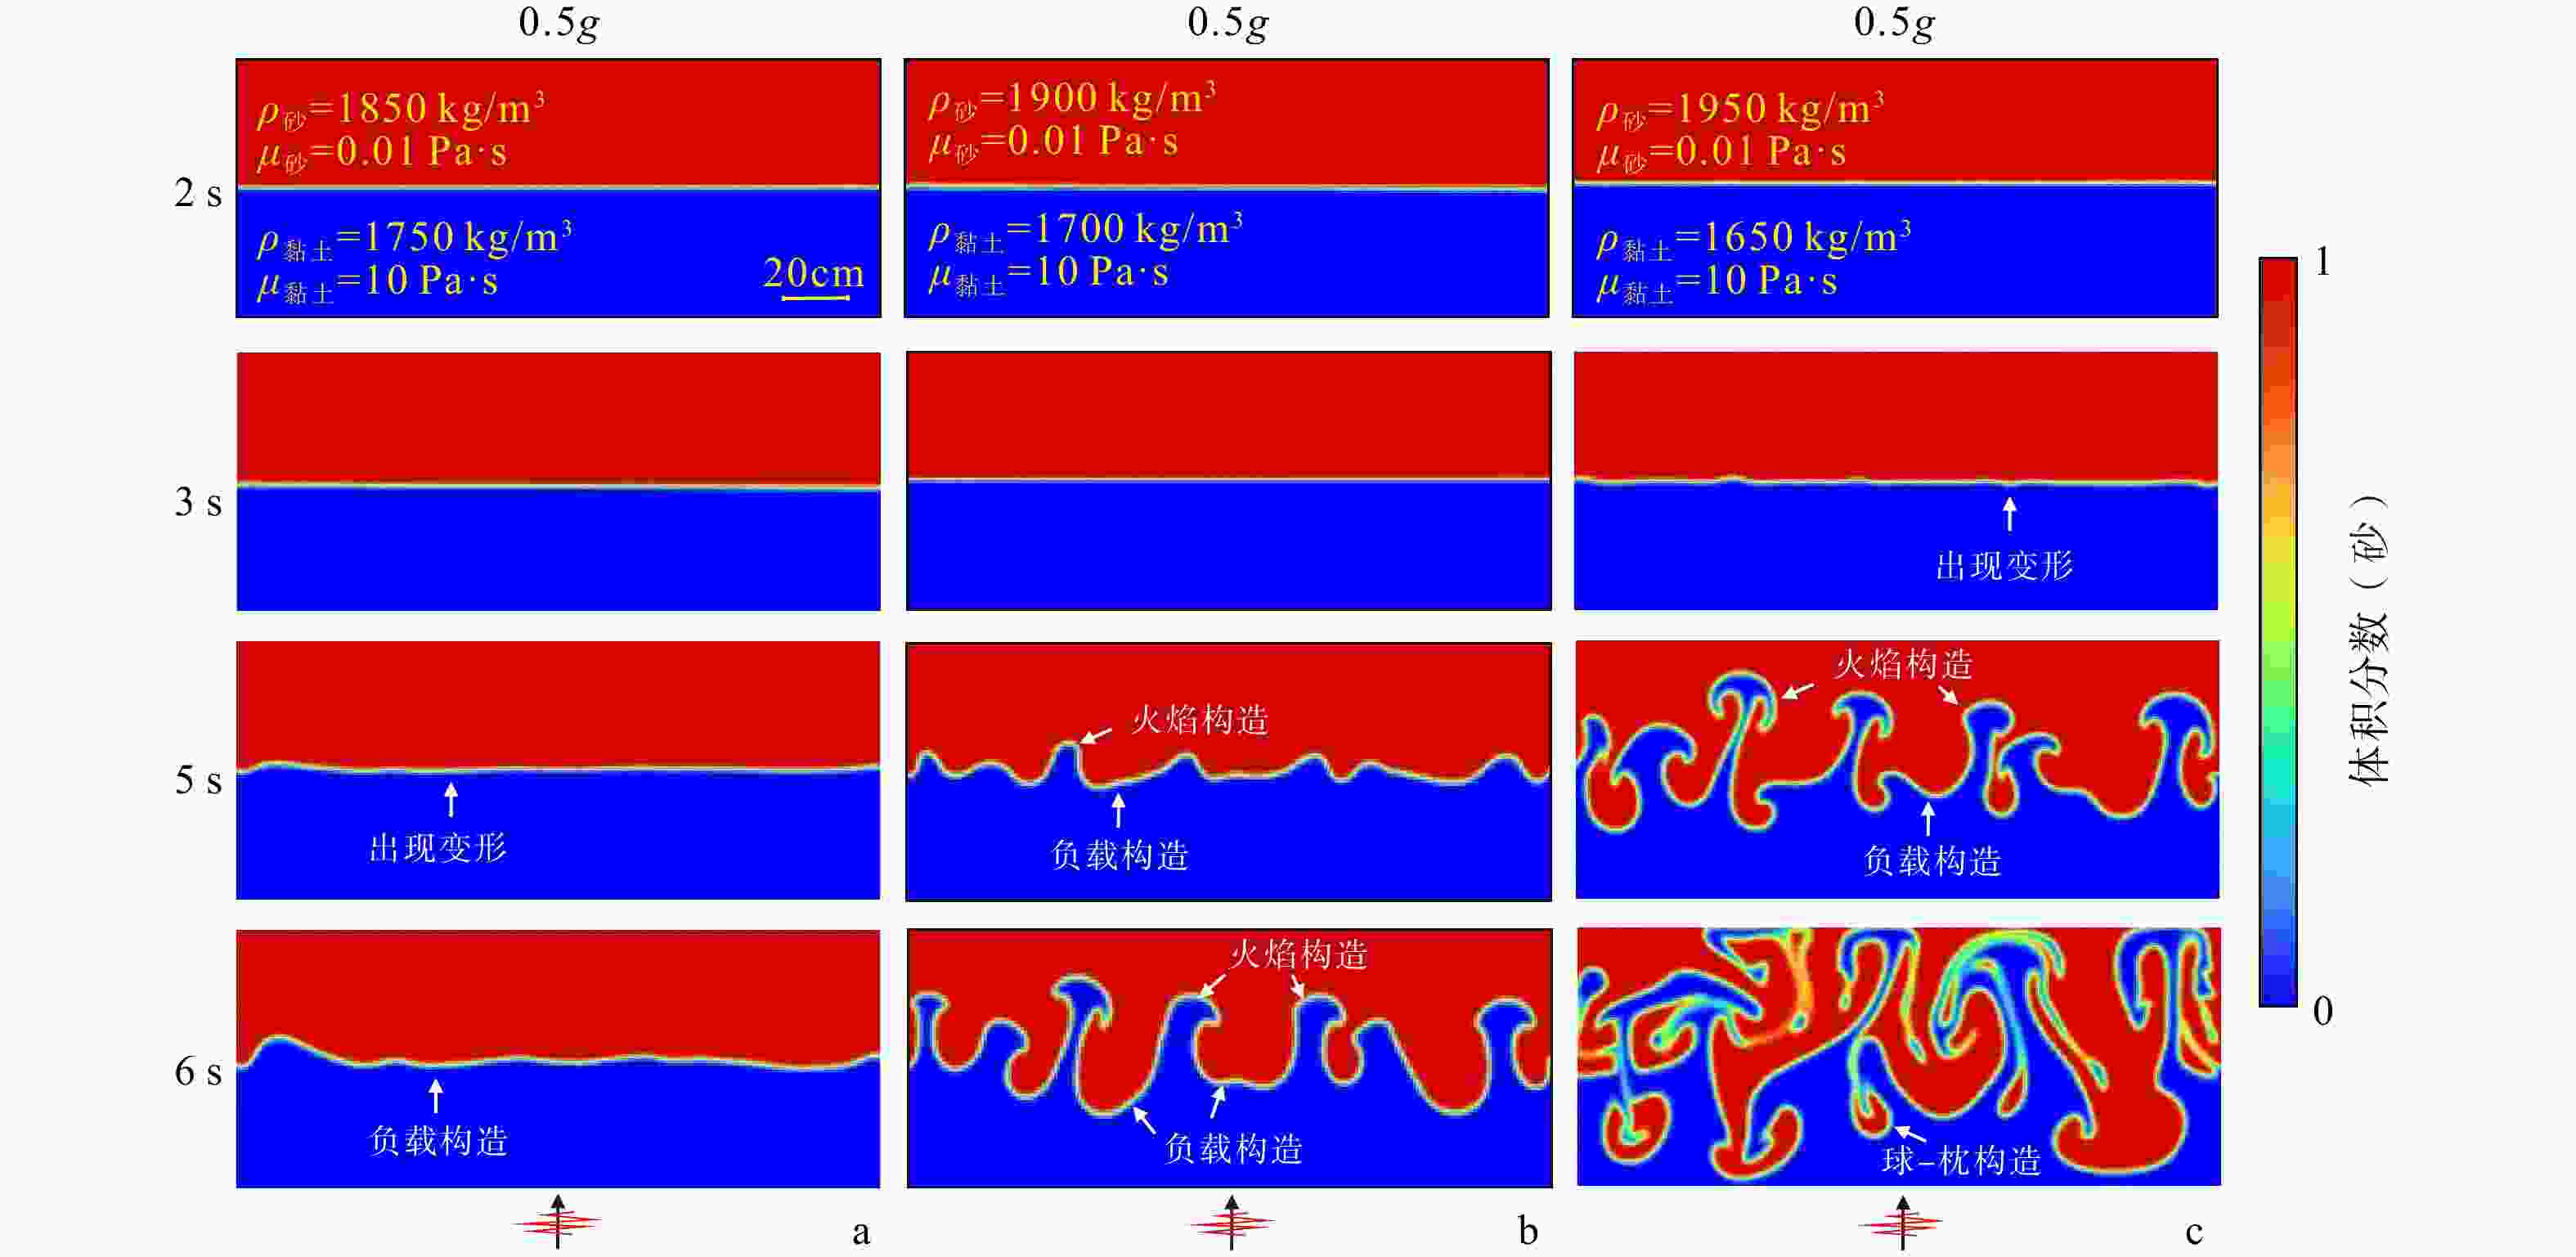
图 3 不同密度差(Δρ)砂−黏土层在2 s、3 s 、5 s和6 s时刻的变形特征
g—重力加速度,9.81 m/s2;ρ—流体混合物的密度;μ—流体混合物的动力黏度;图底箭头为地震波输入方向a—Δρ为100 kg/m3;b—Δρ为200 kg/m3;c—Δρ为300 kg/m3
Figure 3. Deformation characteristics of the sand–clay layer at 2, 3, 5, and 6 s under different density contrasts (Δρ)
(a) Δρ of 100 kg/m3;(b) Δρ of 200 kg/m3;(c) Δρ of 300 kg/m3g–gravitational acceleration,9.81 m/s2; ρ–density of the fluid mixture; μ–dynamic viscosity of the fluid mixture. The arrows at the bottom of subfigures indicate the directions of seismic-wave input.
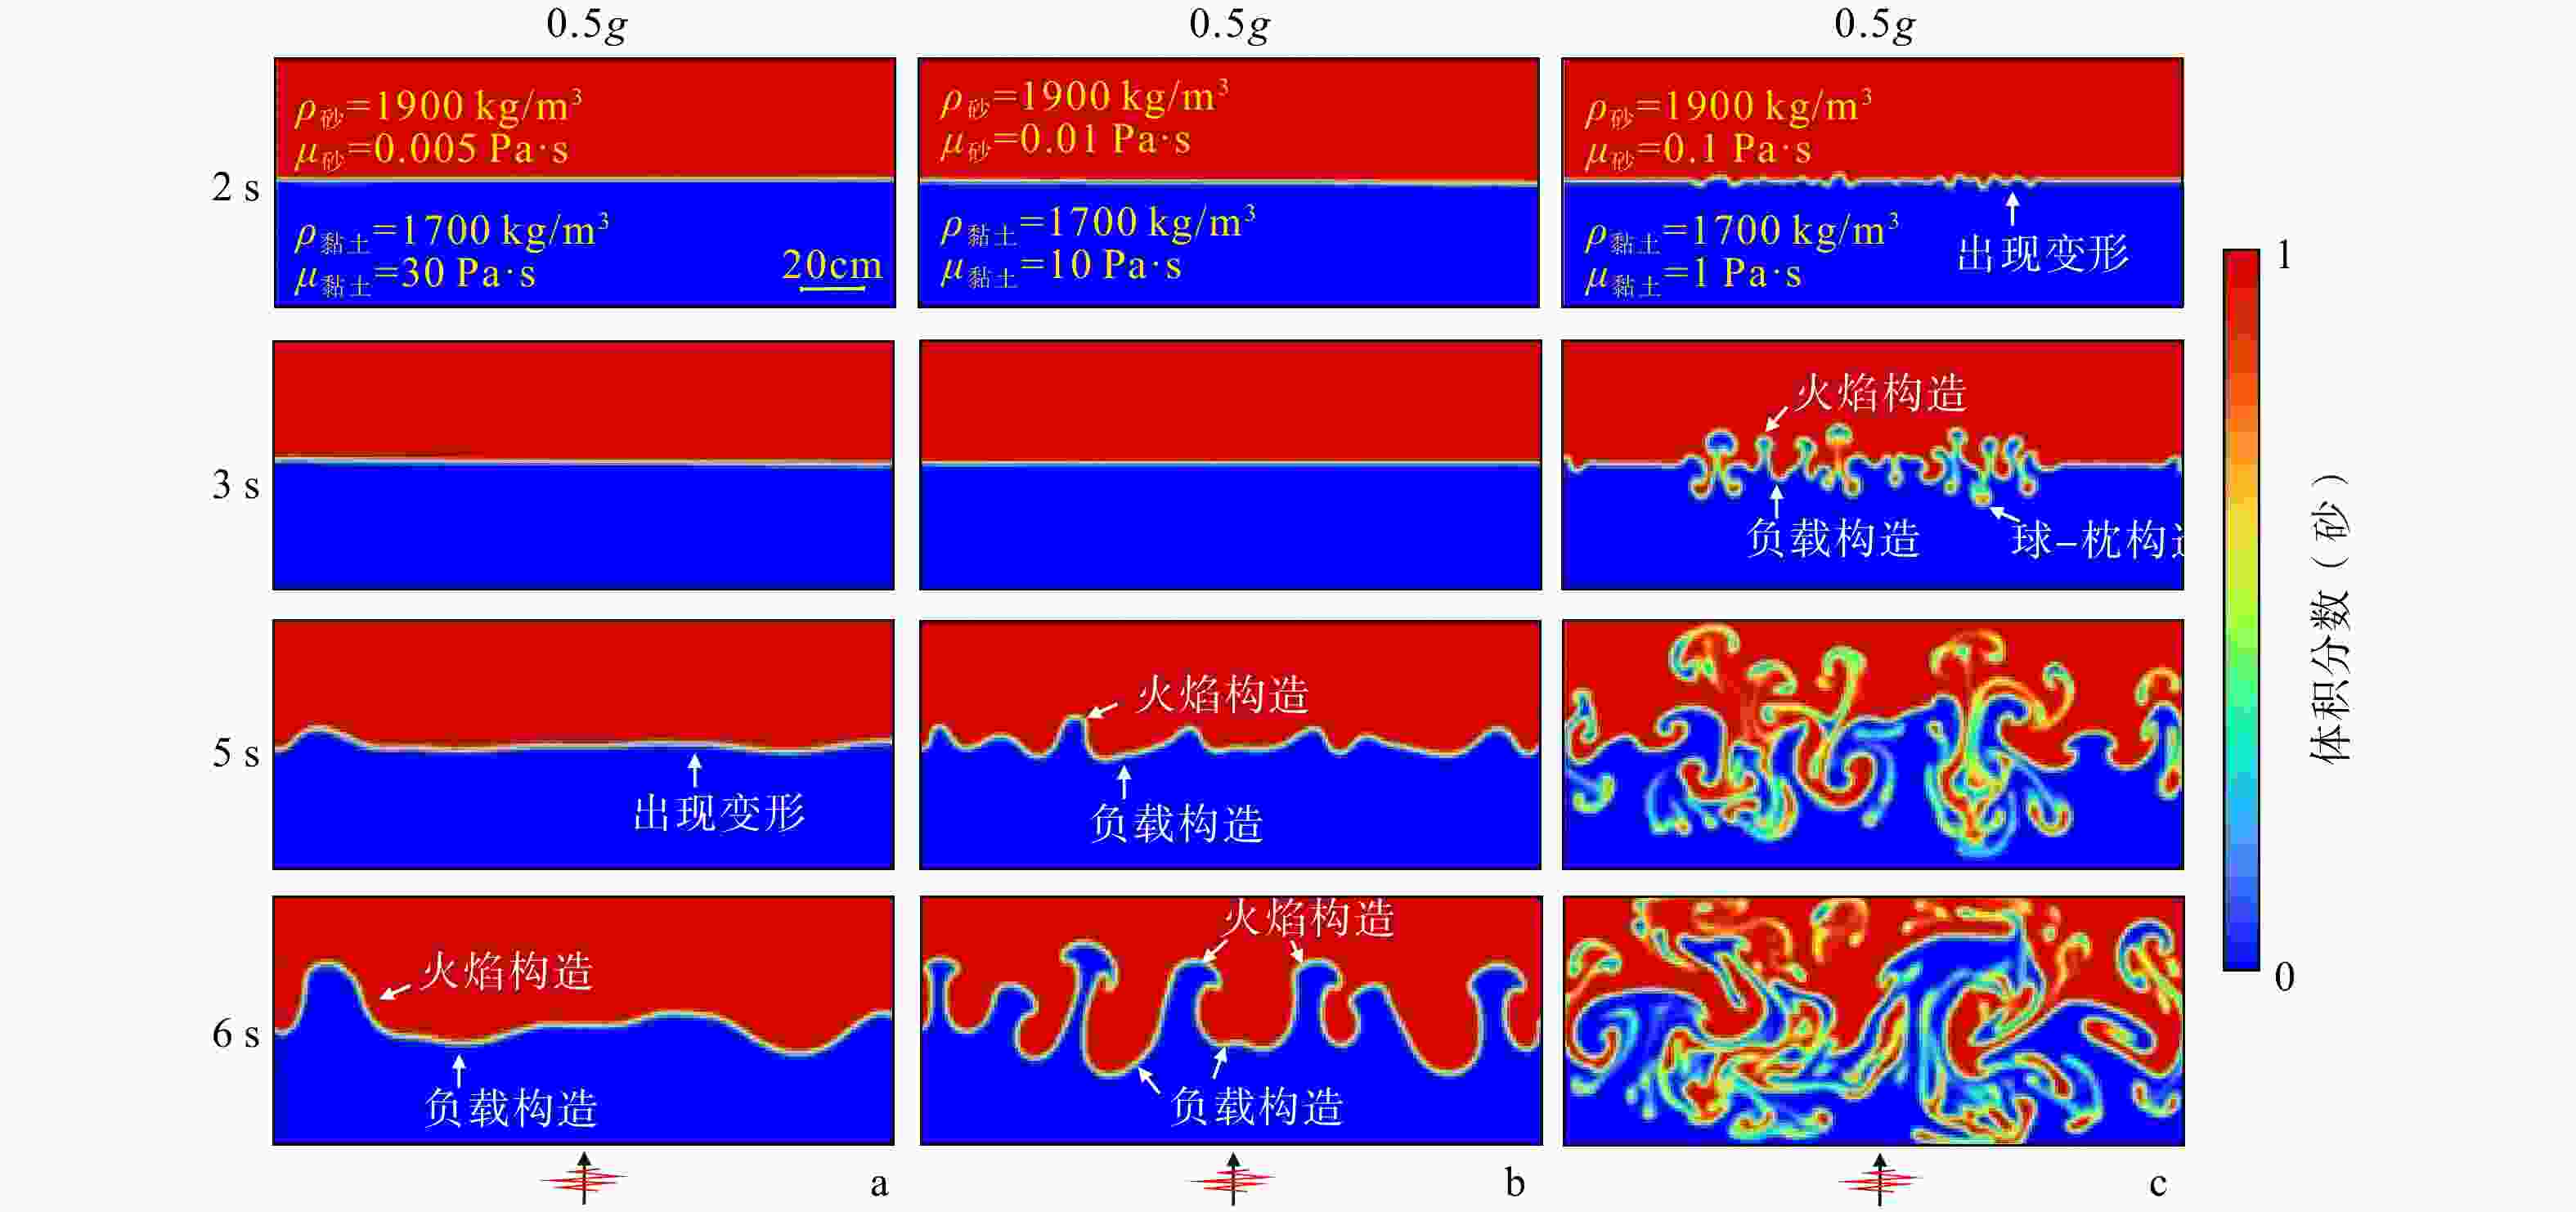
图 4 不同动力黏度差的砂−黏土层在2 s、3 s、5 s和6 s时的变形特征
g—重力加速度,9.81 m/s2;ρ—流体混合物的密度;μ—流体混合物的动力黏度;图底箭头为地震波输入方向a—μ砂为0.005 Pa·s、μ黏土为30 Pa·s;b—μ砂为0.01 Pa·s、μ黏土为10 Pa·s;c—μ砂为0.1 Pa·s、μ黏土为1 Pa·s
Figure 4. Deformation characteristics of the sand–clay layer at 2, 3, 5, and 6 s under different dynamic viscosity contrasts
(a) μsand=0.005 Pa·s, μclay=30 Pa·s;(b) μsand =0.01 Pa·s, μclay =10 Pa·s;(c) μsand =0.1 Pa·s, μclay =1 Pa·sg–gravitational acceleration,9.81 m/s2; ρ–density of the fluid mixture; μ–dynamic viscosity of the fluid mixture. The arrows at the bottom of subfigures indicate the directions of seismic-wave input.
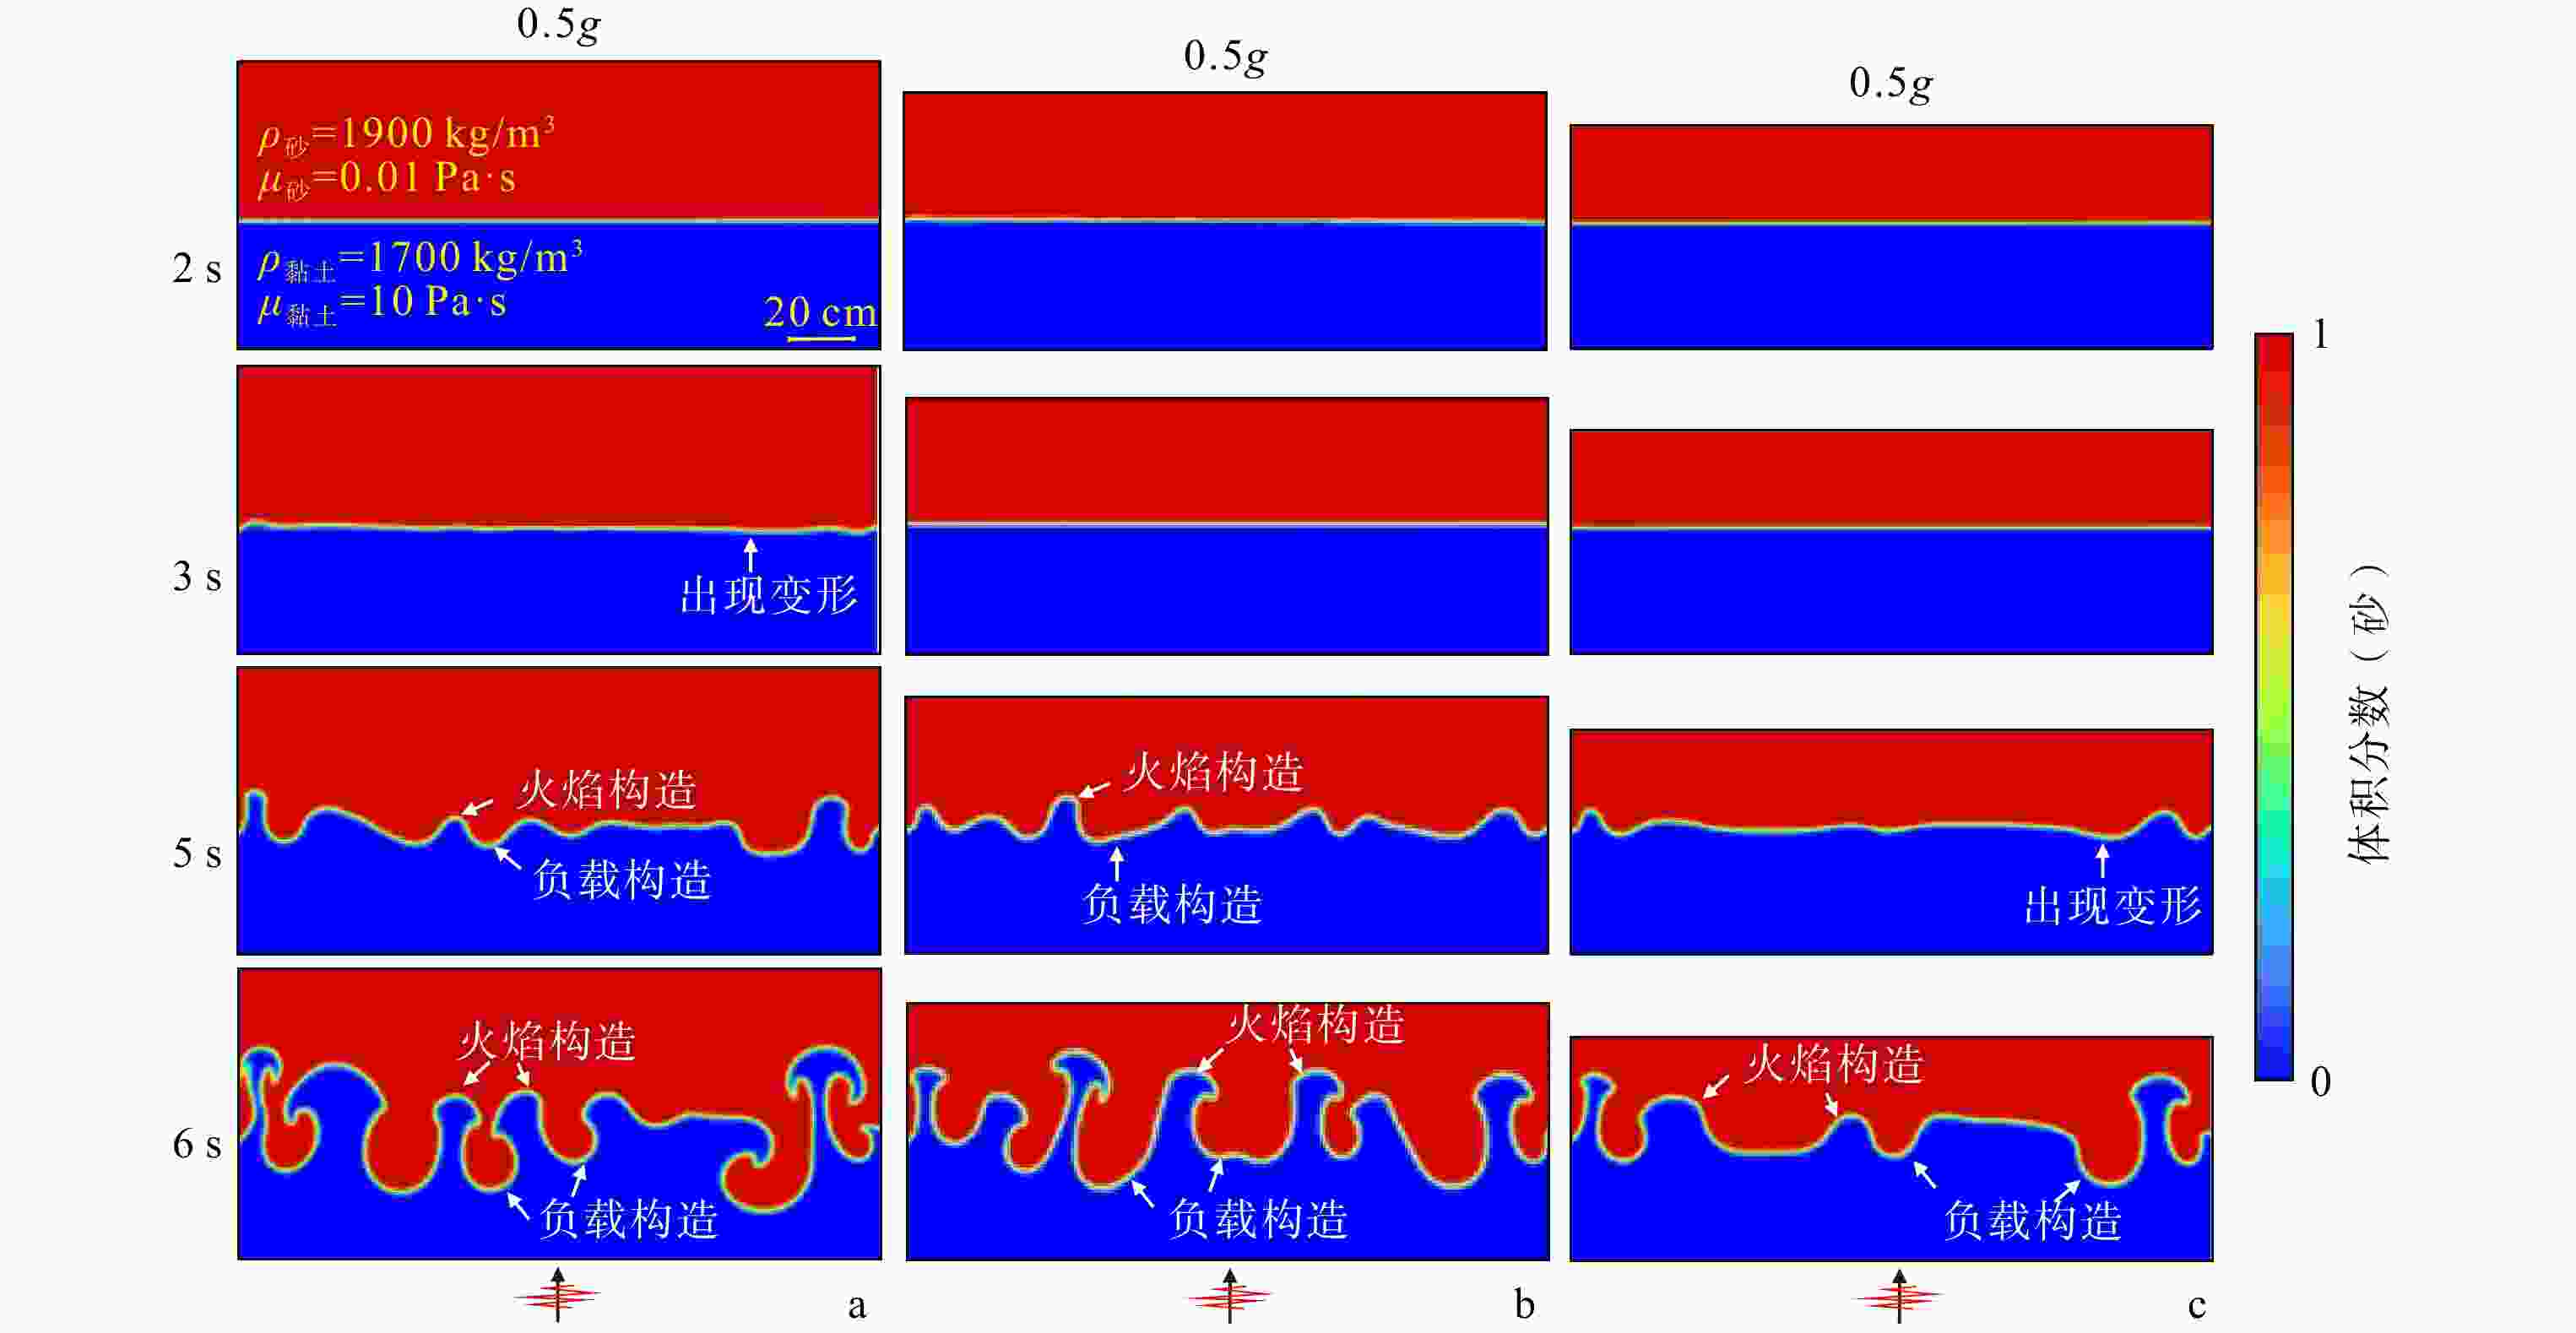
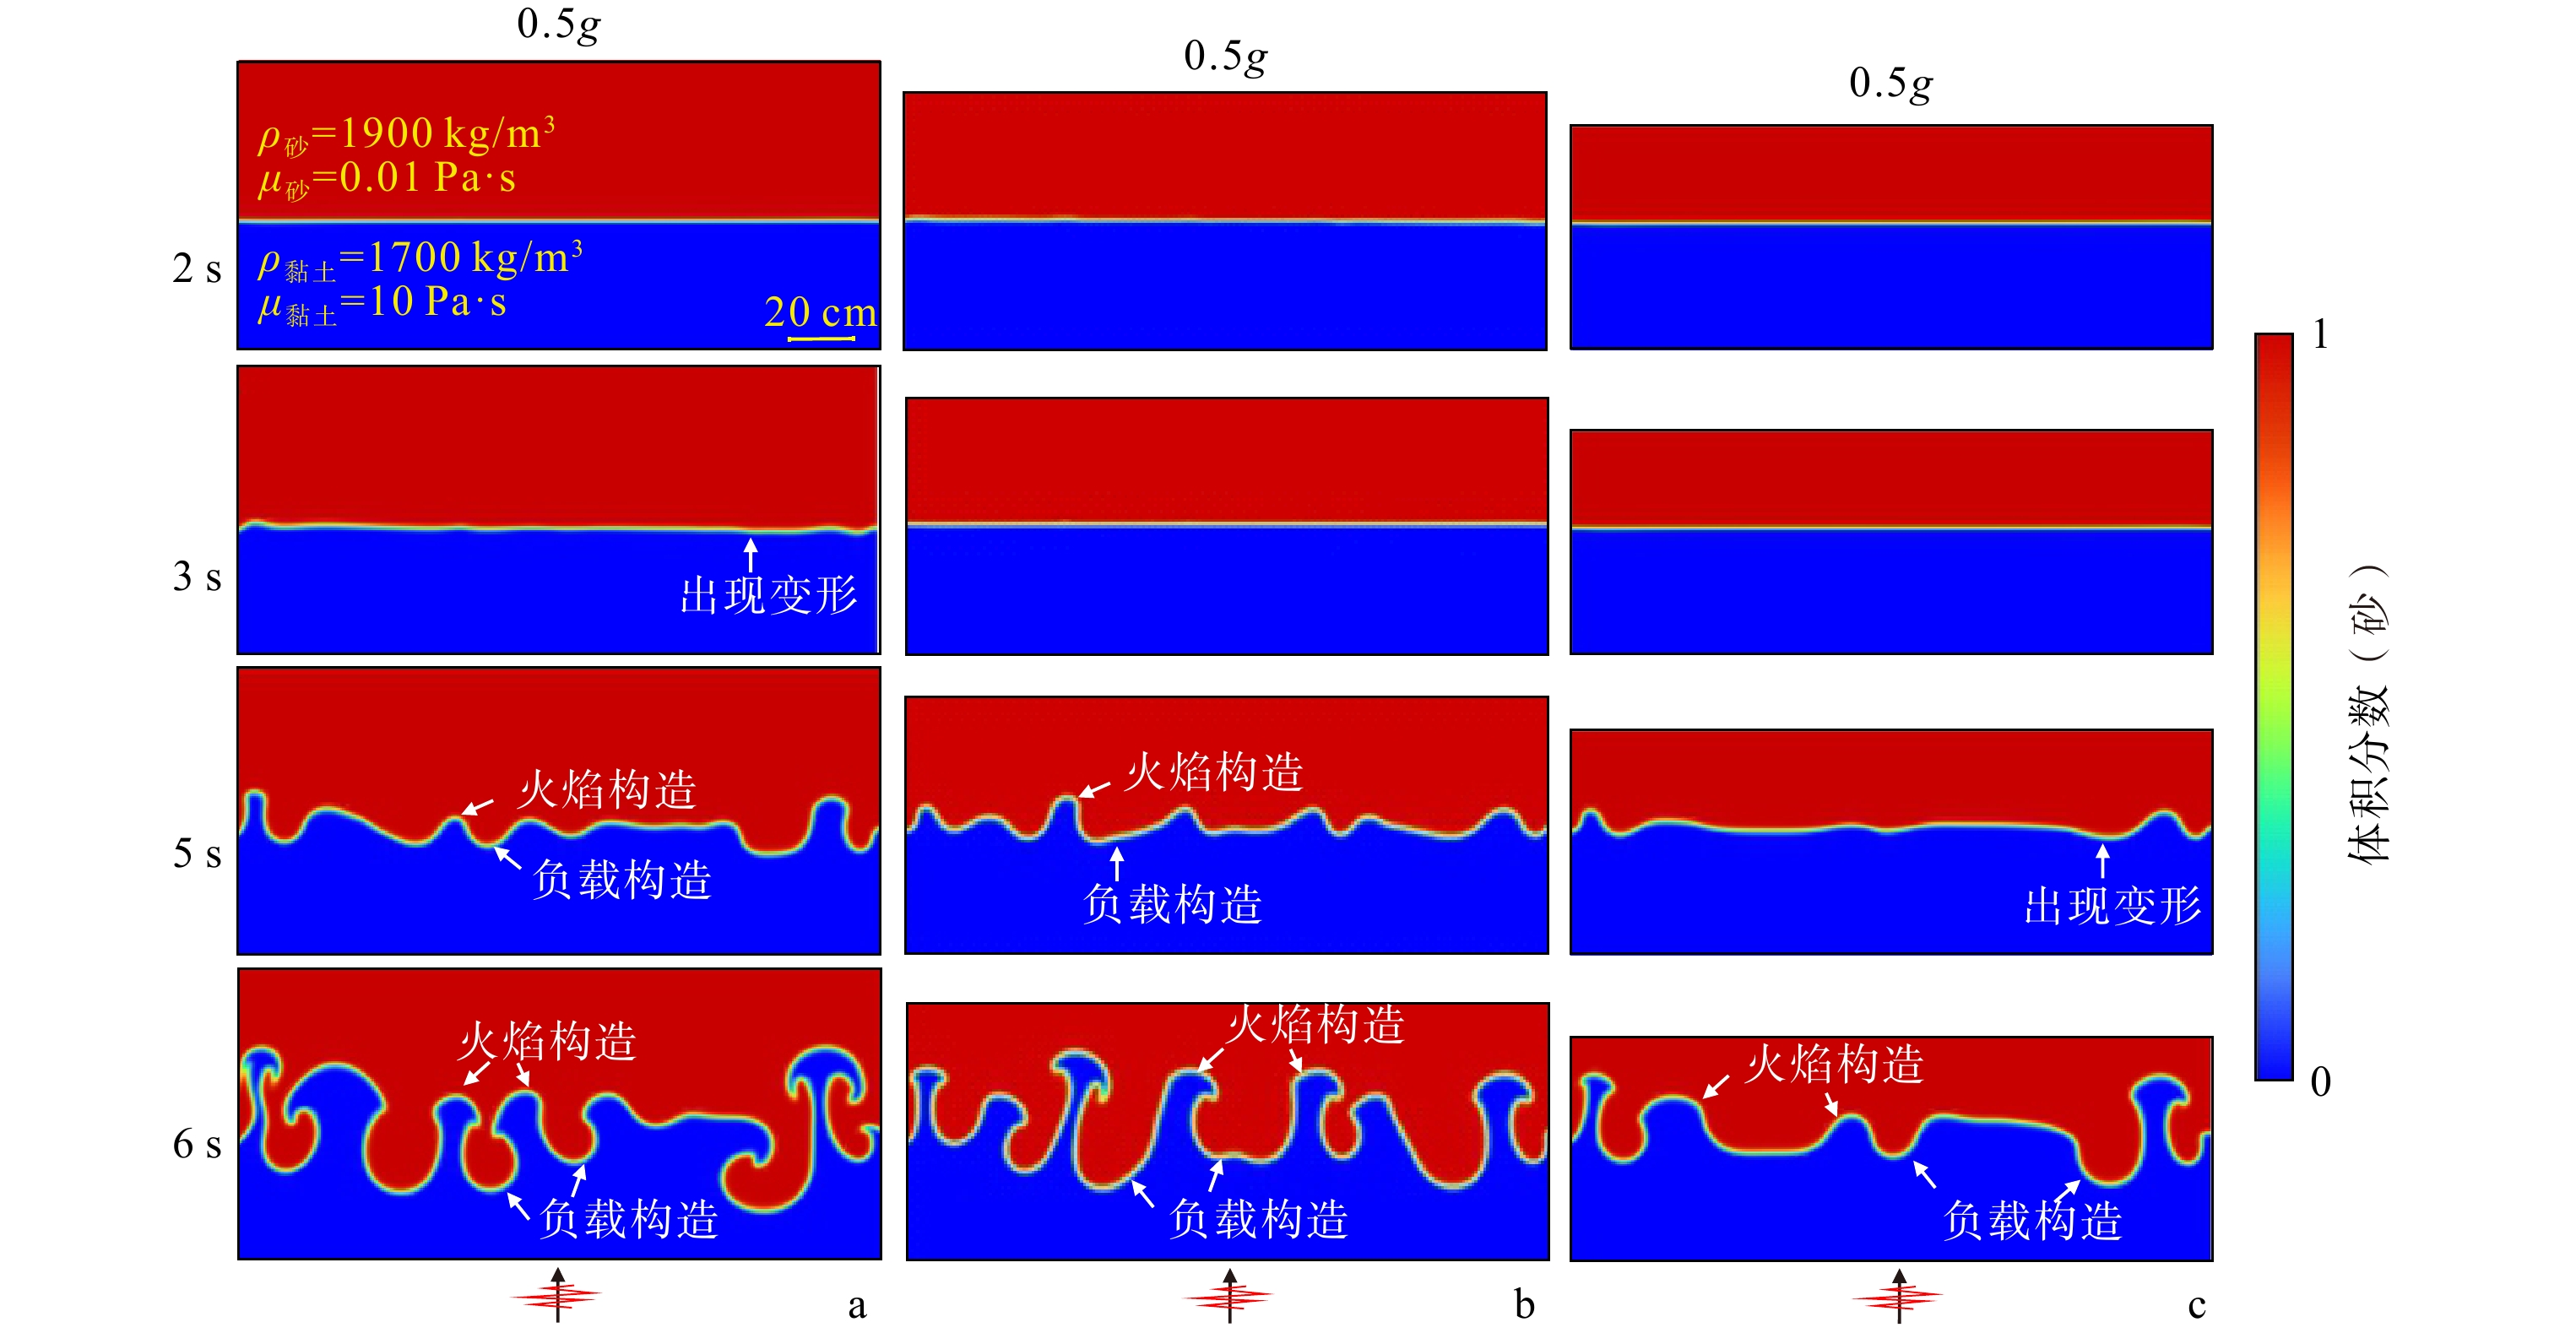
图 5 下伏黏土层厚度不变且上覆砂层厚度发生变化时,砂−黏土层在2 s、3 s、5 s和6 s时的变形特征
g—重力加速度,9.81 m/s2;ρ—流体混合物的密度;μ—流体混合物的动力黏度;图底箭头为地震波输入方向a—砂层厚度为0.5 m;b—砂层厚度为0.4 m;c—砂层厚度为0.3 m
Figure 5. Deformation characteristics of the sand–clay layer at 2, 3, 5, and 6 s with a constant thickness of the underlying clay layer and varying thicknesses of the overlying sand layer
(a) Sand-layer thickness of 0.5 m;(b) Sand-layer thickness of 0.4 m;(c) Sand-layer thickness of 0.3 mg–gravitational acceleration, 9.81 m/s2; ρ–density of the fluid mixture; μ–dynamic viscosity of the fluid mixture. The arrows at the bottom of subfigures indicate the directions of seismic-wave input.
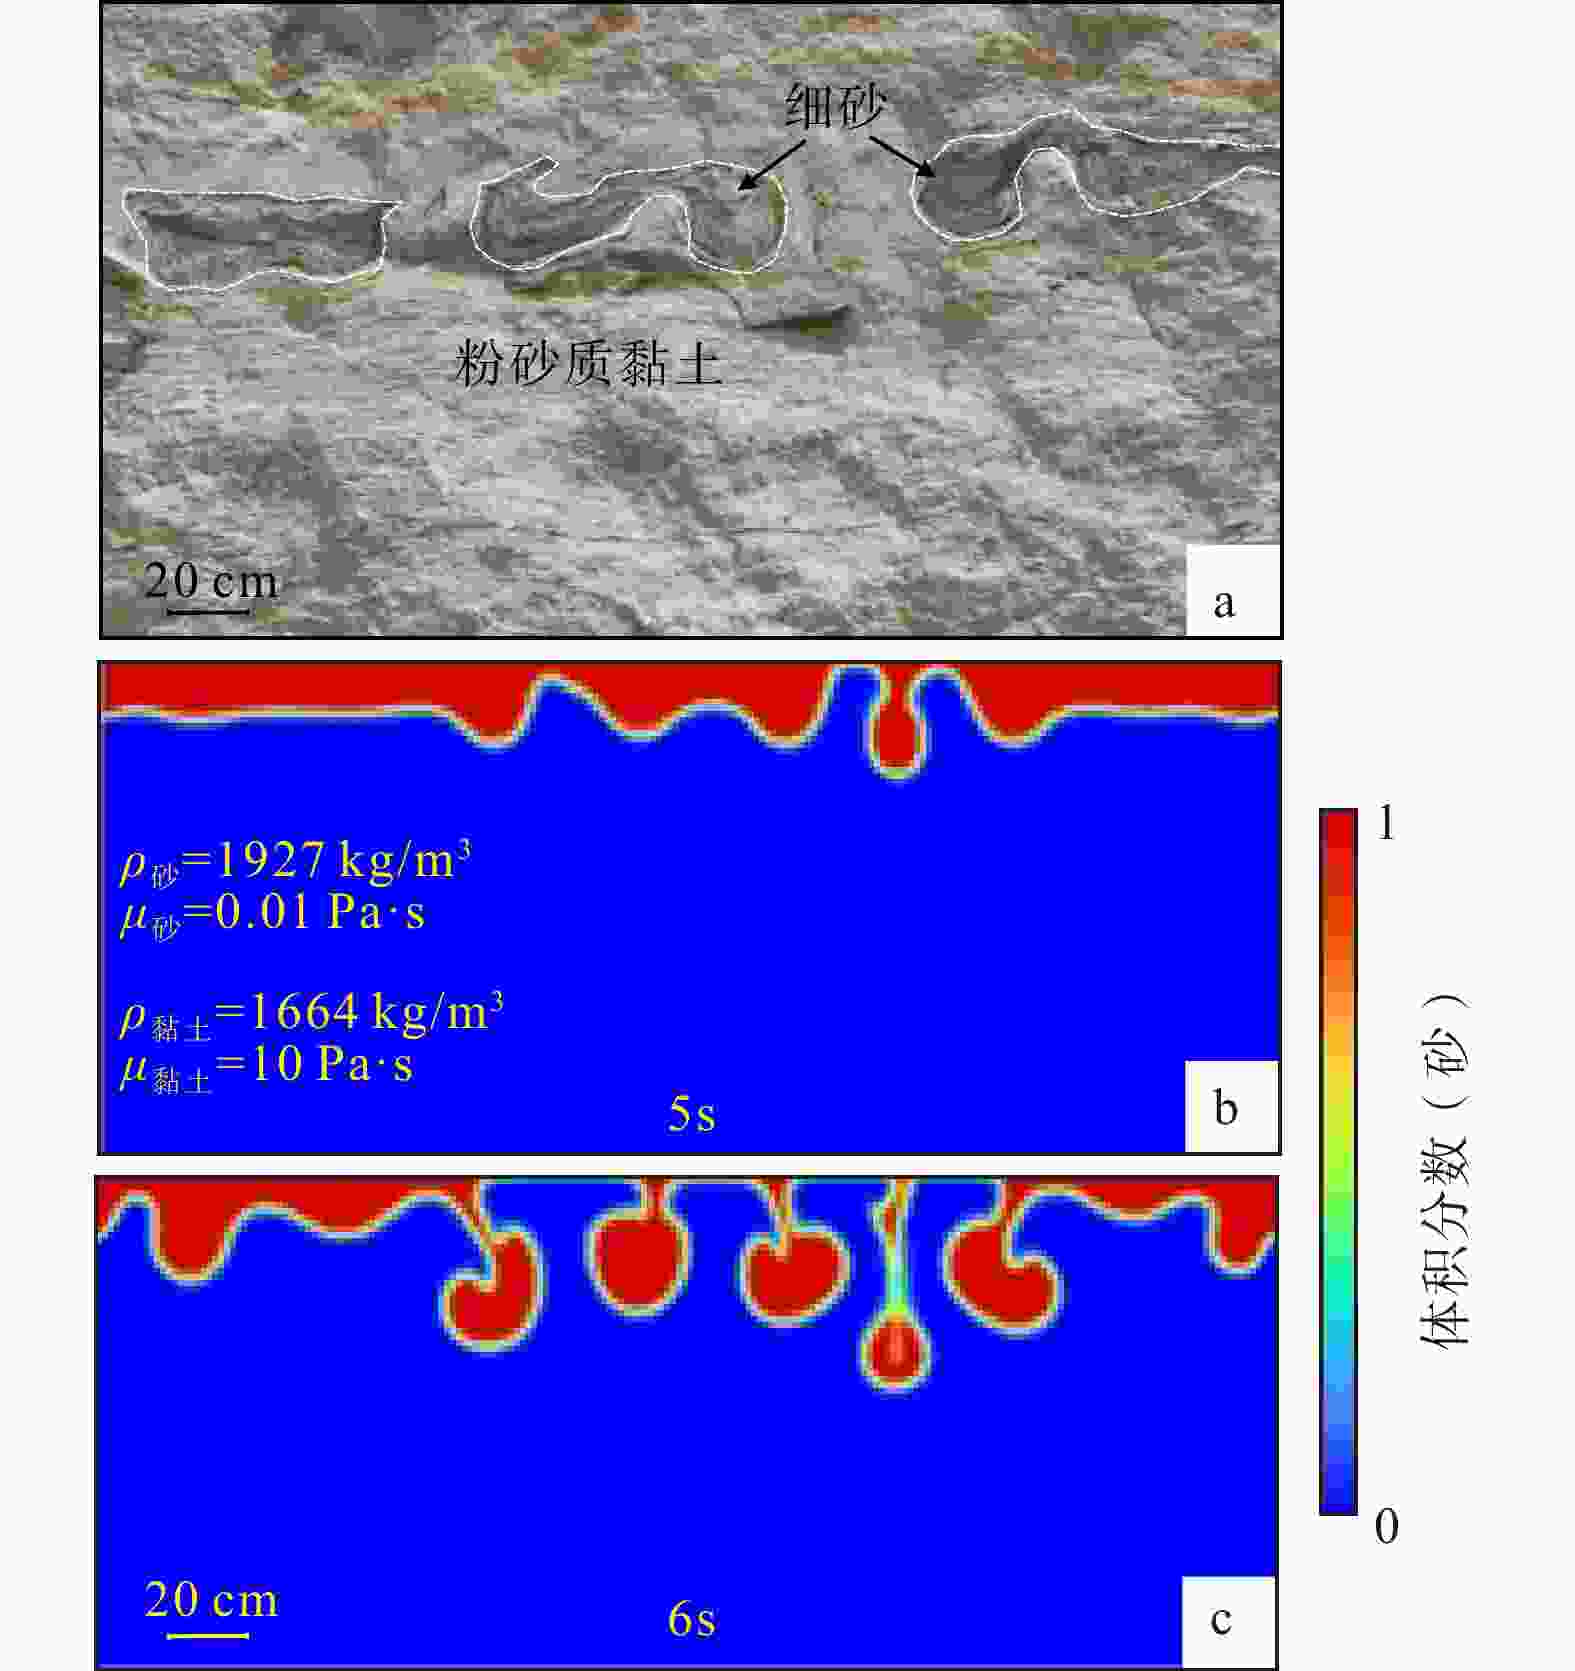
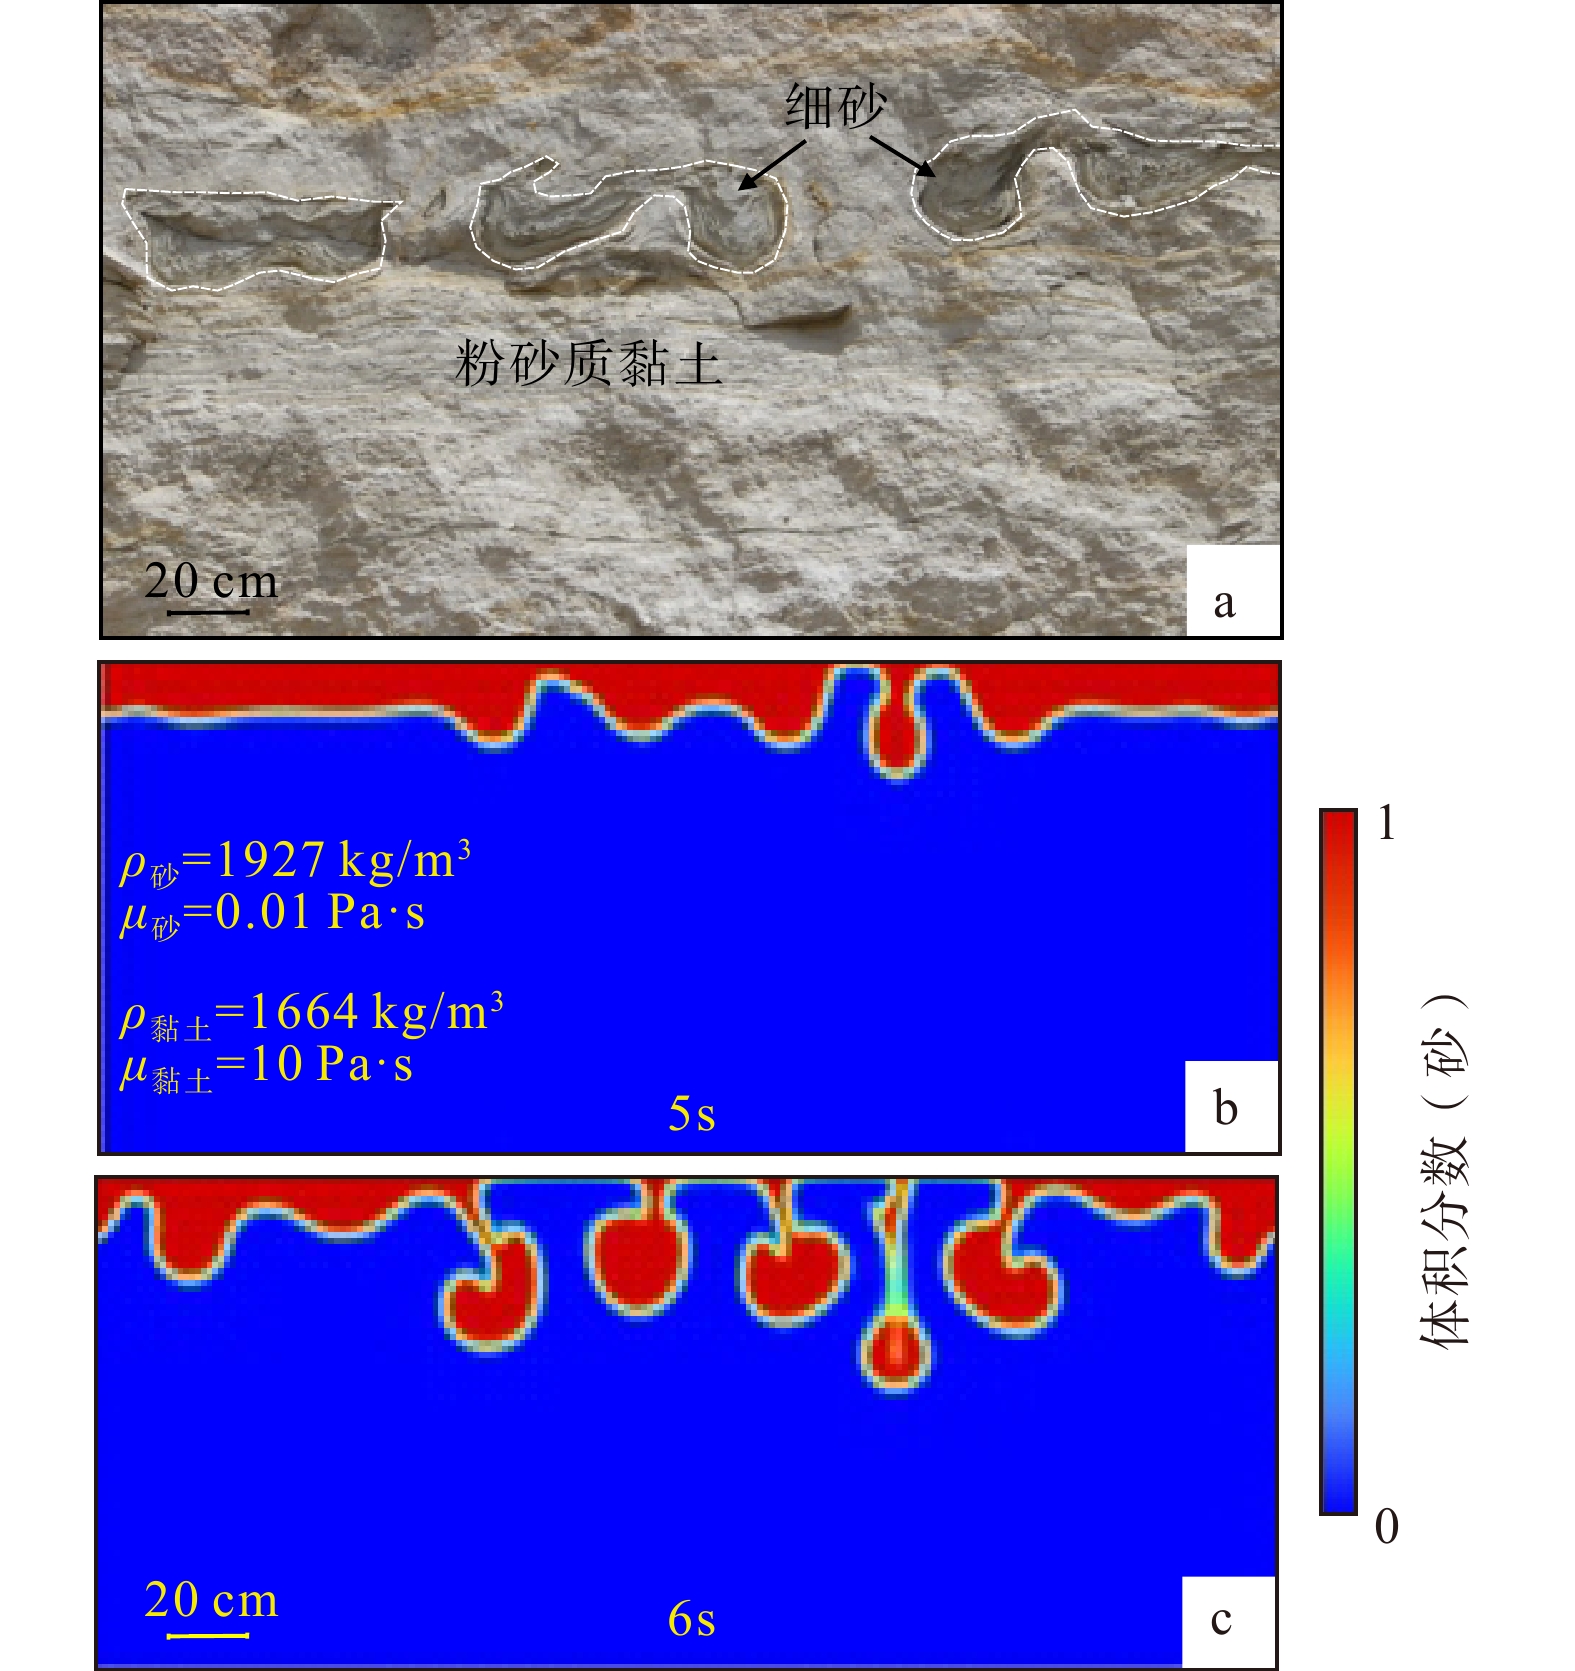
图 6 塔什库尔干湖相沉积负载与球−枕构造和数值模拟结果图
ρ—流体混合物的密度;μ—流体混合物的动力黏度a—负载与球−枕构造野外拍摄图;b—5 s时模拟变形图;c—6 s时模拟变形图
Figure 6. Load and ball-and-pillow structures in lacustrine deposits of Lake Tashkurgan and the results of numerical simulations
(a) Field photograph of load and ball-and-pillow structures;(b) Simulated deformation at 5 s;(c) Simulated deformation at 6 sρ–density of the fluid mixture; μ–dynamic viscosity of the fluid mixture
表 1 沉积模型与数值模拟方案
Table 1. Depositional models and numerical simulation schemes
加速度 沉积层 厚度/m 饱和密度ρ/
(kg/m3)动力黏度μ/
(Pa·s)0.125g
0.25g砂层 0.4 1850 1900 1950 0.010 0.5g
0.8g黏土层 0.4 1750 1700 1650 10 0.5g 砂层 0.4 1900 0.005 0.100 黏土层 0.4 1700 30 1 0.5g 砂层 0.5 0.3 1900 0.010 黏土层 0.4 0.4 1700 10 0.5g 砂层 0.2 1927 0.010 粉砂质黏土层 0.6 1664 10 g—重力加速度,9.81 m/s2  下载: 导出CSV
表 2 野外实例与数值模拟关键参数对比
Table 2. Comparison of key parameters between field observations and numerical simulation
参数类型 野外实例(塔什库尔干) 数值模拟(文中方案) 上覆砂层厚度 0.15~0.25 m 0.2 m 下伏黏土层厚度 >0.5 m 0.6 m 砂层饱和密度 ~1927 kg/m³ 1927 kg/m³ 黏土层饱和密度 ~1664 kg/m³ 1664 kg/m³ 球−枕体垂直长度 20~30 cm 20~35 cm
下载: 导出CSV
-
[1] ALLEN J, 1982. Sedimentary structures, their character and physical basis[J]. Earth Science Reviews, 19(4): 362-363. [2] GALLI P, 2000. New empirical relationships between magnitude and distance for liquefaction[J]. Tectonophysics, 324(3): 169-187. [3] GIBERT L, ALFARO P, GARCÍA-TORTOSA F J, et al., 2011. Superposed deformed beds produced by single earthquakes (Tecopa Basin, California): insights into paleoseismology[J]. Sedimentary Geology, 235(3-4): 148-159. [4] GUO L, HE Z T, LI L L, 2023. Lacustrine sedimentary responses to earthquakes—soft-sediment deformation structures since late Pleistocene: a review of current understanding[J]. Earthquake Research Advances, 3(2): 100158. [5] HEEZEN B C, EWING W M, 1952. Turbidity currents and submarine slumps, and the 1929 Grand Banks [Newfoundland] earthquake[J]. American Journal of Science, 250(12): 849-873. [6] HUANG T, WU F, LI Z H, et al., 2025. Soft-sediment deformation structure records of Holocene paleoseismic events along the southeastern segment of the Xiangshan-Tianjingshan Fault Zone on the northeastern margin of the Tibetan Plateau[J]. Northwestern Geology, 58(6): 131-148. (in Chinese with English abstract) [7] JAMIL M, SIDDIQUI N A, UMAR M, et al., 2021. Aseismic and seismic impact on development of soft-sediment deformation structures in deep-marine sand-shaly Crocker fan in Sabah, NW Borneo[J]. Journal of King Saud University-Science, 33: 101522. [8] KLUGER M O, LOWE D J, MOON V G, et al., 2023. Seismically-induced down-sagging structures in tephra layers (tephra-seismites) preserved in lakes since 17.5 cal ka, Hamilton lowlands, New Zealand[J]. Sedimentary Geology, 445: 106327. [9] LI J J, JANSEN J D, CARLING P A, et al., 2025. Palaeoseismicity recorded in soft-sediment deformation structures within a 166-m-long drill core from Diexi Palaeolake, eastern Tibetan Plateau[J]. Journal of Mountain Science, 22(12): 4464-4489. [10] LIANG L J, QIAO X F, DAI F C, et al., 2021. Seismically triggered soft-sediment deformation structures in Tashkorgan lacustrine sediments, northeastern Pamir, China[J]. Quaternary International, 604: 82-92. [11] LIANG L J, LU Z H, ZHANG Q T, et al., 2024. Shaking table simulation of soft sediment deformation structures in lacustrine sediments[J]. Sedimentary Geology, 472: 106756. [12] LIU X C, 2019. Finite-element simulations of structure-fluid coupling: a case study in vein-type tungsten deposits[J]. Journal of Geomechanics, 25(S1): 163-169. (in Chinese with English abstract) [13] LU Y, WETZLER N, WALDMANN N, et al., 2020. A 220, 000-year-long continuous large earthquake record on a slow-slipping plate boundary[J]. Science Advances, 6(48): eaba4170. [14] MA J, HE D F, LU G, et al., 2025. The influence of weak layers on thrust structure deformation: a finite element numerical simulation study[J]. Journal of Geomechanics, 31(3): 444-457. (in Chinese with English abstract) [15] MANDAL S, SINGH A, BANERJEE S, et al., 2023. Linking the impact of seismicity on palaeogeographic evolution and sedimentary architecture: a case study from Middle Jurassic succession of Spiti Himalaya[J]. Geological Magazine, 160(10): 1863-1874. [16] MILNES A R, PLUMMER P S, MAY R I, 2024. Earthquake-induced soft-sediment deformation in the Pleistocene succession, Noarlunga Embayment, South Australia[J]. Transactions of the Royal Society of South Australia, 148(2): 154-169. [17] MOLENAAR A, VAN DAELE M, VANDORPE T, et al., 2021. What controls the remobilization and deformation of surficial sediment by seismic shaking? Linking lacustrine slope stratigraphy to great earthquakes in South-Central Chile[J]. Sedimentology, 68(6): 2365-2396. [18] MORETTI M, PIERI P, TROPEANO M, 2002. Late Pleistocene soft-sediment deformation structure interpreted as seismites in paralic deposits in the City of Bari (Apulian Foreland, southern Italy)[M]//ETTENSOHN F R, RAST N, BRETT C E. Ancient seismites. Geological Society of America: 75-85. [19] MORETTI M, RONCHI A, 2011. Liquefaction features interpreted as seismites in the Pleistocene fluvio-lacustrine deposits of the Neuquén Basin (Northern Patagonia)[J]. Sedimentary Geology, 235(3-4): 200-209. [20] MUELLER P, TAMBURELLI S, MENEGONI N, et al., 2023. Concurrence of load-and-flame structures, balls-and-pillows, clastic injectites and shear deformation bands as indicator of seismicity in mixed siliciclastic-carbonate successions (Finale Ligure Basin, Italy)[J]. Marine and Petroleum Geology, 155: 106345. [21] NIKOLAEVA S B, 2022. Paleoseismic events reflected in late Pleistocene and Holocene deposits of the terraces of Imandra Lake (Kola Region, Fennoscandian Shield)[J]. Doklady Earth Sciences, 506(S1): S108-S115. [22] OBERMEIER S F, 1998. Liquefaction evidence for strong earthquakes of Holocene and latest Pleistocene ages in the states of Indiana and Illinois, USA[J]. Engineering Geology, 50(3-4): 227-254. [23] O'BRIEN J S, JULIEN P Y, 1988. Laboratory analysis of mudflow properties[J]. Journal of Hydraulic Engineering, 114(8): 877-887. [24] OWEN G, 2003. Load structures: gravity-driven sediment mobilization in the shallow subsurface[J]. Geological Society, London, Special Publications, 216(1): 21-34. [25] OWEN G, MORETTI M, ALFARO P, 2011. Recognising triggers for soft-sediment deformation: current understanding and future directions[J]. Sedimentary Geology, 235(3-4): 133-140. [26] QIAO X F, LI H B, 2008. Pillow, ball-and-pillow structures: paleo-seismic records within strata[J]. Geological Review, 54(6): 721-730. (in Chinese with English abstract) [27] QIAO X F, LI H B, SU D C, et al. , 2017. Soft-sediment deformation structures: records of earthquakes and paleoearthquakes[M]. Beijing: Geological Publishing House: 1-263. (in Chinese) [28] RAJKHOWA S, JAISWARA N K, PANDEY P, et al., 2026. Coseismic liquefaction during Mw6.0 2021-Assam earthquake and paleoliquefaction features in the Brahmaputra Plain, India: implications on boundary conditions and paleoseismicity[J]. Natural Hazards, 122(4): 153. [29] SHANMUGAM G, 2017. Global case studies of soft-sediment deformation structures (SSDS): definitions, classifications, advances, origins, and problems[J]. Journal of Palaeogeography, 6(4): 251-320. [30] SIPP G S, SCHERER C M D S, RODRIGUES A G, et al., 2026. Soft-sediment deformation structures in eolian sandstones: morphology, genesis, and stratigraphical relationships through time[J]. Sedimentary Geology, 491: 106996. [31] SU D C, SUN A P, LI Z L, et al., 2022. Origin of soft-sediment deformation structures in Nihewan Basin[J]. Journal of Palaeogeography, 11(3): 332-359. [32] VAN LOON A J, PISARSKA-JAMROŻY M, 2014. Sedimentological evidence of Pleistocene earthquakes in NW Poland induced by glacio-isostatic rebound[J]. Sedimentary Geology, 300: 1-10. [33] WETZLER N, MARCO S, HEIFETZ E, 2010. Quantitative analysis of seismogenic shear-induced turbulence in lake sediments[J]. Geology, 38(4): 303-306. [34] ZHANG F X, ZHOU Y Q, WANG A D, et al., 2015. Load structures and ball-and-pillow structures on the Lingshan Island, Shandong[J]. Sedimentary Geology and Tethyan Geology, 35(3): 42-50. (in Chinese with English abstract) [35] ZHANG J D, LIANG C, CAO Y C, et al., 2024. Feature of event bed combinations constrains the seismic origin for soft-sediment deformation as applied to the Lingshan Island, Qingdao, East China[J]. Advances in Earth Science, 39(1): 96-107. (in Chinese with English abstract) [36] ZHAO J K, 2020. Study on dynamic disturbance characteristics and simulation reproduction of soft sediment deformation in Diexi Ancient Dam Lake[D]. Chengdu: Chengdu University of Technology. (in Chinese with English abstract) [37] ZHONG N, JIANG H C, LIANG L J, et al., 2017. Paleoearthquake researches via soft sediment deformation of load, ball-and-pillow structure: a review[J]. Geological Review, 63(3): 719-738. (in Chinese with English abstract) [38] ZHONG N, JIANG H C, LI H B, et al., 2021. The use of soft-sediment deformation structures as proxies for paleoseismic activity and shaking: a review[J]. Geological Review, 67(6): 1785-1802. (in Chinese with English abstract) [39] 黄婷, 吴芳, 李振宏, 等, 2025. 青藏高原东北缘香山–天景山断裂带东南段全新世古地震事件的软沉积变形构造记录[J]. 西北地质, 58(6): 131-148. [40] 刘向冲, 2019. 构造-流体耦合有限元模拟: 以石英脉型钨矿为例[J]. 地质力学学报, 25(S1): 163-169. [41] 马佳, 何登发, 鲁国, 等, 2025. 软弱层对逆冲构造变形的影响: 有限元数值模拟研究[J]. 地质力学学报, 31(3): 444-457. [42] 乔秀夫, 李海兵, 2008. 枕、球—枕构造: 地层中的古地震记录[J]. 地质论评, 54(6): 721-730. [43] 乔秀夫, 李海兵, 苏德辰, 等, 2017. 软沉积物变形构造: 地震与古地震记录[M]. 北京: 地质出版社: 1-263. [44] 张风霄, 周瑶琪, 王安东, 等, 2015. 山东省灵山岛负载构造和球-枕构造研究[J]. 沉积与特提斯地质, 35(3): 42-50. [45] 张济东, 梁超, 操应长, 等, 2024. 事件层组合特征限定软沉积变形的地震成因: 在青岛灵山岛的应用[J]. 地球科学进展, 39(1): 96-107. [46] 赵家康, 2020. 叠溪古堰塞湖中软沉积变形的动力扰动特征及其模拟再现研究[D]. 成都: 成都理工大学. [47] 钟宁, 蒋汉朝, 梁莲姬, 等, 2017. 软沉积物变形中负载、球—枕构造的古地震研究综述[J]. 地质论评, 63(3): 719-738. [48] 钟宁, 蒋汉朝, 李海兵, 等, 2021. 地震成因软沉积物变形记录的地震强度研究进展[J]. 地质论评, 67(6): 1785-1802. -

 下载:
下载:



计量
- 文章访问数: 279
- HTML全文浏览量: 81
- PDF下载量: 118
- 被引次数: 0
