

Tectonic stress field and crustal strength of the central-southern Tanlu Fault Zone
-
摘要: 合理估算地壳强度、准确评价地壳抵抗构造变形或破裂的能力,是地震危险性评价和地球动力学研究的关键科学问题。基于郯庐断裂带中南段钻孔测井资料和震源机制解译结果,分析了其构造应力场分布特征。研究结果显示,郯庐断裂带中南段深、浅地壳应力特征基本一致,应力类型主要为走滑型,最大水平主应力方向以北东东向为主。区域断层摩擦系数约为0.3,远低于Byerlee定律的0.6~1.0,断层摩擦强度处于中等水平;进一步以此为约束,建立了郯庐断裂带中南段的地壳强度剖面,揭示了相对较强的中—上地壳和极弱的下地壳,区域构造应力主要通过中—上地壳传递。此外,极弱的下地壳与中生代以来华北克拉通破坏具有密切的联系,其可能同时是导致岩石圈减薄等深部变形过程的结果和促进因素。Abstract:
Significance The accurate estimation of crustal strength—the capacity of the lithosphere to resist tectonic deformation—is fundamental to both seismic hazard assessment and geodynamic studies. Methods This study integrates borehole logging data and focal mechanism solutions from the central-southern Tanlu Fault Zone. Objective The study aims to analyze the characteristics of the tectonic stress field. Results The study reveals that the stress states in the shallow and deep crust are generally consistent, with a predominant strike-slip stress regime and a preferential ENE–WSW orientation of the maximum horizontal principal stress. The regional fault friction coefficient is approximately 0.3, significantly lower than the 0.6–1.0 range suggested by Byerlee's law, indicating a moderate level of fault frictional strength. Furthermore, constrained by these findings, a crustal strength profile was established for the central-southern Tanlu Fault Zone. Conclusion This profile reveals a relatively strong upper and middle crust underlain by an extremely weak lower crust. Regional tectonic forces are primarily transmitted through the upper and middle crust. This extremely weak lower crust is closely linked to the destruction of the North China Craton since the Mesozoic, likely serving as both a consequence and a facilitating mechanism of the deep deformation processes that led to lithospheric thinning. -
Key words:
- tectonic stress field /
- crustal strength /
- Tanlu Fault zone /
- deep deformation
-
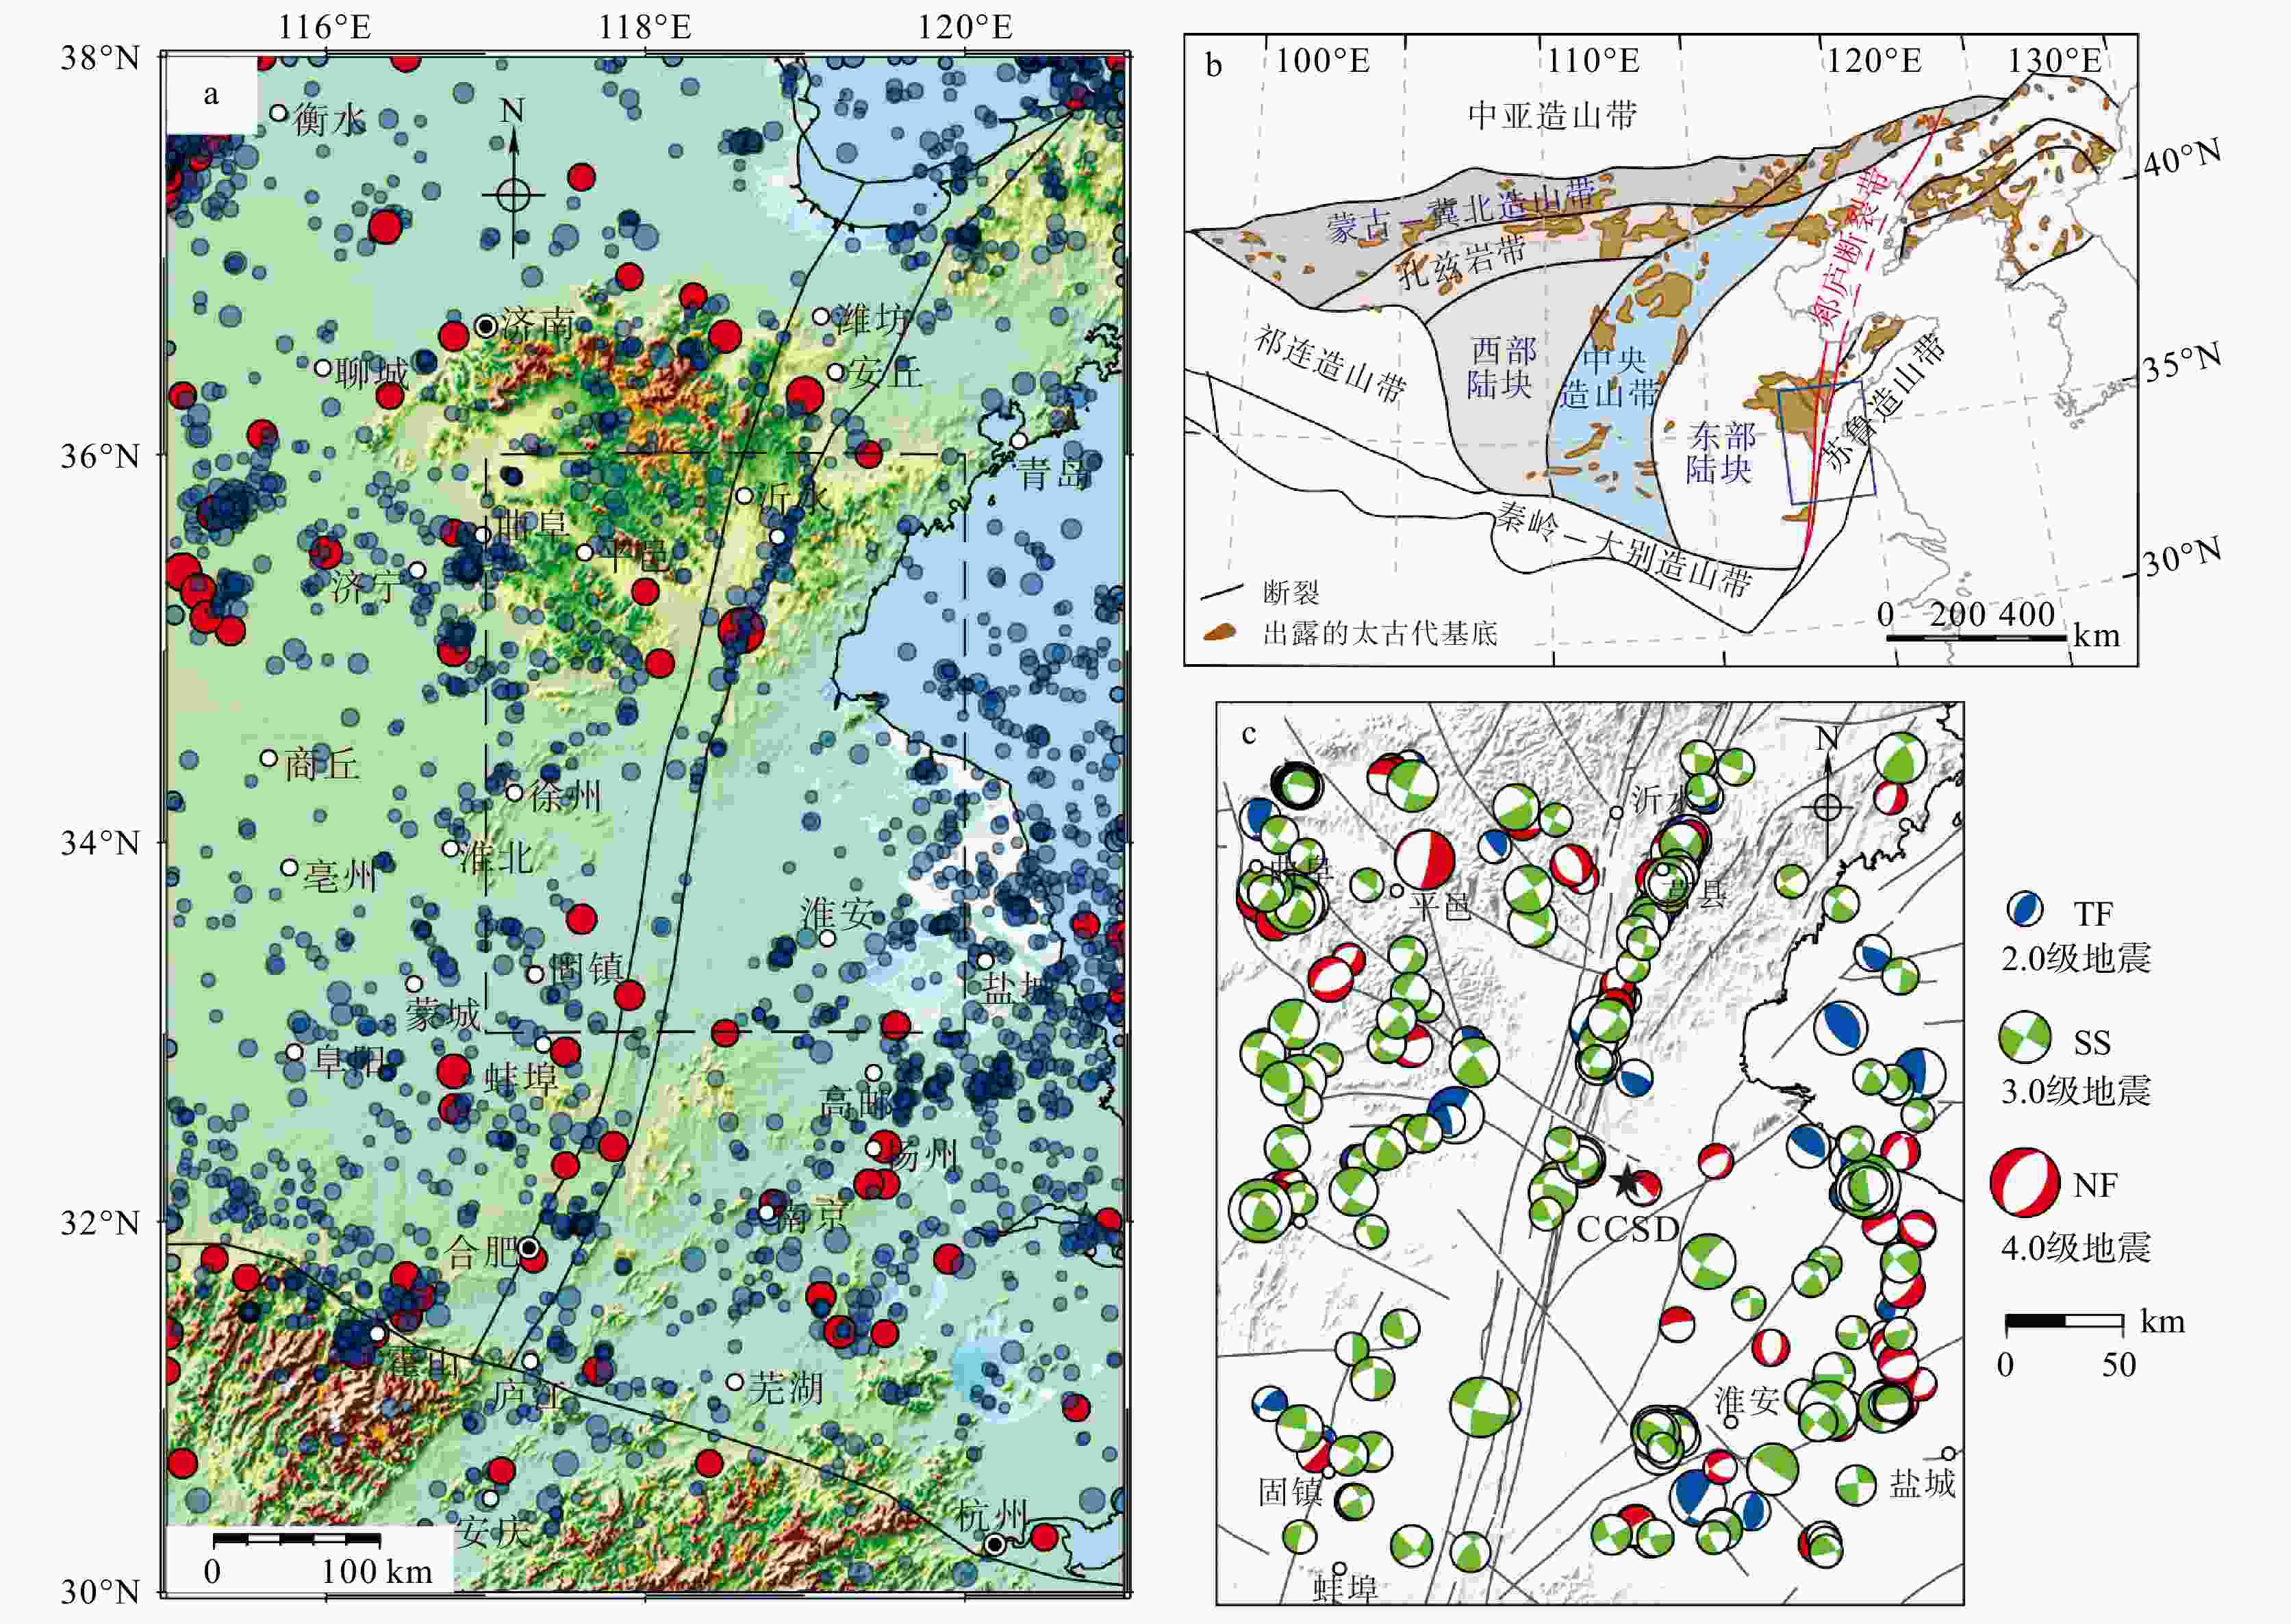
图 1 区域构造背景及地震活动图
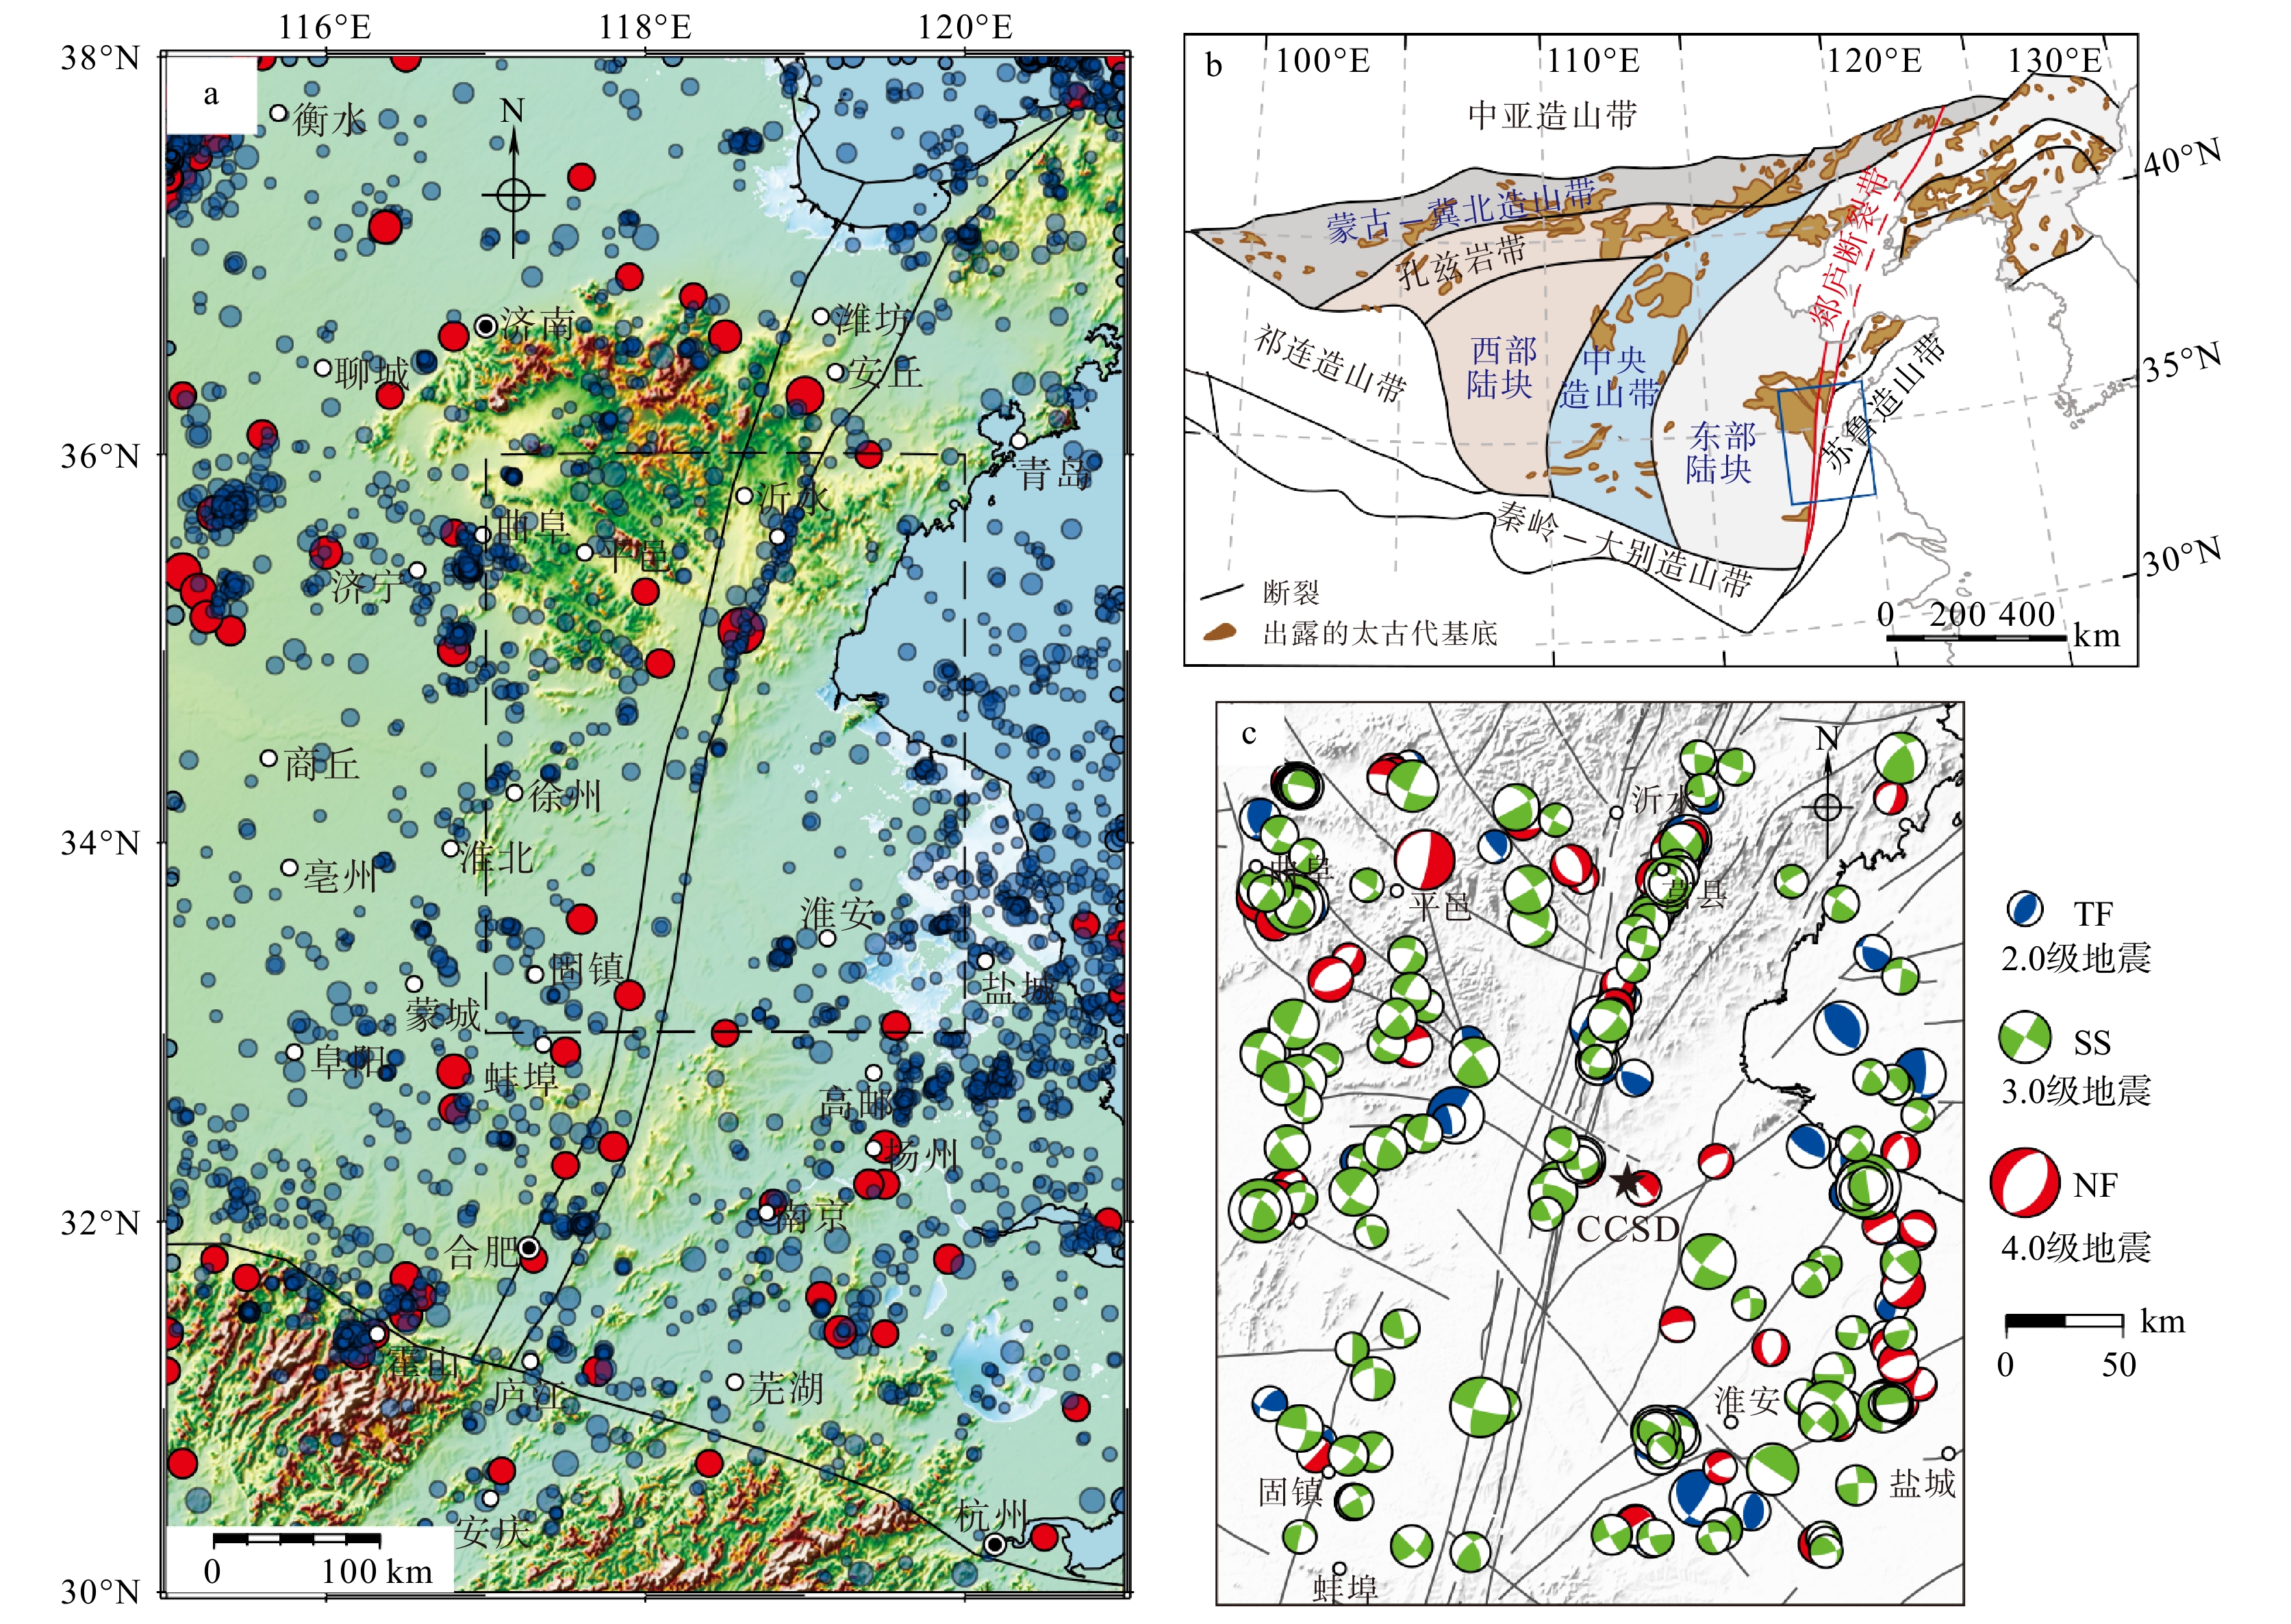
图a中蓝色实心圆代表M 2以上地震震中,红色实心圆代表M 5以上地震,黑色实线代表块体边界线,黑色虚线框代表图c研究区范围;图b中蓝色线框代表图a范围;图c中黑色实线代表断层(Wu et al.,2024),CCSD—中国大陆科学钻,TF—逆断型,SS—走滑型,NF—正断型a—郯庐断裂带苏鲁段地震活动分布;b—华北克拉通构造简图(据Huang et al.,2020修改);c—研究区地震震源机制解
Figure 1. Maps of the regional tectonic background and seismic activity
(a) Distribution of seismicity along the Jiangsu–Shandong segment of the Tanlu Fault Zone; (b) Simplified tectonic map of the North China Craton (modified from Huang et al., 2020); (c) Focal mechanism solutions for the studied region In Fig 1a, the blue symbols represent epicenters of earthquakes with magnitudes ≥M2, the red symbols represent those with magnitudes ≥M5, the solid black lines represent the block boundaries, and the dashed black box indicates the study area enlarged in panel c. The frame with blue outline in Fig 1b represents panel b. In Fig 1c, the solid black lines represent faults from Wu et al., 2004; CCSD–Chinese Continental Scientific Drilling; TF–thrust faulting; SS– strike-slip faulting; NF–normal faulting.
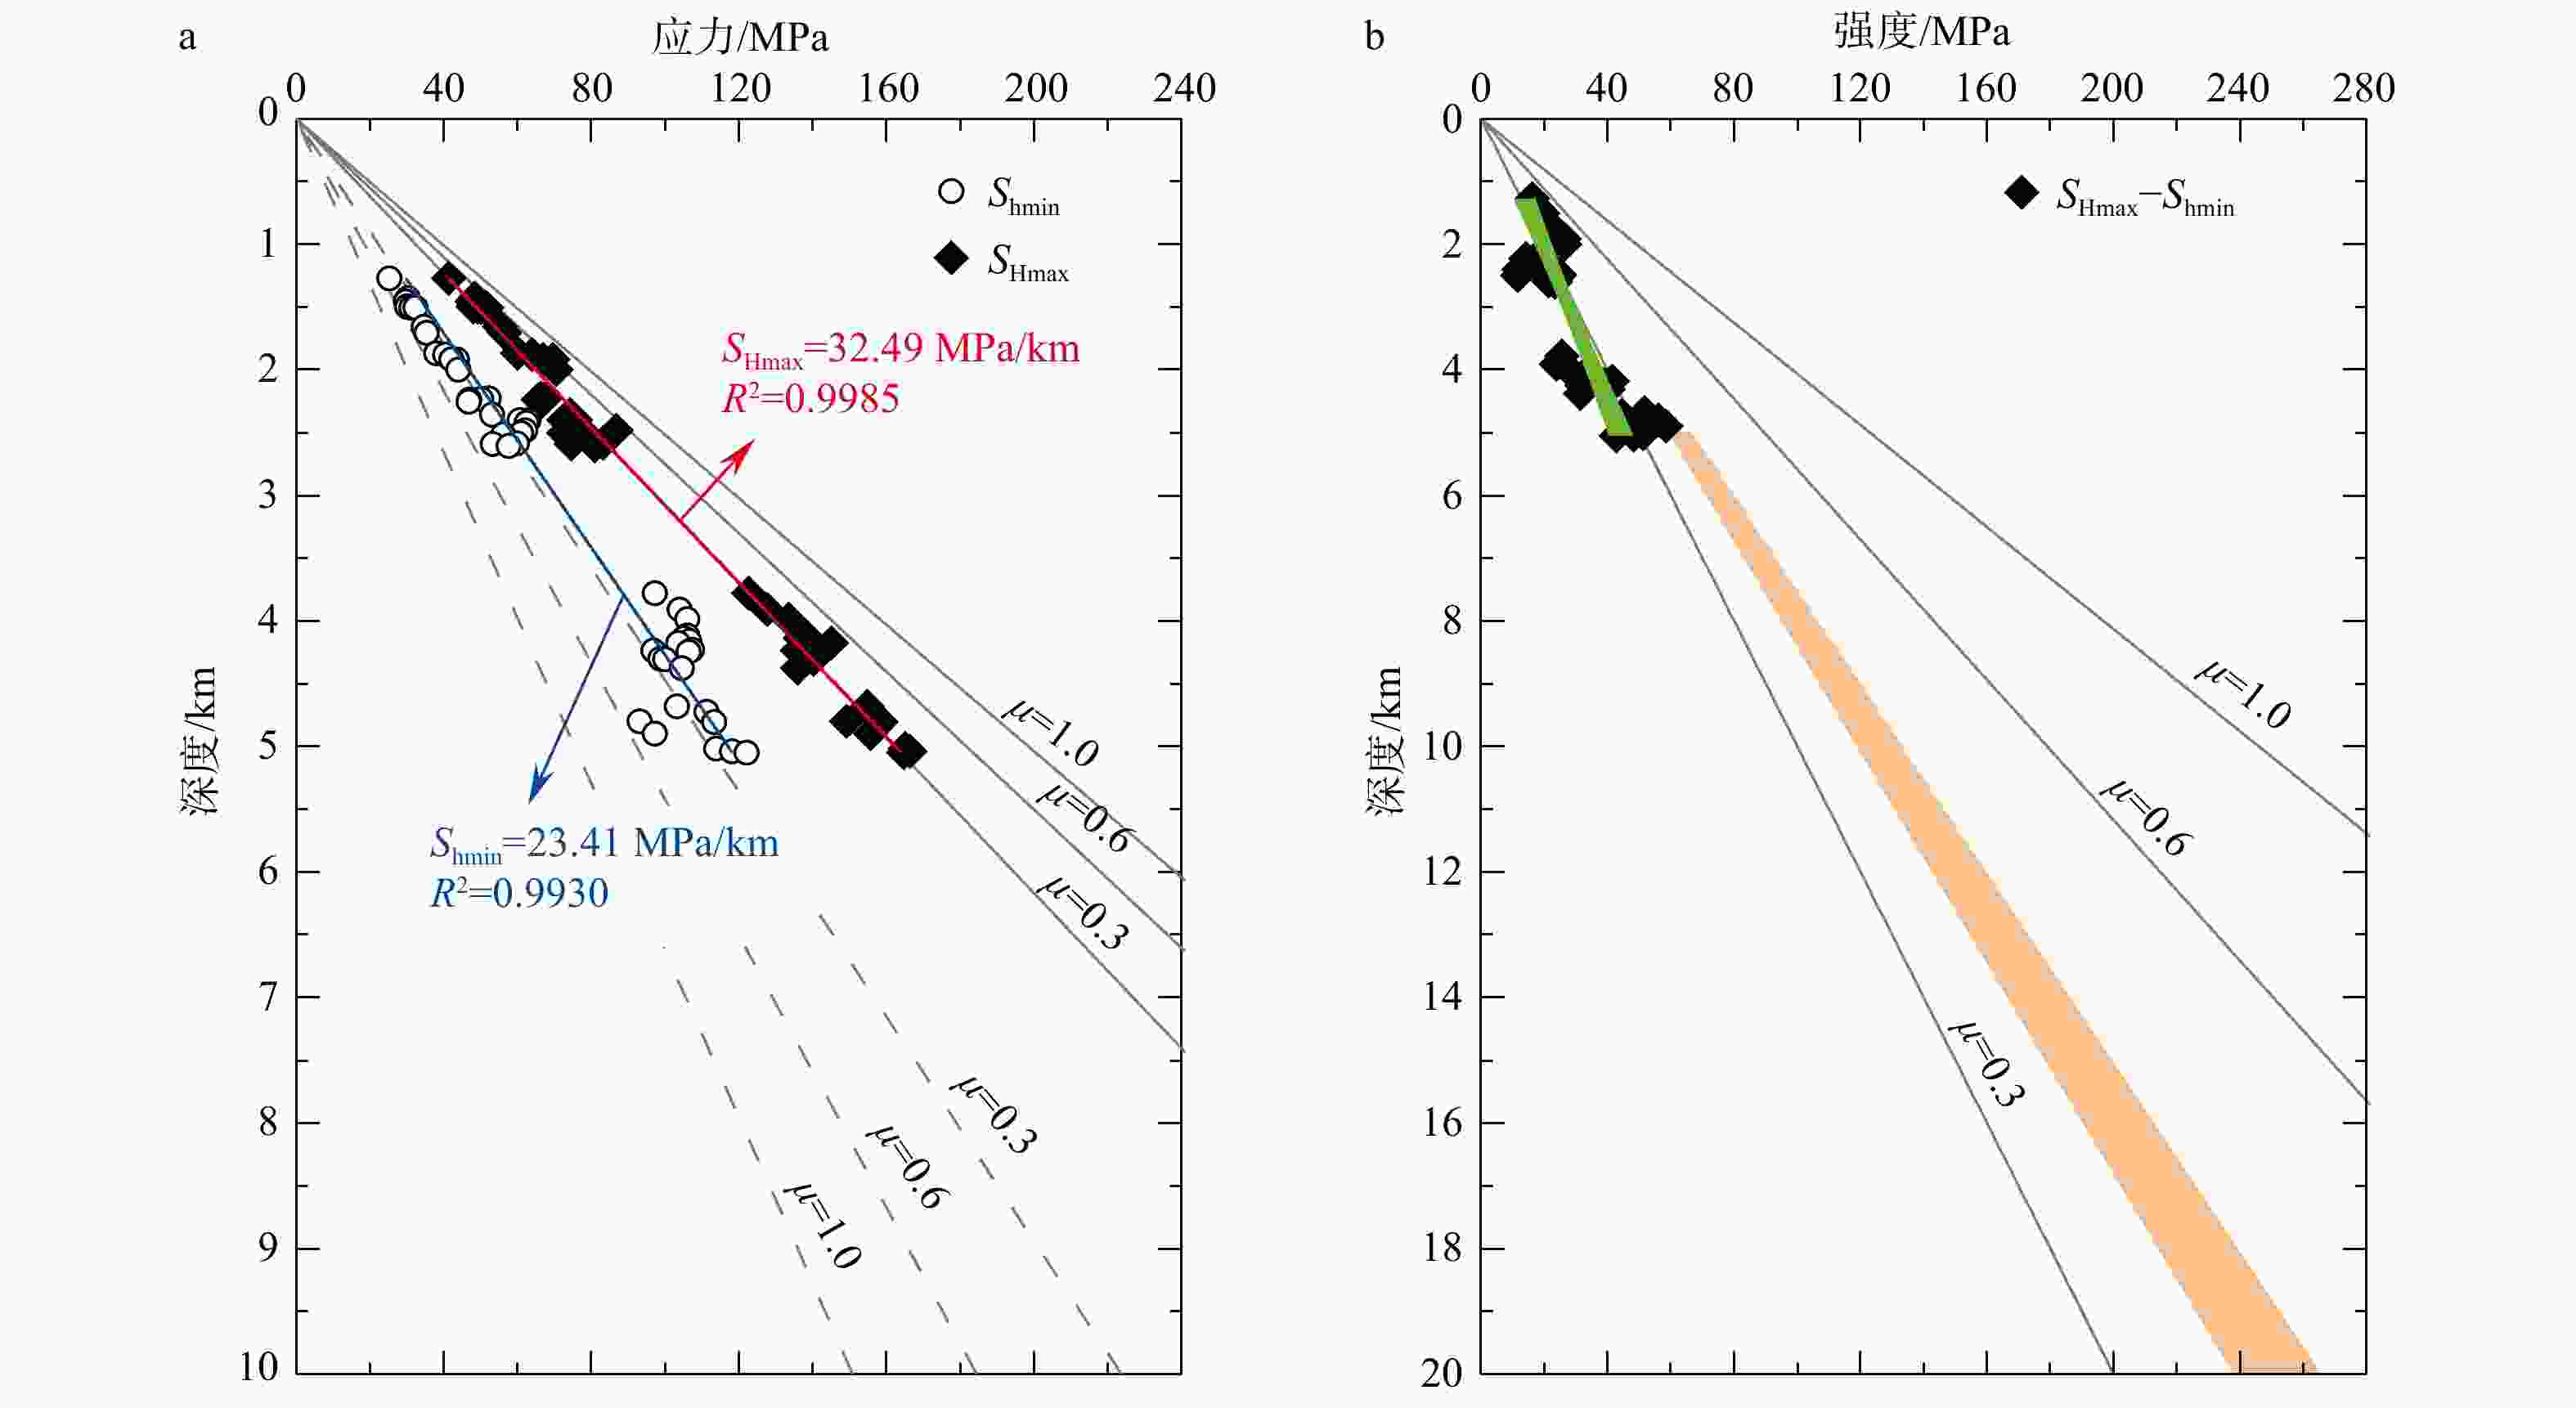
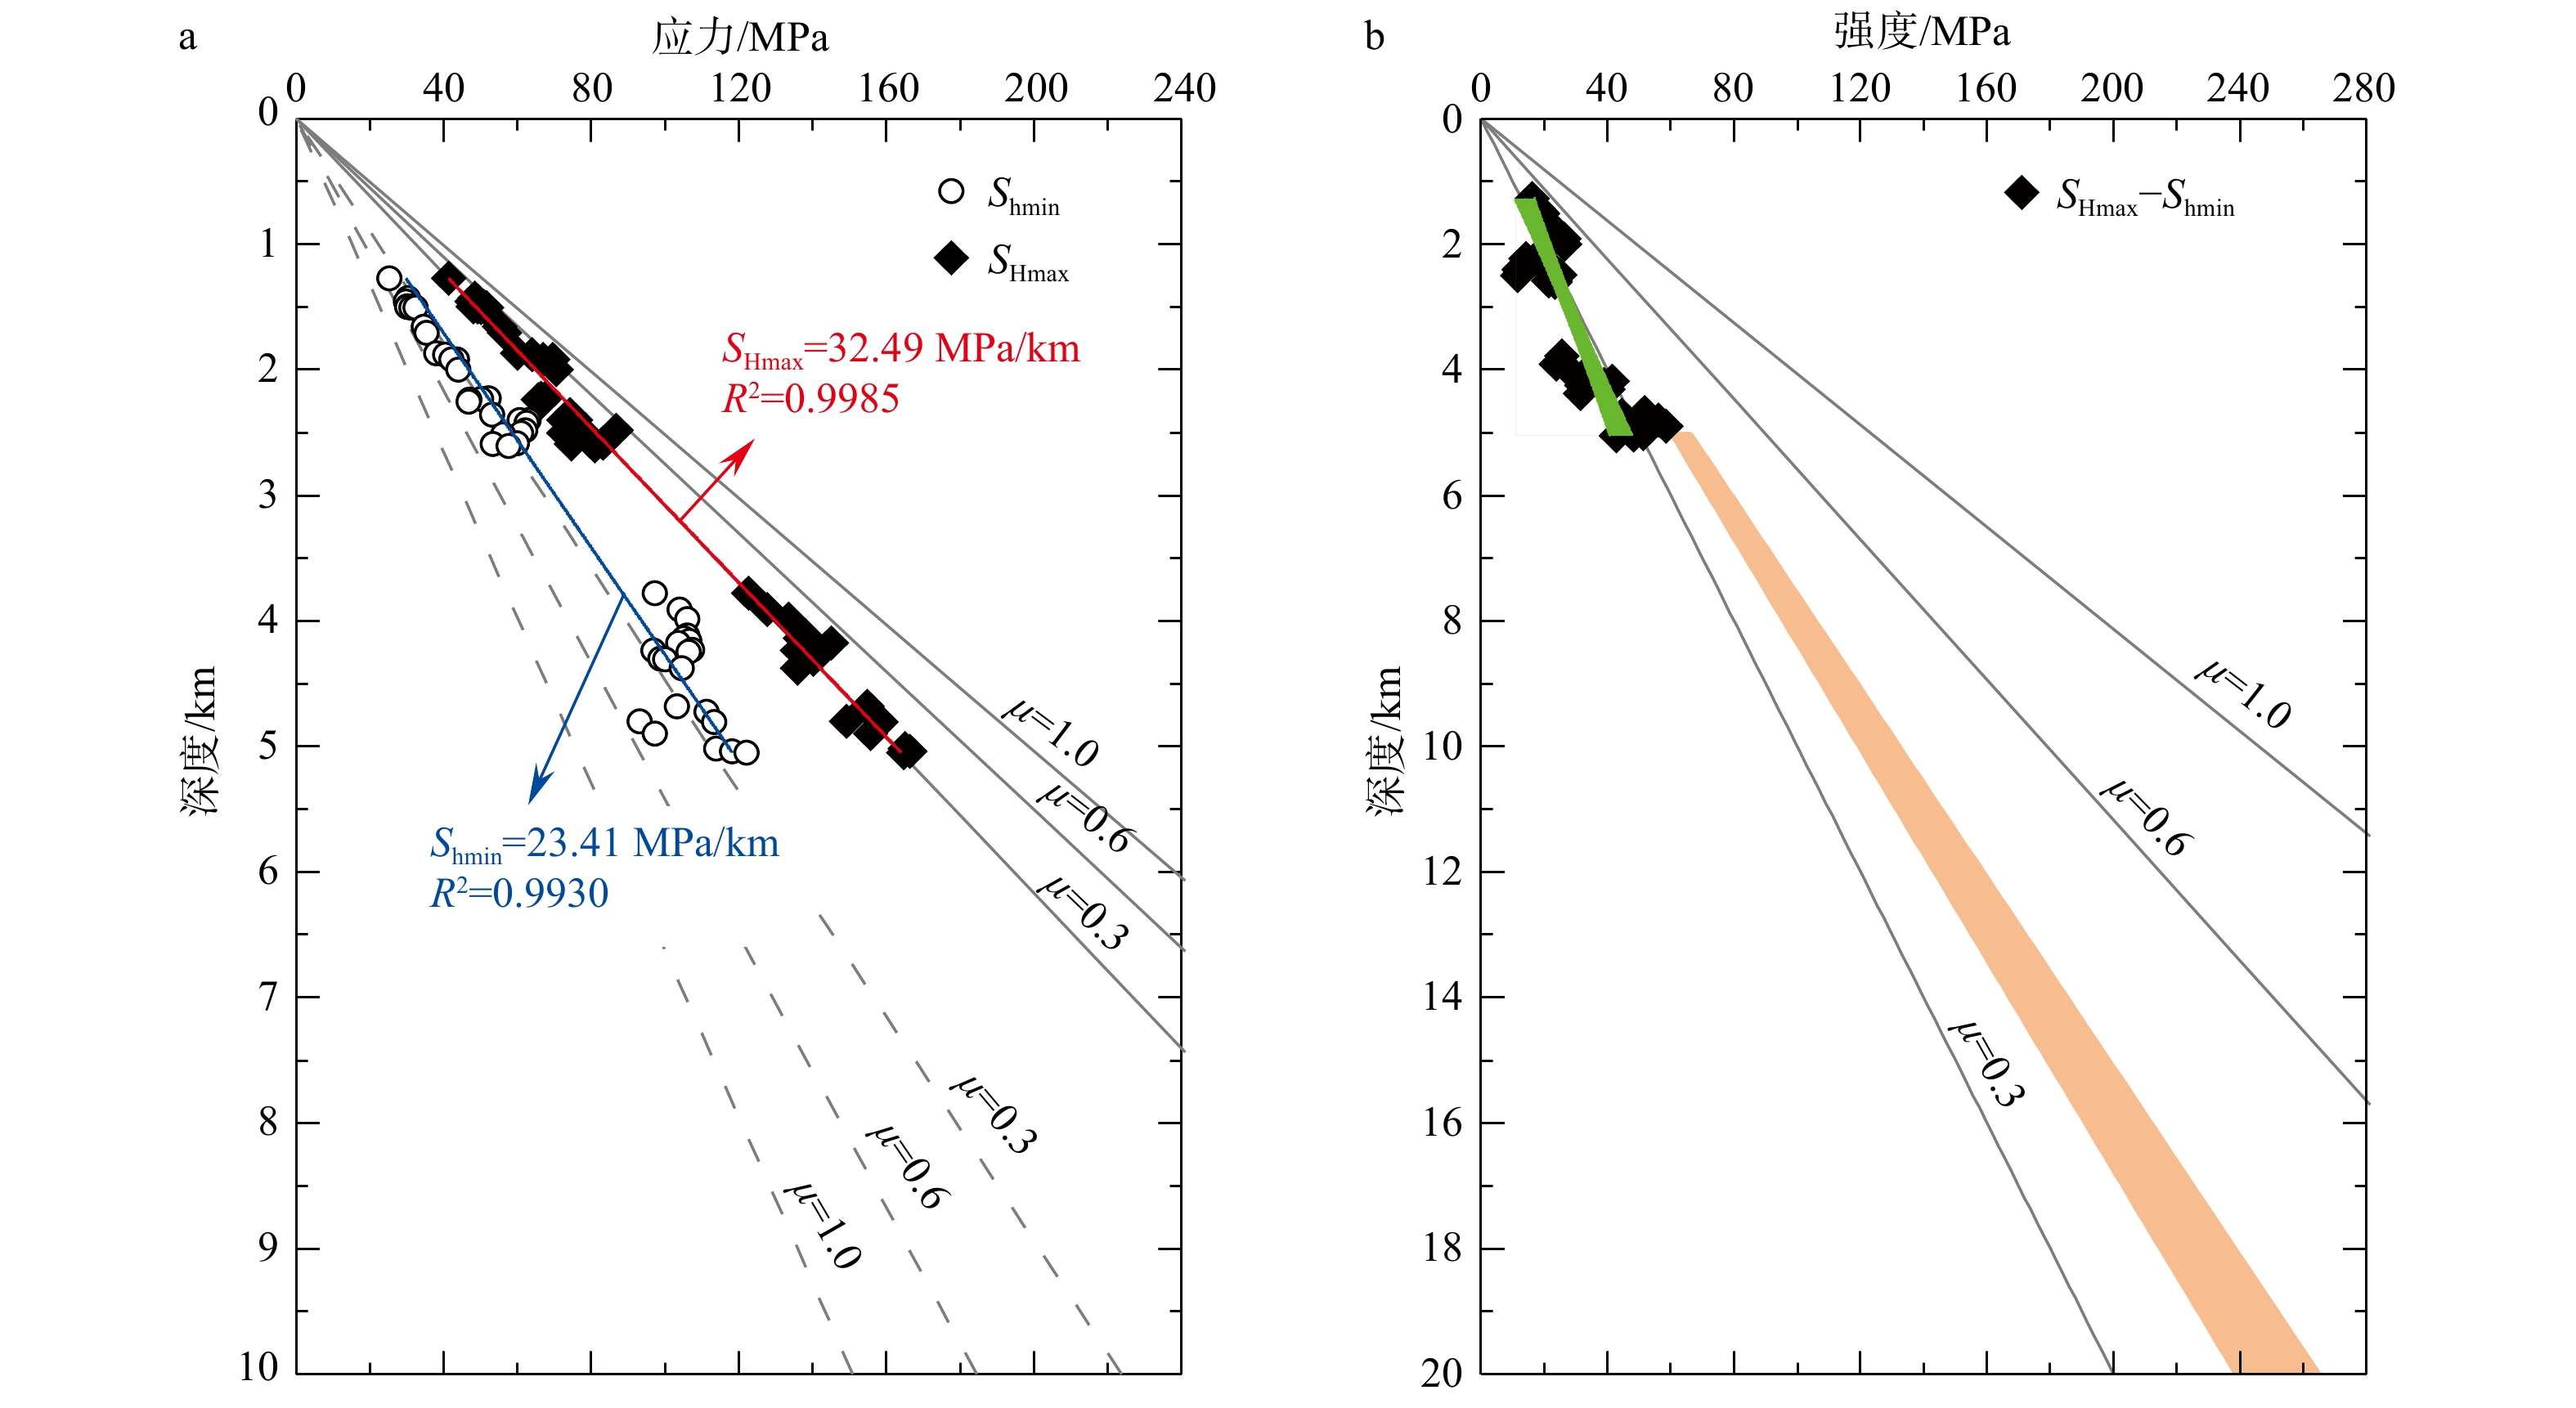
图 2 郯庐断裂带中南段脆性地壳应力值及摩擦强度
图a中红色和蓝色直线分别代表SHmax和Shmin随深度分布拟合线,灰色实线和虚线分别代表不同摩擦系数下的应力值理论值;图b中绿色区域和橘黄色区域分别代表基于钻孔测井资料和震源机制解估算得到的地壳摩擦强度95%置信度的不确定范围,灰色实线分别代表由式(3)计算得到的不同摩擦系数下的强度理论值a—中国大陆科学钻(CCSD)水平主应力值随深度分布剖面;b—脆性地壳摩擦强度
Figure 2. Stress values and frictional strength of the brittle crust
(a) Distribution of the maximum horizontal principal stress with depth in the Chinese Continental Scientific Drilling (CCSD); (b) Frictional strength of the brittle crust. In Fig 2a, red and blue lines respectively represent the fitted trends of SHmax and Shmin. The gray solid line and dashed line respectively represent theoretical values under different friction coefficients. In Fig 2b, the green and orange shaded areas represent the 95% confidence uncertainty ranges for the crustal frictional strength estimated from borehole log data and focal mechanism solutions, respectively. The solid gray lines represent the theoretical strength values under different friction coefficients calculated using Eq (3).
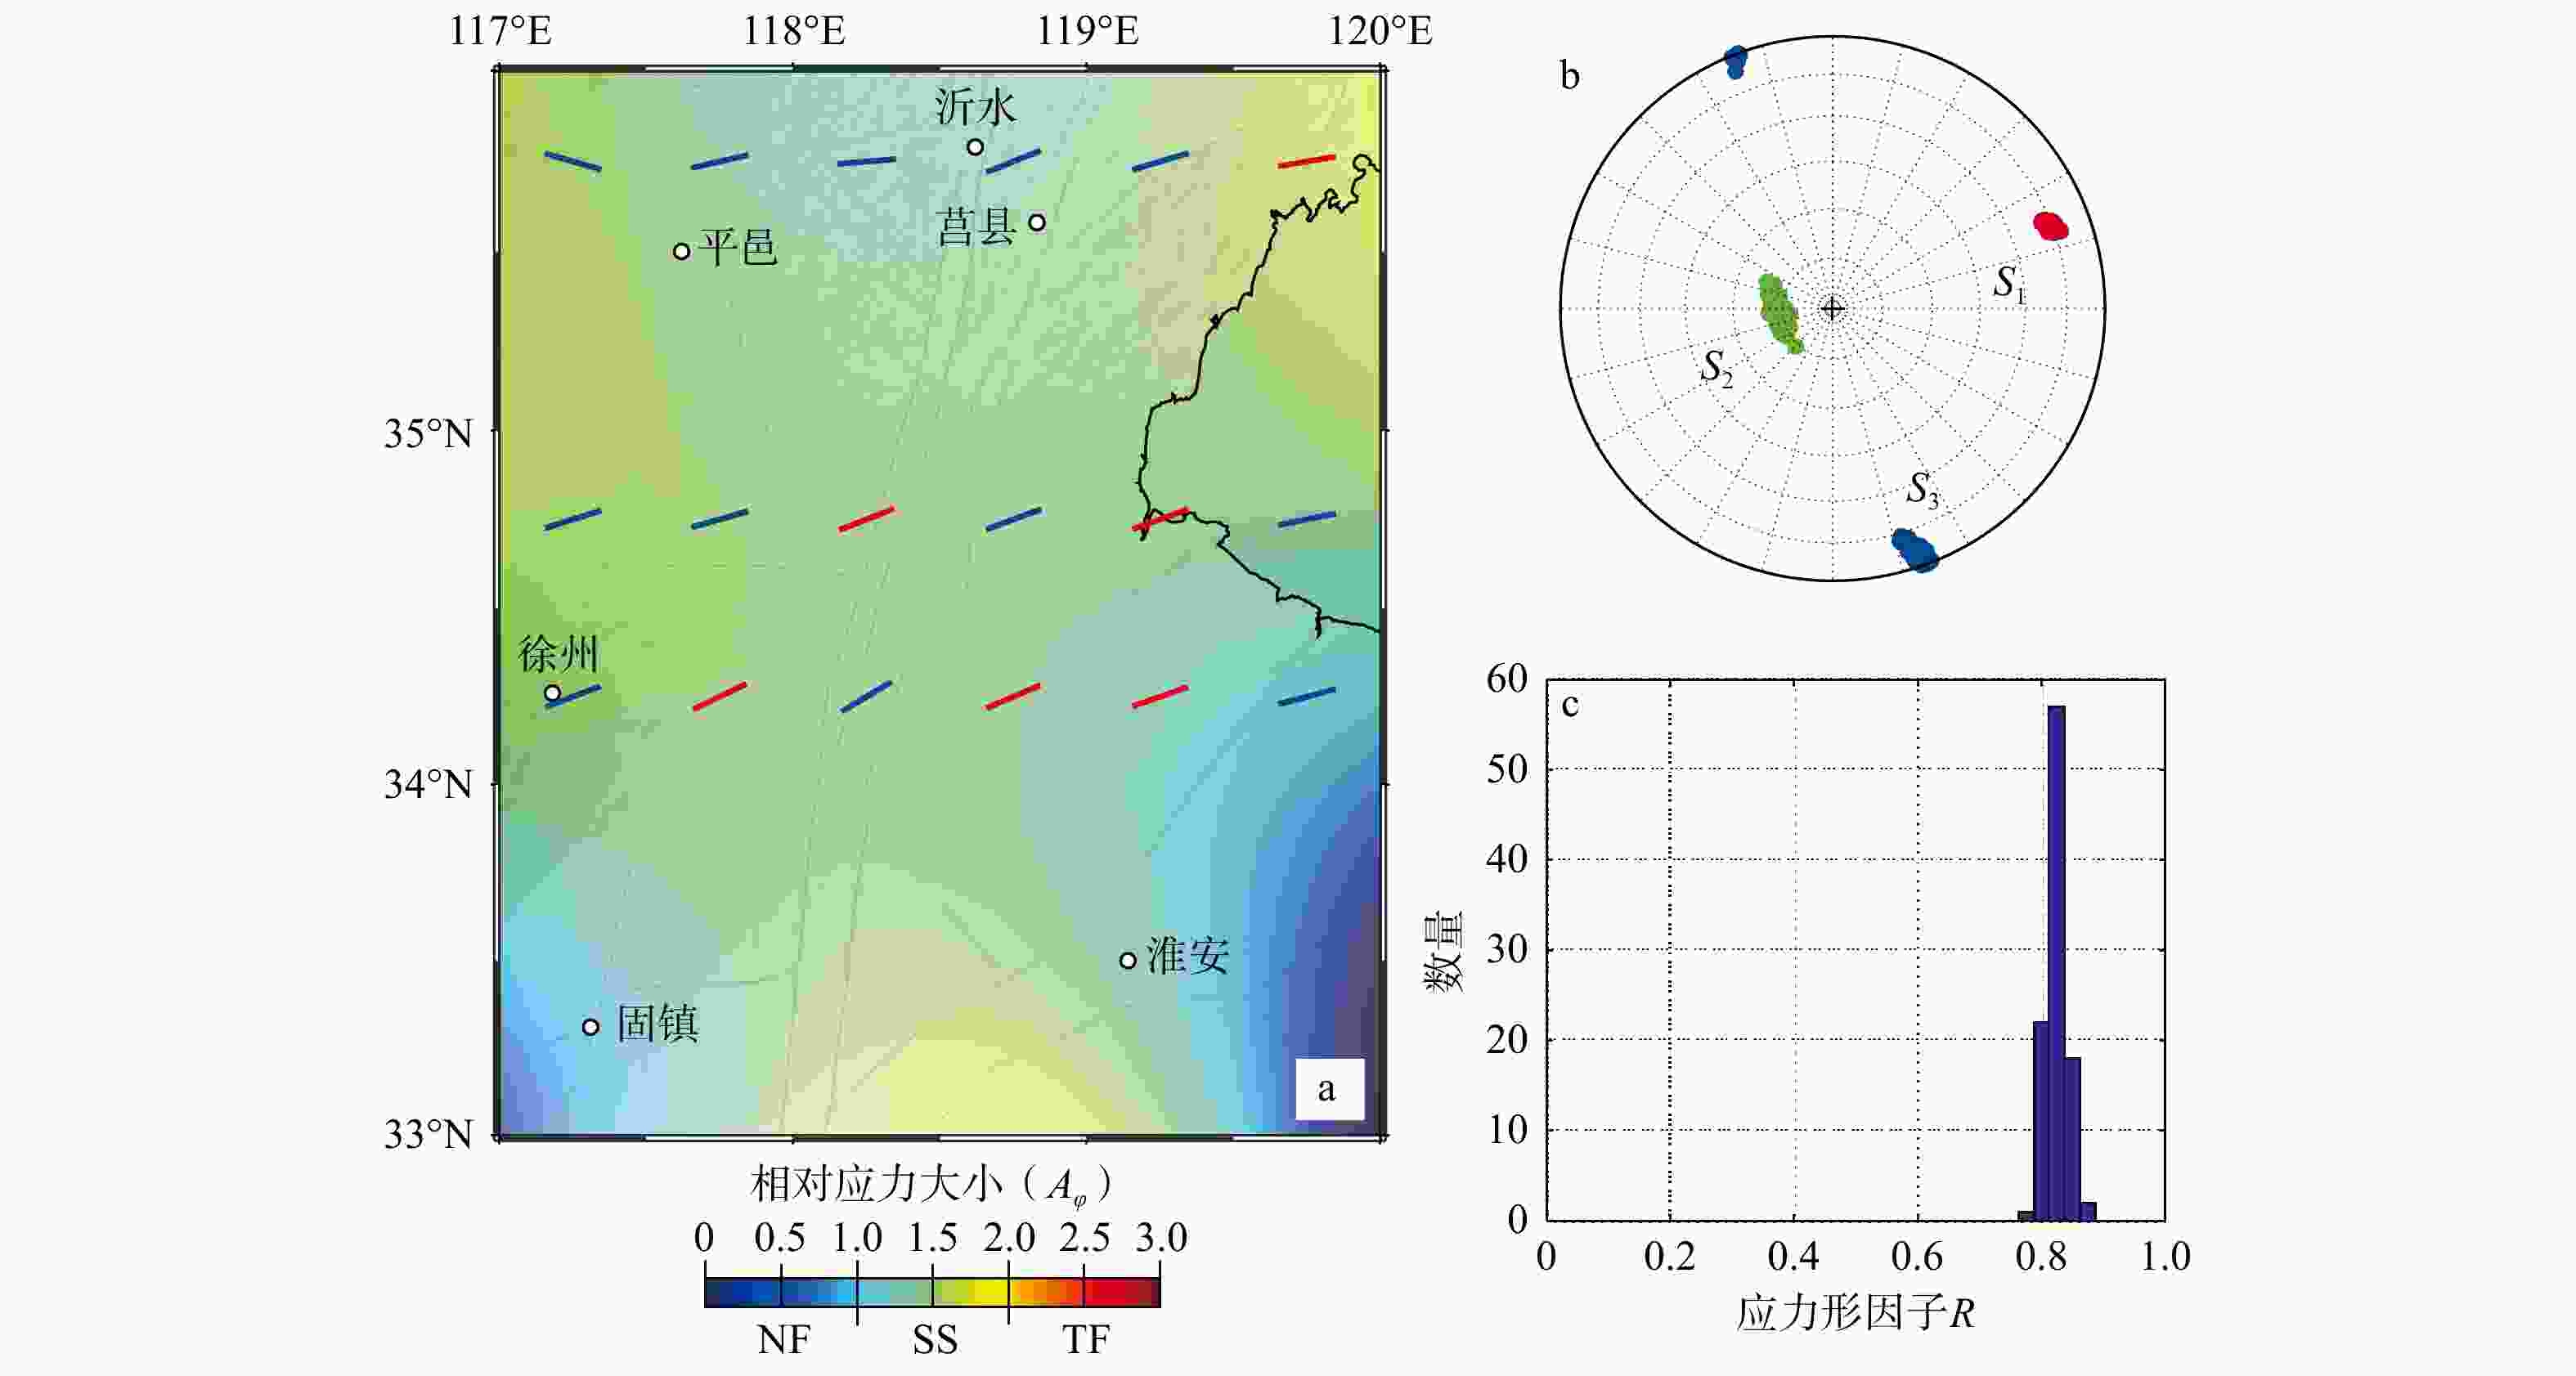
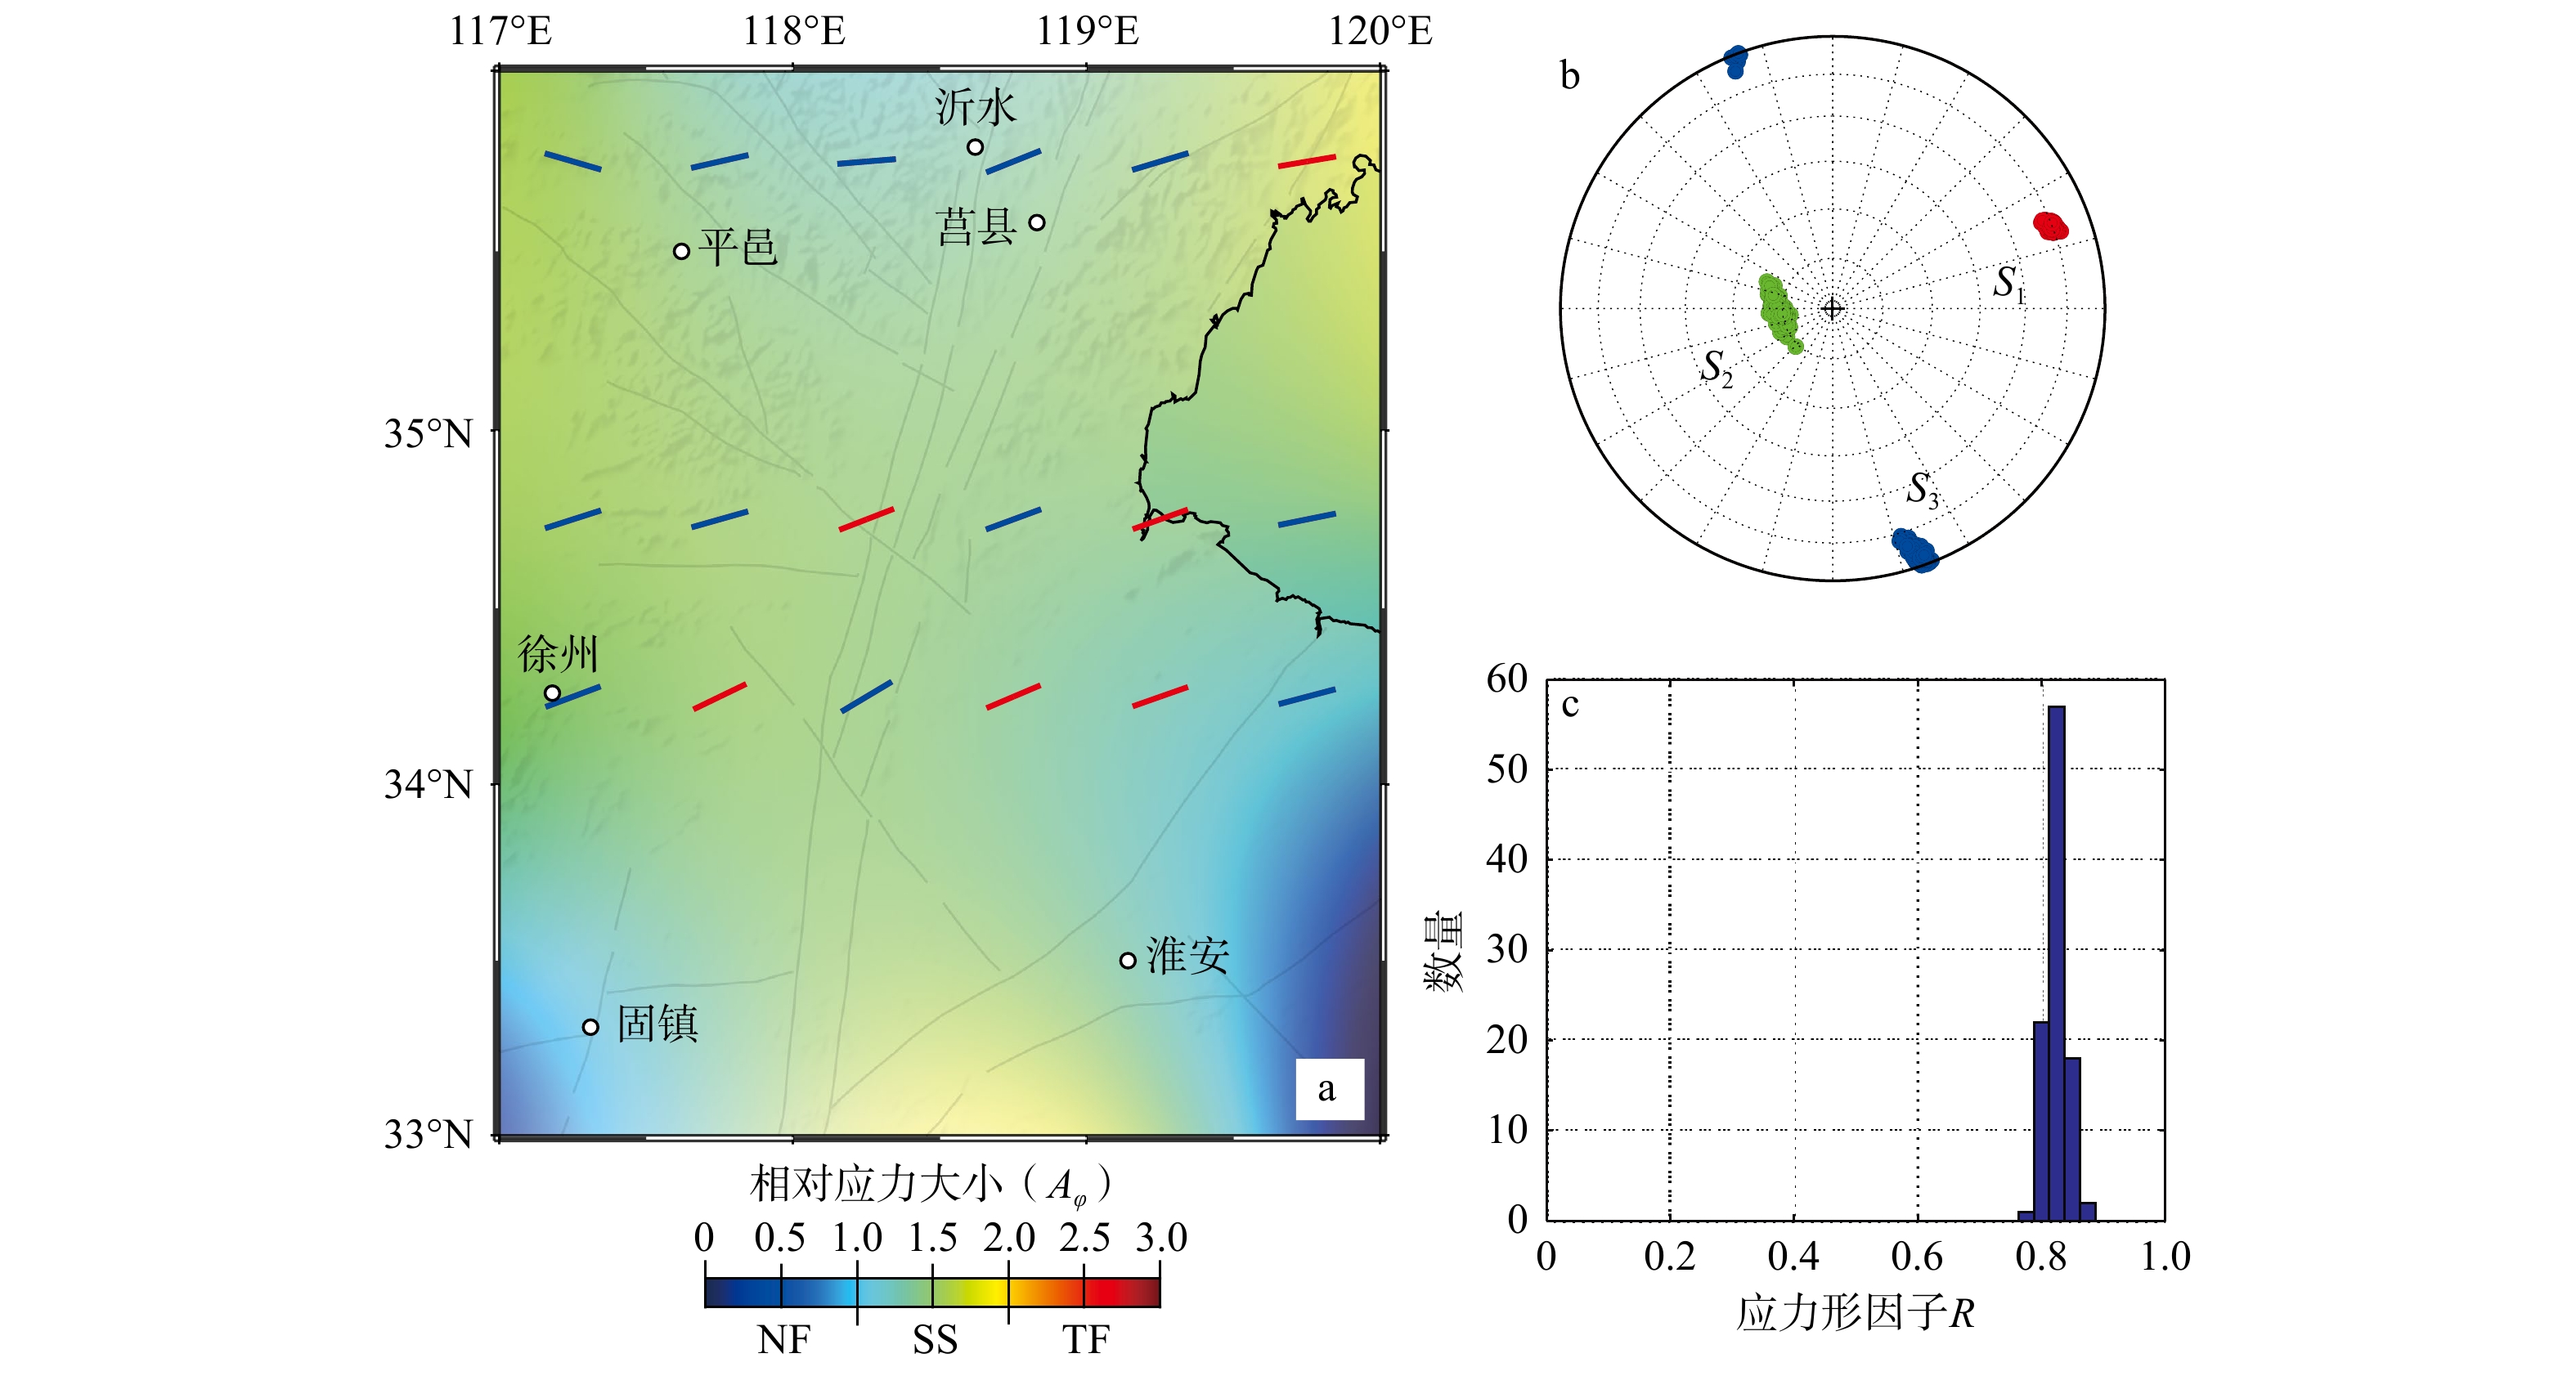
图 3 郯庐断裂带中南段构造应力场反演结果
图a中$ {A}_{\varphi } $—相对应力大小表征参数(Simpson,1997),TF—逆断型,SS—走滑型,NF—正断型;蓝色和红色粗线段代表0.5°×0.5°网格水平最大主应力方向反演结果,其中蓝色代表网格内数据不小于5条、红色代表网格内数据小于5条;图b中红色、绿色和蓝色圆点分别代表应力轴$ {S}_{1} $、 $ {S}_{2} $、 $ {S}_{3} $的方向a—相对应力大小及最大水平主应力方向;b—区域主应力方向反演结果;c—应力形因子反演结果
Figure 3. Inversion results of the tectonic stress field in the central-southern part of the Tanlu Fault Zone.
(a) Relative stress magnitude and maximum horizontal principal stress direction; (b) Regional principal stress directions from stress inversion; (c) The shape ratio (R-value) from stress inversion In Fig 1a, $ {A}_{\phi } $– a parameter for characterizing relative principal stresses (Simpson, 1997); TF– thrust faulting; SS– strike-slip faulting; NF– normal faulting; The blue and red lines represent the maximum horizontal principal stress direction inverted from 0.5°×0.5° gridded data (blue: grids with ≥5 data points; red: grids with <5 data points). In Fig 1b, red, green, and blue colors correspond to the $ {S}_{1} $, $ {S}_{2} $, and $ {S}_{3} $ stress directions, respectively.
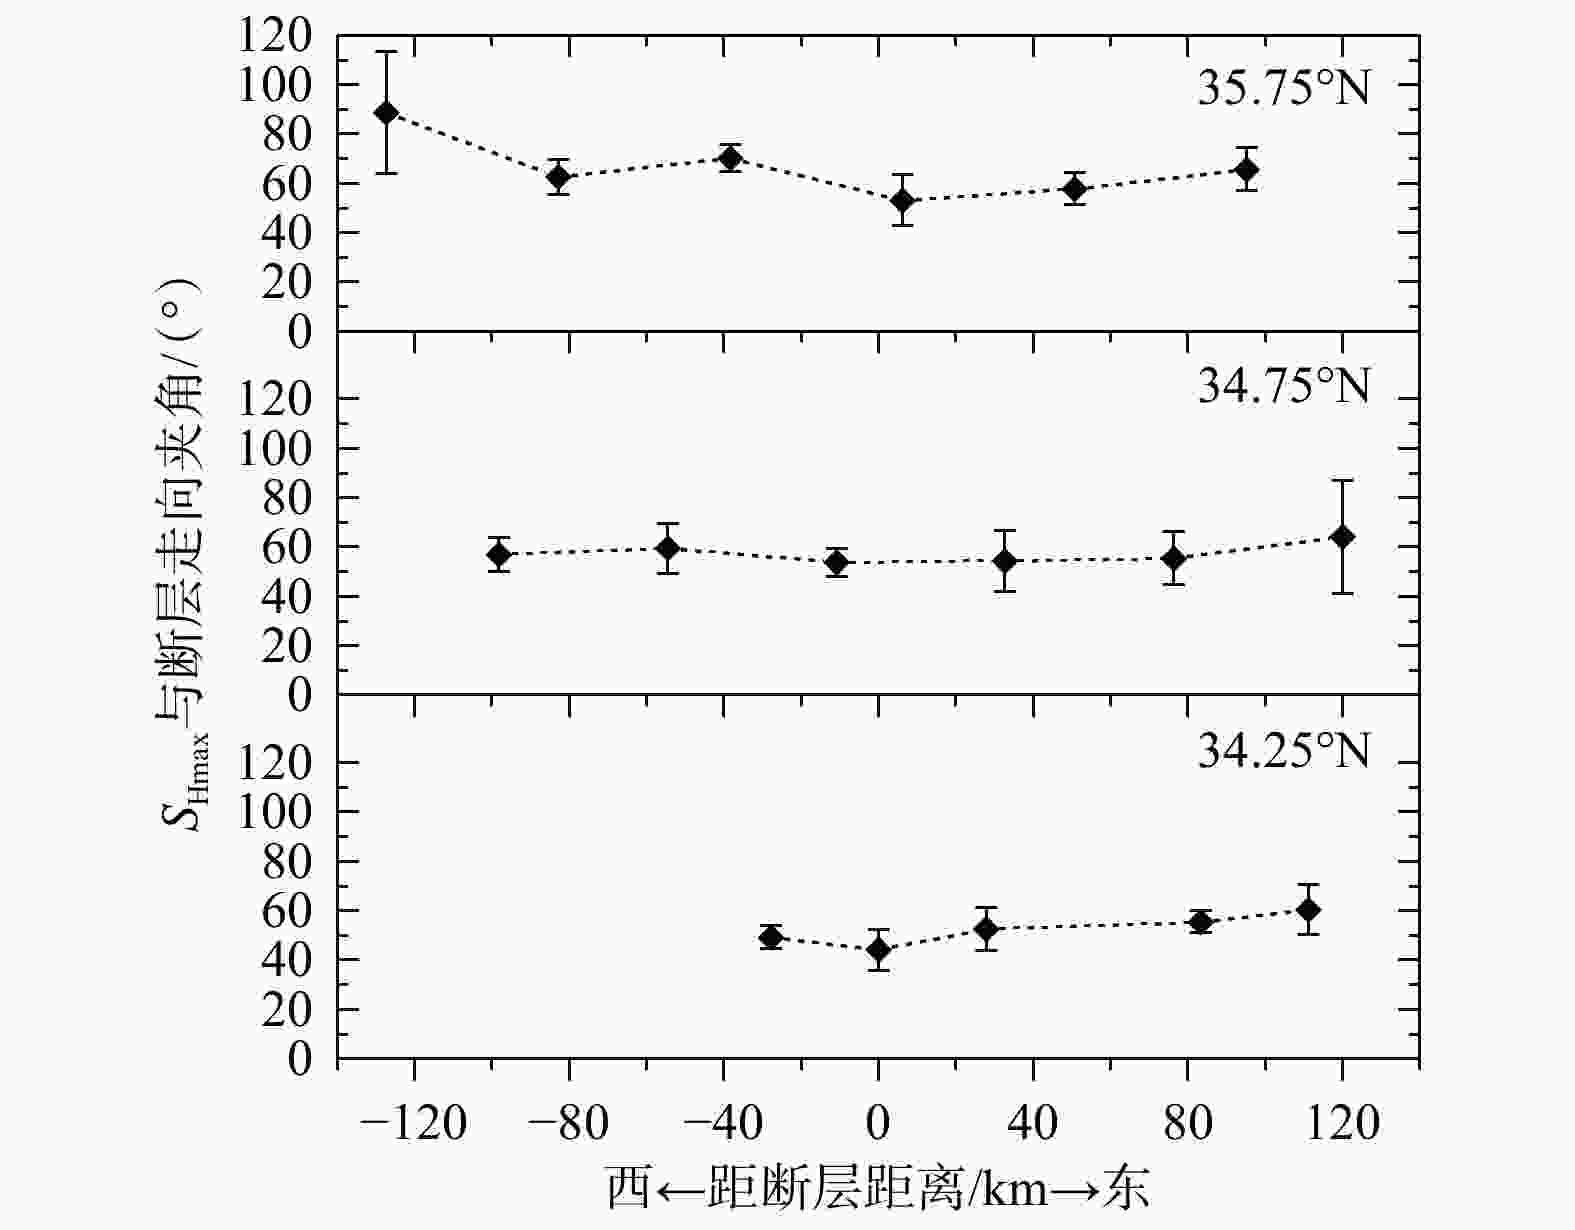
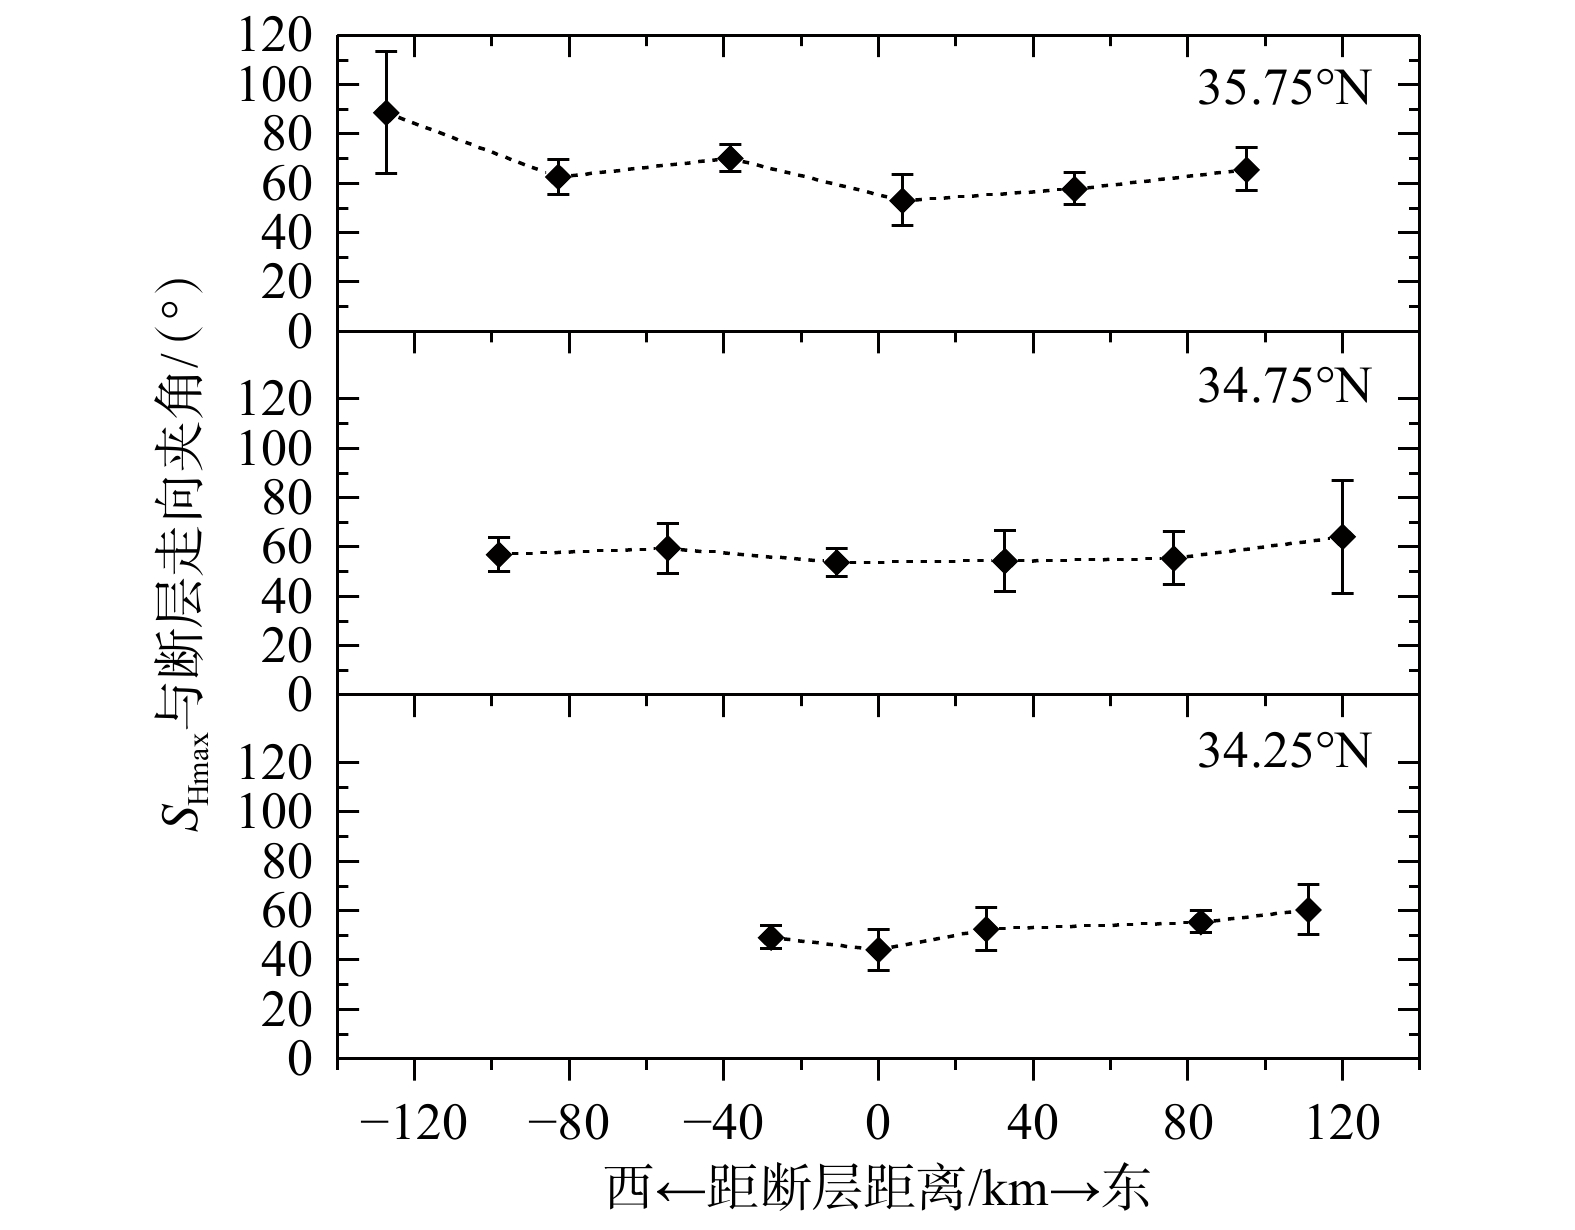
图 4 最大水平主应力方向与断层走向夹角跨断层分布剖面
各剖面原点代表对应的郯庐断裂带中心位置,垂直误差棒表示反演结果的标准差(仅绘制标准差小于25°的应力数据)
Figure 4. Cross-fault distribution profile of the angle between the maximum horizontal principal stress direction and fault strike The origin of each profile represents the corresponding central position of the Tanlu Fault Zone, and the vertical error bars indicate the standard deviation of the inversion results (Only stress data with a standard deviation below 25° is plotted).
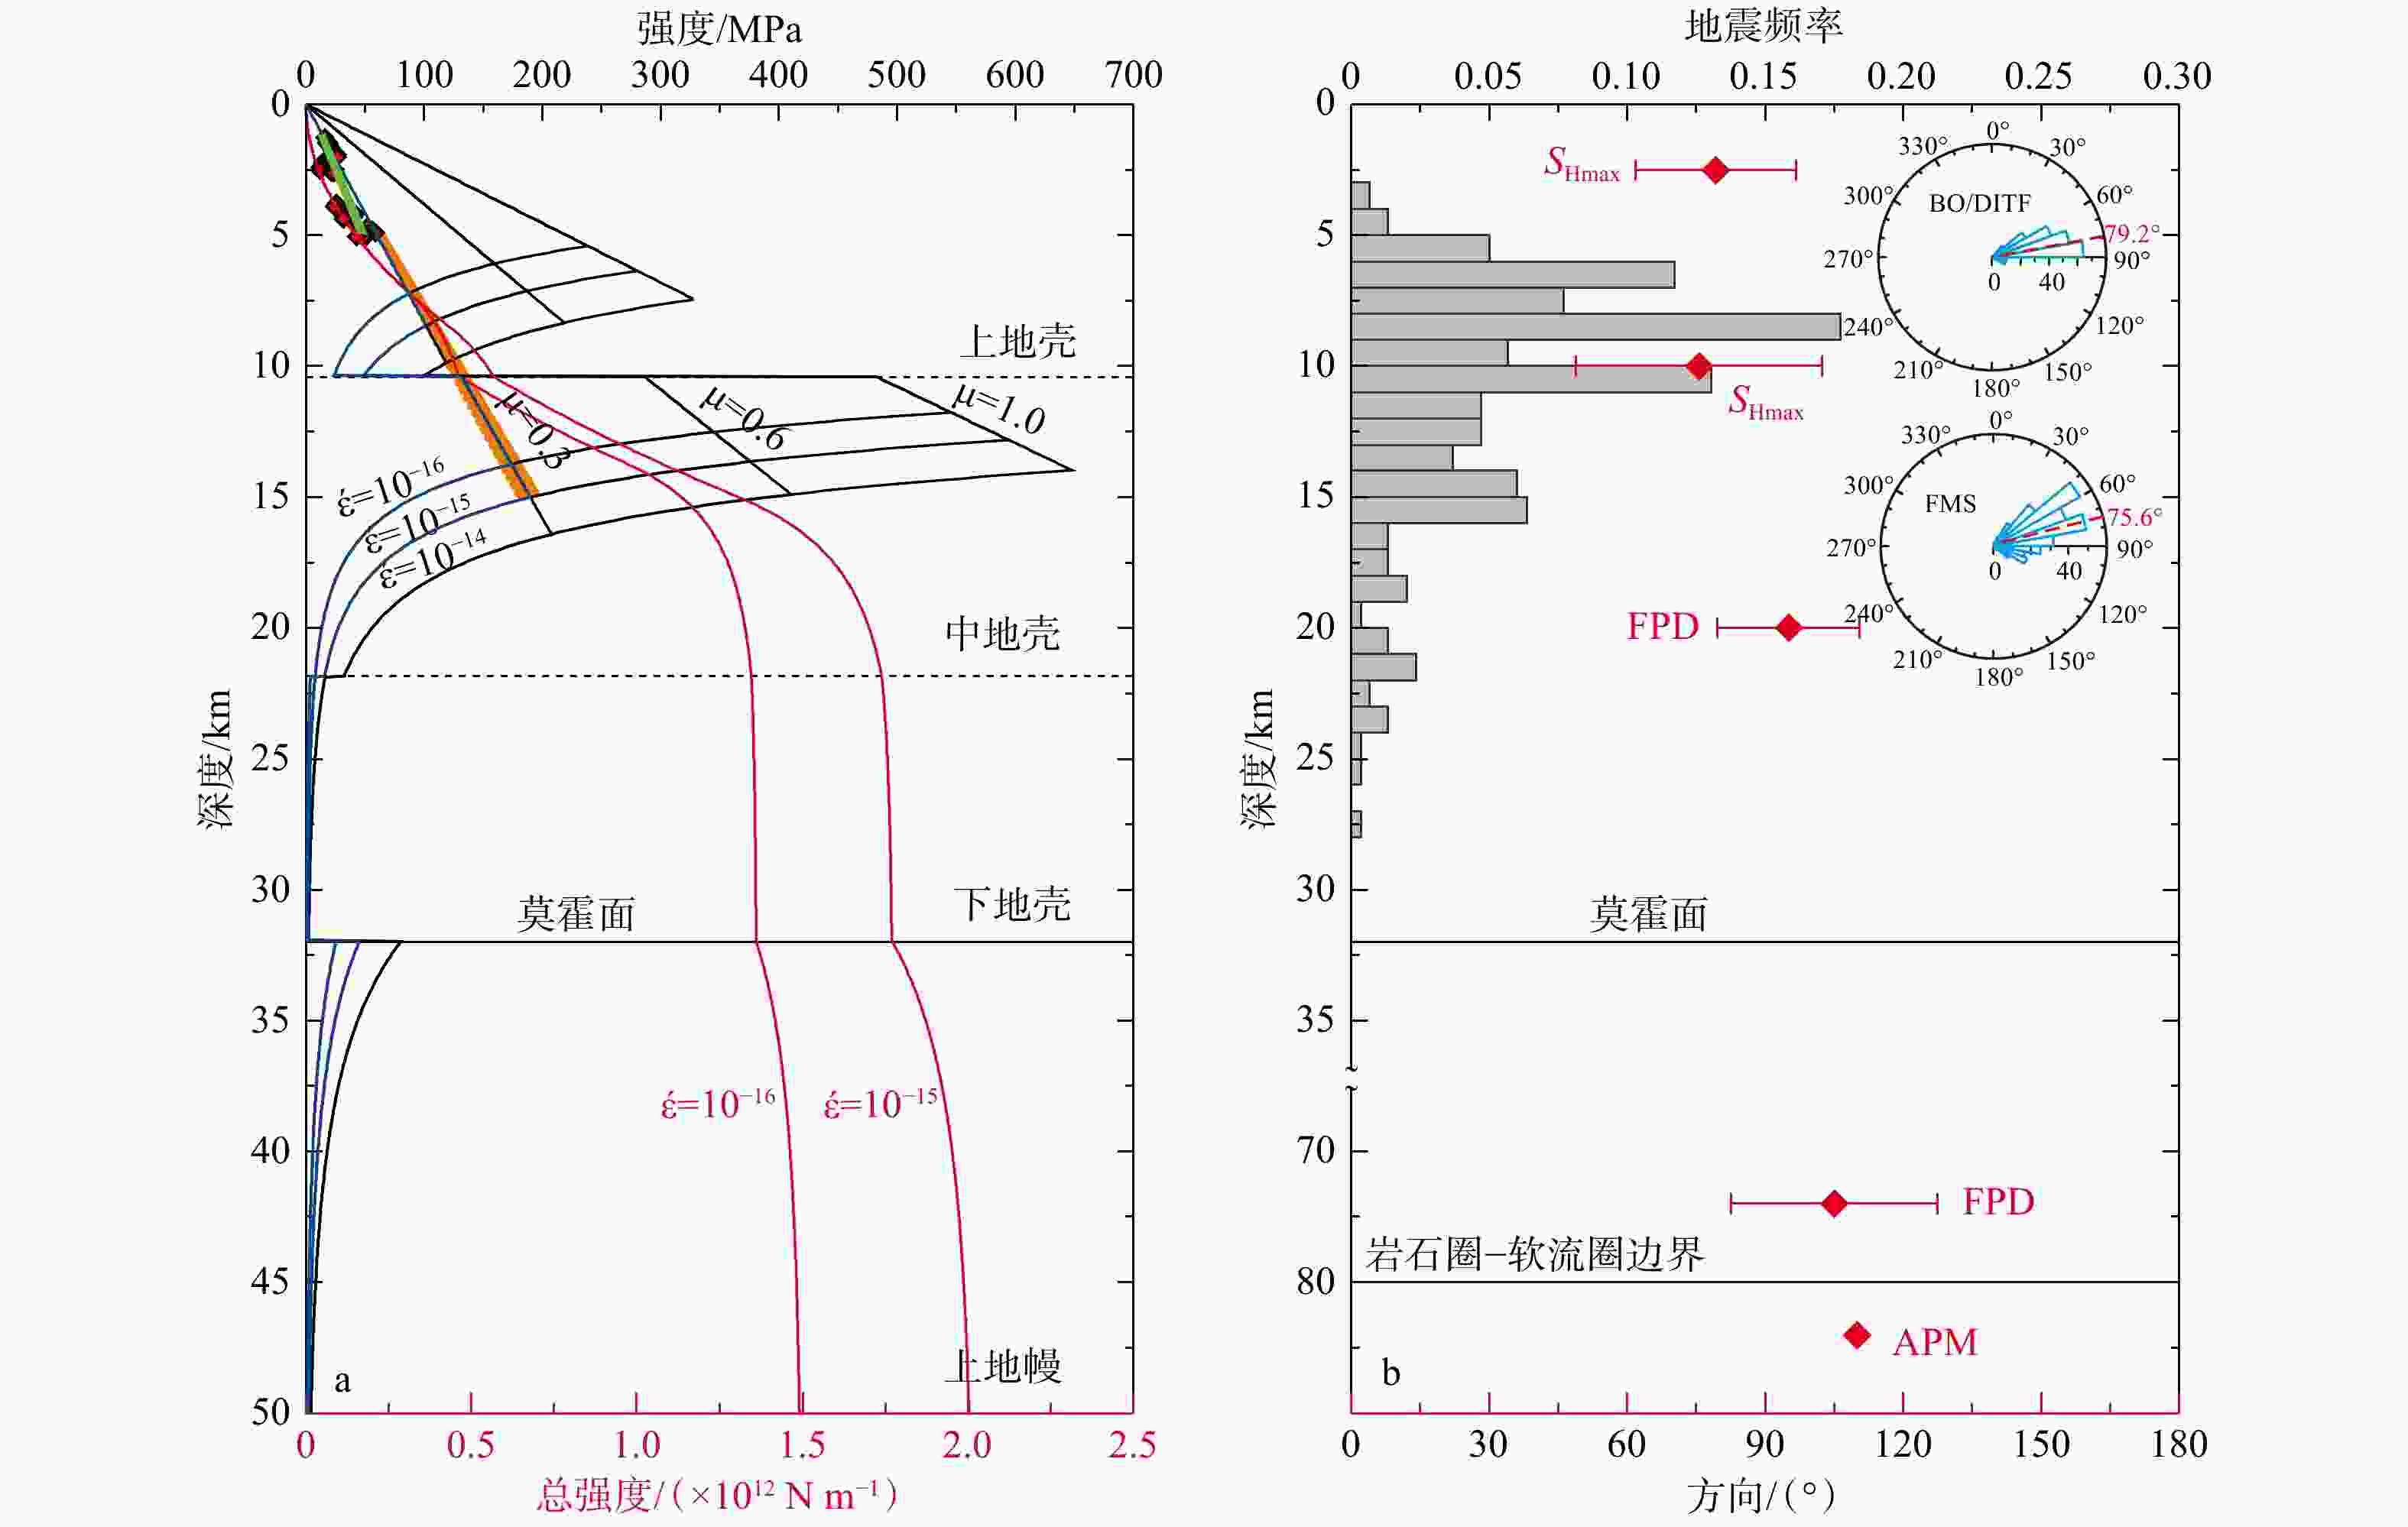
图 5 岩石圈强度剖面和地震活动随深度分布图
图a中$ \dot{\varepsilon } $为应变率,$ \mu $为断层摩擦系数;图b中右上角玫瑰花图分别代表由钻孔测井资料和震源机制解解译得到的SHmax方向,BO/DITF为钻孔崩落/诱发张裂隙;FMS为震源机制解;FPD为快波方向;APM为绝对板块运动方向a—郯庐断裂带中南段岩石圈强度剖面;b—郯庐断裂带中南段震源深度和不同分层最大水平主应力、快波方向、绝对板块运动方向分布剖面
Figure 5. Lithospheric strength profiles and distribution of earthquakes with depth.
(a) Lithospheric strength profile of the central-southern Tanlu Fault Zone; (b) Focal depth and distribution of maximum horizontal principal stress, fast-wave direction, and absolute plate motion direction in different layers In Fig 5a, $ \dot{\varepsilon } $–strain rate; $ \mu $–fault friction coefficient. In Fig 5b, The rose diagrams in the upper right illustrates the SHmax directions interpreted from borehole logging data and focal mechanism solutions. BO/DITF–borehole breakout/ drilling-induced fractures; FMS–focal mechanism solutions; FPD–fast polarization directions; APM–absolute plate motion.
表 1 基于震源机制解反演得到的应力场参数
Table 1. Stress field parameters obtained from focal mechanism solution inversion
$ {S}_{1}轴 $ $ {S}_{2} $轴 $ {S}_{3}轴 $ R值 方位角/(°) 倾伏角/(°) 方位角/(°) 倾伏角/(°) 方位角/(°) 倾伏角/(°) 68.98 15.98 277.41 71.96 161.33 8.15 0.82 (0.78~0.86)  下载: 导出CSV
表 2 不同断层及区域地壳强度模型
Table 2. Different strength models of different faults and surrounding crust
断层/断裂带 断层强度/MPa 地壳强度/MPa 参考文献 圣安德烈斯断层 ~200(μ~ 0.6) ~200(μ ~ 0.6) Scholz,2000 ~200(μ~ 0.6) ~ 20(μ < 0.1) Townend and Zoback,2001 ~20(μ < 0.1) ~ 20(μ < 0.1) Hardebeck and Michael,2004 Ridgecrest断裂带 < 10(μ < 0.05) < 10(μ< 0.05) Zhang et al.,2024 郯庐断裂带中南段 ~100(μ ~ 0.3) ~100(μ~ 0.3) 文中
下载: 导出CSV
表 3 研究区分层结构及代表性岩石蠕变参数
Table 3. Structure, composition, and rheological parameters of the study area
圈层 典型岩石* 底部深度/km# 密度/(g·cm−3)# A/(MPa−n·s−1)* n* Q/(kJ·mol−1)* 上地壳 花岗岩 10.41 2.74 1.8×10⁻⁹ 3.2 123 中地壳 斜长石 21.83 2.83 3.2×10⁻⁴ 3.2 238 下地壳 长英质麻粒岩 31.97 2.92 8.0×10⁻³ 3.1 243 岩石圈地幔 湿橄榄岩 ~80 3.26 2.0×10³ 4.0 471 注:*代表引自臧绍先等,2002;#代表引自CRUST1.0模型;A—材料常数;n—应力指数;Q—活化能
下载: 导出CSV
-
[1] BYERLEE J, 1978. Friction of rocks[J]. Pure and Applied Geophysics, 116(4-5): 615-626. doi: 10.1007/BF00876528 [2] CARTER N L, TSENN M C, 1987. Flow properties of continental lithosphere[J]. Tectonophysics, 136(1-2): 27-63. doi: 10.1016/0040-1951(87)90333-7 [3] CHEN L, CHENG C, WEI Z G, 2009. Seismic evidence for significant lateral variations in lithospheric thickness beneath the central and western North China Craton[J]. Earth and Planetary Science Letters, 286(1-2): 171-183. doi: 10.1016/j.jpgl.2009.06.022 [4] CUI J W, WANG L J, LI P W, et al., 2009. Wellbore breakouts of the main borehole of Chinese Continental Scientific Drilling (CCSD) and determination of the present tectonic stress state[J]. Tectonophysics, 475(2): 220-225. doi: 10.1016/j.tecto.2009.03.021 [5] DENG Y F, FAN W M, ZHANG Z J, BADAL J. , 2013. Geophysical evidence on segmentation of the Tancheng-Lujiang fault and its implications on the lithosphere evolution in East China[J]. Journal of Asian Earth Sciences, 78, 263-276. [6] FENG J K, YAO H J, CHEN L, et al., 2022. Ongoing lithospheric alteration of the North China Craton revealed by surface-wave tomography and geodetic observations[J]. Geophysical Research Letters, 49(14): e2022GL099403. doi: 10.1029/2022GL099403 [7] GAO Y, WU J, YI G X, et al., 2010. Crust-mantle coupling in North China: preliminary analysis from seismic anisotropy[J]. Chinese Science Bulletin, 55(31): 3599-3605. doi: 10.1007/s11434-010-4135-y [8] GRIPP A E, GORDON R G, 2002. Young tracks of hotspots and current plate velocities[J]. Geophysical Journal International, 150(2): 321-361. doi: 10.1046/j.1365-246X.2002.01627.x [9] HARDEBECK J L, SHEARER P M, 2002. A new method for determining first-motion focal mechanisms[J]. Bulletin of the Seismological Society of America, 92(6): 2264-2276. doi: 10.1785/0120010200 [10] HARDEBECK J L, SHEARER P M, 2003. Using S/P amplitude ratios to constrain the focal mechanisms of small earthquakes[J]. Bulletin of the Seismological Society of America, 93(6): 2434-2444. doi: 10.1785/0120020236 [11] HARDEBECK J L, MICHAEL A J, 2004. Stress orientations at intermediate angles to the San Andreas Fault, California[J]. Journal of Geophysical Research: Solid Earth, 109(B11): B11303. [12] HARDEBECK J L, MICHAEL A J, 2006. Damped regional-scale stress inversions: methodology and examples for southern California and the Coalinga aftershock sequence[J]. Journal of Geophysical Research: Solid Earth, 111(B11): B11310. [13] HASEGAWA A, YOSHIDA K, OKADA T, 2011. Nearly complete stress drop in the 2011 MW 9.0 off the Pacific coast of Tohoku Earthquake[J]. Earth, Planets and Space, 63(7): 35. [14] HUANG B, KUSKY T M, JOHNSON T E, et al., 2020. Paired metamorphism in the Neoarchean: a record of accretionary-to-collisional orogenesis in the North China Craton[J]. Earth and Planetary Science Letters, 543: 116355. doi: 10.1016/j.jpgl.2020.116355 [15] HUANG Z C, WANG L S, ZHAO D P, et al., 2011. Seismic anisotropy and mantle dynamics beneath China[J]. Earth and Planetary Science Letters, 306(1-2): 105-117. doi: 10.1016/j.jpgl.2011.03.038 [16] JIANG G Z, HU S B, SHI Y Z, et al., 2019. Terrestrial heat flow of continental China: updated dataset and tectonic implications[J]. Tectonophysics, 753: 36-48. doi: 10.1016/j.tecto.2019.01.006 [17] JIN J Q, LUO S, YAO H J, et al., 2023. Dense array ambient noise tomography reveals the shallow crustal velocity structure and deformation features in the Weifang segment of the Tanlu fault zone[J]. Chinese Journal of Geophysics, 66(2): 558-575. (in Chinese with English abstract) [18] KIRBY S H, 1983. Rheology of the lithosphere[J]. Reviews of Geophysics, 21(6): 1458-1487. doi: 10.1029/RG021i006p01458 [19] KOHLSTEDT D L, EVANS B, MACKWELL S J, 1995. Strength of the lithosphere: constraints imposed by laboratory experiments[J]. Journal of Geophysical Research: Solid Earth, 100(B9): 17587-17602. doi: 10.1029/95JB01460 [20] LI J H, DONG S W, CAWOOD P A, et al., 2023. Cretaceous long-distance lithospheric extension and surface response in South China[J]. Earth-Science Reviews, 243: 104496. doi: 10.1016/j.earscirev.2023.104496 [21] LIU Q Y, ZHANG L Y, ZHANG C, et al., 2016. Lithospheric thermal structure of the North China Craton and its geodynamic implications[J]. Journal of Geodynamics, 102: 139-150. doi: 10.1016/j.jog.2016.09.005 [22] LUO M, GLOVER P W J, PAN H P, 2019. A reassessment of the stress and natural fracture orientations from analysis of image logs in the Chinese Continental Scientific Drilling Program borehole at Donghai county, Jiangsu province, China[J]. Journal of Asian Earth Sciences, 169: 11-20. doi: 10.1016/j.jseaes.2018.10.014 [23] MARTÍNEZ-GARZÓN P, KWIATEK G, ICKRATH M, et al., 2014. MSATSI: a MATLAB package for stress inversion combining solid classic methodology, a new simplified user-handling, and a visualization tool[J]. Seismological Research Letters, 85(4): 896-904. doi: 10.1785/0220130189 [24] MENG W, LIN W R, CHEN Q C, et al., 2023. Spatial and temporal stress variations before and after the 2008 Wenchuan MW 7.9 Earthquake and its implications: a study based on borehole stress data[J]. Acta Geologica Sinica - English Edition, 97(1): 226-242. doi: 10.1111/1755-6724.14965 [25] MIAO W P, NIU F L, CHEN H C, 2023. Sharp changes of crustal seismic anisotropy across the central Tanlu fault zone in East China[J]. Geophysical Research Letters, 50(1): e2022GL099184. doi: 10.1029/2022GL099184 [26] NI H Y, LIU Z M, HE K, 2013. Study on focal mechanisms of moderate-small earthquakes and characteristics of recent tectonic stress field in the Anhui sector of Tanlu fault zone[J]. China Earthquake Engineering Journal, 35(3): 677-683. (in Chinese with English abstract) [27] PASQUALE V, CHIOZZI P, VERDOYA M, 2010. Tectonothermal processes and mechanical strength in a recent orogenic belt: northern Apennines[J]. Journal of Geophysical Research: Solid Earth, 115(B3): B03301. [28] RANALLI G, 1991. Regional variations in lithosphere rheology from heat flow observations[M]//ČERMÁK V, RYBACH L. Terrestrial heat flow and the lithosphere structure. Berlin: Springer: 1-22. [29] SCHOLZ C H, 1988. The brittle-plastic transition and the depth of seismic faulting[J]. Geologische Rundschau, 77(1): 319-328. doi: 10.1007/BF01848693 [30] SCHOLZ C H, 2000. Evidence for a strong San Andreas fault[J]. Geology, 28(2): 163-166. doi: 10.1130/0091-7613(2000)28<163:EFASSA>2.0.CO;2 [31] SCHOLZ C H, 2002. The mechanics of earthquakes and faulting[M]. 2nd ed. Cambridge: Cambridge University Press: 504. [32] SIMPSON R W, 1997. Quantifying Anderson’s fault types[J]. Journal of Geophysical Research: Solid Earth, 102(B8): 17909-17919. doi: 10.1029/97JB01274 [33] SUN Y J, DONG S W, FAN T Y, et al., 2013. 3D rheological structure of the continental lithosphere beneath China and adjacent regions[J]. Chinese Journal of Geophysics, 56(9): 2936-2946. (in Chinese with English abstract) [34] SUN Y J, HUANG Y, JIANG H L, et al., 2015. Tectonic stress field and segmention characteristics in the Shandong-Jiangsu-Anhui segment of the Tancheng-Lujiang fault zone[J]. Earthquake, 35(3): 66-75. (in Chinese with English abstract) [35] TAPPONNIER P, MOLNAR P, 1977. Active faulting and tectonics in China[J]. Journal of Geophysical Research, 82(20): 2905-2930. doi: 10.1029/JB082i020p02905 [36] TIAN F F, LEI J S, XU X W, 2020. Teleseismic P-wave crustal tomography of the Weifang segment on the Tanlu fault zone: a case study based on short-period dense seismic array experiment[J]. Physics of the Earth and Planetary Interiors, 306: 106521. doi: 10.1016/j.pepi.2020.106521 [37] TOWNEND J, ZOBACK M D, 2001. Implications of earthquake focal mechanisms for the frictional strength of the San Andreas fault system[M]//HOLDSWORTH R E, STRACHAN R A, MAGLOUGHLIN J F, et al. The nature and tectonic significance of fault zone weakening. London: Geological Society: 13-21. [38] VAVRYČUK V, 2014. Iterative joint inversion for stress and fault orientations from focal mechanisms[J]. Geophysical Journal International, 199(1): 69-77. doi: 10.1093/gji/ggu224 [39] WANG M, SHEN Z K, 2020. Present-day crustal deformation of continental China derived from GPS and its tectonic implications[J]. Journal of Geophysical Research: Solid Earth, 125(2): e2019JB018774. doi: 10.1029/2019JB018774 [40] WANG X F, LI Z J, CHEN B L, et al. , 2000. Tanlu fault belt[M]. Beijing: Geological Publishing House. (in Chinese) [41] WANG Y, 2001. Heat flow pattern and lateral variations of lithosphere strength in China mainland: constraints on active deformation[J]. Physics of the Earth and Planetary Interiors, 126(3-4): 121-146. doi: 10.1016/S0031-9201(01)00251-5 [42] WEERTMAN J, 1970. The creep strength of the Earth's mantle[J]. Reviews of Geophysics, 8(1): 145-168. doi: 10.1029/RG008i001p00145 [43] WIBBERLEY C A J, YIELDING G, DI TORO G, 2008. Recent advances in the understanding of fault zone internal structure: a review[M]//WIBBERLEY C A J, KURZ W, IMBER J, et al. The internal structure of fault zones: implications for mechanical and fluid-flow properties. London: Geological Society: 5-33. [44] WU X Y, XU X W, YU G H, et al, 2024. The China Active Faults Database (CAFD) and its web system[J]. Earth System Science Data, 16(7): 3391-3417. doi: 10.5194/essd-16-3391-2024 [45] YANG Y, WANG W, WANG J F, 2017. Characteristics of regional stress field and latest crustal deformation in middle-southern segment of Tan-Lu fault zone[J]. China Earthquake Engineering Journal, 39(S1): 14-19. (in Chinese with English abstract) [46] YU Y, CHEN Y J, 2016. Seismic anisotropy beneath the southern Ordos block and the Qinling-Dabie orogen, China: eastward Tibetan asthenospheric flow around the southern Ordos[J]. Earth and Planetary Science Letters, 455: 1-6. doi: 10.1016/j.jpgl.2016.08.026 [47] ZANG S X, LI C, WEI R Q, 2002. The determination of rheological mechanics of lithosphere and the influencing factors on the rheological strength of lithosphere[J]. Progress in Geophysics, 17(1): 50-60. (in Chinese with English abstract) [48] ZHANG J H, ZHAO G Z, XIAO Q B, et al., 2010. Analysis of electric structure of the central Tan-Lu fault zone (Yi-Shu fault zone, 36°N) and seismogenic condition[J]. Chinese Journal of Geophysics, 53(3): 605-611. (in Chinese with English abstract) [49] ZHANG S Y, HOUSTON H, WANG B H, & ZHANG H. (2024, 09). Mapping of absolute deviatoric stresses around two California earthquakes reveals a very weak crust[C]. Poster Presentation at 2024 SCEC Annual Meeting. [50] ZHAO D P, TIAN Y, LEI J S, et al., 2009. Seismic image and origin of the Changbai intraplate volcano in East Asia: role of big mantle wedge above the stagnant Pacific slab[J]. Physics of the Earth and Planetary Interiors, 173(3-4): 197-206. doi: 10.1016/j.pepi.2008.11.009 [51] ZHAO L S, HELMBERGER D V, 1994. Source estimation from broadband regional seismograms[J]. Bulletin of the Seismological Society of America, 84(1): 91-104. [52] ZHONG S J, WU J P, SI Z Y, et al., 2024. 3D high-resolution S-wave velocity structure of the lithosphere beneath North China Craton based on Eikonal surface wave tomography[J]. Acta Seismologica Sinica, 46(4): 578-599. (in Chinese with English abstract) [53] ZHU L P, HELMBERGER D V, 1996. Advancement in source estimation techniques using broadband regional seismograms[J]. Bulletin of the Seismological Society of America, 86(5): 1634-1641. doi: 10.1785/BSSA0860051634 [54] ZHU R X, CHEN L, WU F Y, et al., 2011. Timing, scale and mechanism of the destruction of the North China Craton[J]. Science China Earth Sciences, 54(6): 789-797. doi: 10.1007/s11430-011-4203-4 [55] ZHU Y Q, HUANG Z C, JI C, et al., 2024. Seismotectonic segmentation controlled by magmatic underplating in the central-southern segment of Tanlu fault zone, eastern China[J]. Earth and Planetary Science Letters, 644: 118946. doi: 10.1016/j.jpgl.2024.118946 [56] ZOBACK M D, APEL R, BAUMGÄRTNER J, et al., 1993. Upper-crustal strength inferred from stress measurements to 6 km depth in the KTB borehole[J]. Nature, 365(6447): 633-635. doi: 10.1038/365633a0 [57] ZOBACK M D, TOWNEND J, 2001. Implications of hydrostatic pore pressures and high crustal strength for the deformation of intraplate lithosphere[J]. Tectonophysics, 336(1-4): 19-30. doi: 10.1016/S0040-1951(01)00091-9 [58] ZOBACK M L, 1992. First- and second-order patterns of stress in the lithosphere: the World Stress Map Project[J]. Journal of Geophysical Research: Solid Earth, 97(B8): 11703-11728. doi: 10.1029/92JB00132 [59] ZOU Z H, ZHOU H W, LIN F S, et al., 2022. High-resolution teleseismic tomographic crustal imaging for potential seismogenic segment of the central Tan-Lu Fault Zone, East China[J]. Tectonophysics, 823: 229196. doi: 10.1016/j.tecto.2021.229196 [60] 高原, 吴晶, 易桂喜, 等, 2010. 从壳幔地震各向异性初探华北地区壳幔耦合关系[J]. 科学通报, 55(29): 2837-2843. doi: 10.1007/s11434-010-4135-y [61] 靳佳琪, 罗松, 姚华建, 等, 2023. 密集台阵背景噪声成像揭示郯庐断裂带潍坊段地壳浅层速度结构及变形特征[J]. 地球物理学报, 66(2): 558-575. doi: 10.6038/cjg2022P0934 [62] 倪红玉, 刘泽民, 何康, 2013. 郯庐断裂带安徽段中小地震震源机制及现代应力场特征[J]. 地震工程学报, 35(3): 677-683. doi: 10.3969/j.issn.1000-0844.2013.03.0677 [63] 孙业君, 黄耘, 江昊琳, 等, 2015. 郯庐断裂带鲁苏皖段构造应力场及分段特征研究[J]. 地震, 35(3): 66-75. doi: 10.3969/j.issn.1000-3274.2015.03.007 [64] 孙玉军, 董树文, 范桃园, 等, 2013. 中国大陆及邻区岩石圈三维流变结构[J]. 地球物理学报, 56(9): 2936-2946. doi: 10.6038/cjg20130908 [65] 王小凤, 李中坚, 陈伯林, 等, 2000. 郯庐断裂带[M]. 北京: 地质出版社. [66] 杨云, 王维, 王俊菲, 2017. 郯庐断裂带中南段应力场及变形特征[J]. 地震工程学报, 39(S1): 14-19. doi: 10.3969/j.issn.1000-0844.2017.Supp.014 [67] 臧绍先, 李昶, 魏荣强, 2002. 岩石圈流变机制的确定及影响岩石圈流变强度的因素[J]. 地球物理学进展, 17(1): 50-60. doi: 10.3969/j.issn.1004-2903.2002.01.006 [68] 张继红, 赵国泽, 肖骑彬, 等, 2010. 郯庐断裂带中段(沂沭断裂带)电性结构研究与孕震环境[J]. 地球物理学报, 53(3): 605-611. doi: 10.3969/j.issn.0001-5733.2010.03.014 [69] 钟世军, 吴建平, 司政亚, 等, 2024. 基于程函面波成像的华北克拉通岩石圈三维高分辨率S波速度结构研究[J]. 地震学报, 46(4): 578-599. doi: 10.11939/jass.20230052 [70] 朱日祥, 陈凌, 吴福元, 等, 2011. 华北克拉通破坏的时间、范围与机制[J]. 中国科学: 地球科学, 41(5): 583-592. doi: 10.1007/s11430-011-4203-4 -

 下载:
下载:


计量
- 文章访问数: 531
- HTML全文浏览量: 158
- PDF下载量: 166
- 被引次数: 0
