

The spatial and temporal evolution of thermal stress after granite emplacement and its influencing factors
-
摘要: 花岗岩与岩浆热液型矿床、油气成藏等有密切的成因关系。高温岩浆侵位到较冷的围岩中会形成岩浆热场和热应力,但热应力的大小和其影响范围尚缺乏系统研究。随着岩浆热耗散、与周围地层达到热平衡后,热应力会逐渐消失,因而数值模拟是定量研究岩浆热应力的常见方法之一。以往模拟岩浆热应力时往往采用岩石在常温下的线性热膨胀系数,但这与高温下岩石线性热膨胀系数存在较大差距。文章利用FLAC3D软件模拟花岗质岩浆侵位至上地壳范围内引起的热应力。求解物理方程包括热传导方程与线性热弹性本构方程,其中热场可通过温度差和线性热膨胀系数改变应力场,但应力场的变化不影响热场(即热场与应力场的单向耦合)。通过一系列数值模拟实验考察围岩岩性(花岗岩或碳酸盐岩)、杨氏模量、热学参数和岩浆侵位深度如何影响岩浆在上覆围岩产生的热应力。数值实验结果表明:岩石热传导系数通过传热快慢影响热应力的变化;围岩的杨氏模量越大,热应力也越大;由于花岗岩的平均杨氏模量大于碳酸盐岩,所以围岩为花岗岩时产生的热应力要高于碳酸盐岩;围岩无论是花岗岩还是碳酸盐岩,其在高温条件下的线性热膨胀系数比常温时高约1个数量级,产生的热应力最高可达100 MPa。花岗岩浆侵位后,围岩温度逐渐升高,对应的热应力不断增大;随着与岩浆房距离的增大,热应力不断减小,影响范围为岩浆房上方2 km以内;侵位深度浅的岩浆房冷却较快,其产生的热应力更有利于上覆围岩裂隙的形成和扩展。综合数值模拟结果可知,岩浆侵位所产生的热应力可影响岩体2 km内的应力场,这一局部存在且短瞬的热应力促使围岩破裂,为热液流体成矿提供运移通道或容矿空间。Abstract:
Objective Granitic magmas are genetically associated with magmatic-hydrothermal deposits and oil and gas reservoirs. The emplacement of granitic magmas into cooler rocks produced thermal anomaly and thermal stress, yet systematic studies on the spatial and temporal evolution of thermal stress still need to be completed. Previous numerical modeling often used rocks' linear thermal expansion coefficient at room temperature, but this parameter is highly temperature-dependent and reaches much higher levels at high temperatures. Therefore, the magnitude of the thermal stress caused by magma emplacement needs to be re-examined. A series of numerical experiments were carried out to investigate how the surrounding rock's lithology (granite or carbonate rocks), Young's modulus, thermal parameters, and the depth of magma emplacement affect the thermal stress generated by the magma in the overlying surrounding rocks. Methods Because the magma cools and eventually reaches thermal equilibrium with the surrounding strata, numerical simulation is one of the common methods to examine the thermal stress after magma emplacement quantitatively. This article used FLAC3D software to simulate the thermal stress caused by the emplacement of granitic magma into the upper crust. The differential equations we solved include the thermal conduction and linear thermoelasticity equations. The models' thermal field influences the stress field through temperature difference and the linear thermal expansion coefficient. However, changes in the stress field do not affect the thermal field, i.e., one-way coupling between the thermal field and the stress field. Results (1) Heat transfer is quicker on wallrocks with high thermal conductivity, causing a faster change in thermal stress. Compared to the high-thermal-conductivity case, the same thermal stress can be produced on wallrocks with a lower thermal conductivity after a more extended period of magma cooling. (2) The thermal stress produced by the surrounding rock's Young's modulus of 80 GPa is higher than the surrounding rock's Young's modulus of 60 GPa and 40 GPa. (3)The thermal stress simulated in the article is an order of magnitude larger than those generated using the linear coefficient of thermal expansion at room temperature. The thermal stress induced by granite surrounding rocks is nearly 30 MPa higher than that induced by carbonate rocks. (4) The thermal stress decreases with increasing distance from magma, approaching the initial stresses at nearly 2 km. (5) When the emplacement depth is shallow, both initial temperature and initial stress are lower than those in deeper emplacements; The magma room cools faster at shallow depths. Because the initial temperature of magma is the same, shallow emplacements will produce higher thermal stresses on overlying surrounding rocks. Conclusion The modeling results indicate that the thermal conductivity of surrounding rocks influences the change rate of thermal stress through the heat transfer rate. The thermal stress increases with the surrounding rock's Young's modulus. Since the average Young's modulus of granites is greater than that of carbonate rocks, the thermal stress on granite is greater than that on carbonate rocks. Either granites or carbonate rocks at high temperatures have a thermal expansion coefficient about one order of magnitude greater than that at room temperature, resulting in thermal stress of up to 100 MPa. The temperature of the surrounding rock gradually increases after the granite magma emplacement, corresponding to the increasing thermal stress. The thermal stress decreases with increasing distance from magma, exerting no influence on the initial stress of host rocks above 2 km of the granitic magma. When the magma emplacement is shallow, the combination of high thermal stress and low initial stress is more conducive to the formation and expansion of fractures in overlying surrounding rock. Significance The results of numerical simulations reveal that the thermal stresses generated by magma emplacement can affect the stress field 2 km above the magma. These localized and short-lived thermal stresses may fracture the overlying rocks, providing transport channels or ore-bearing spaces for later hydrothermal fluids. -
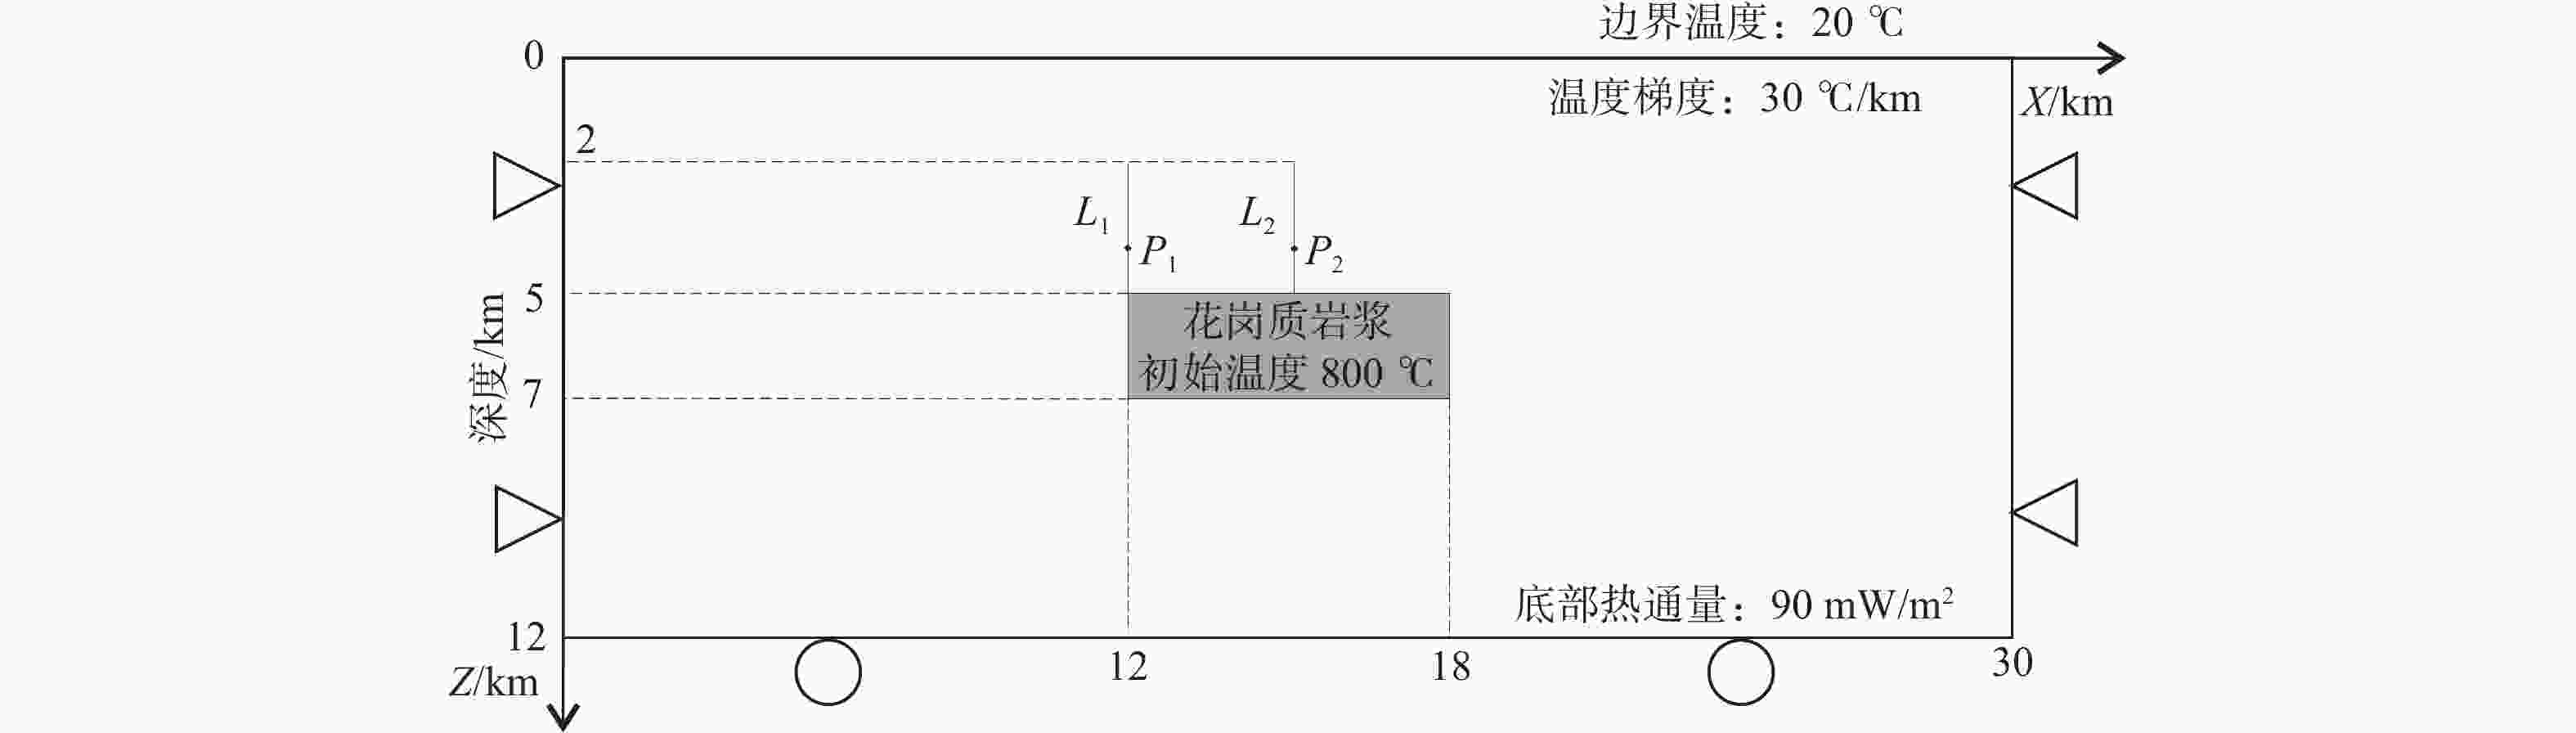
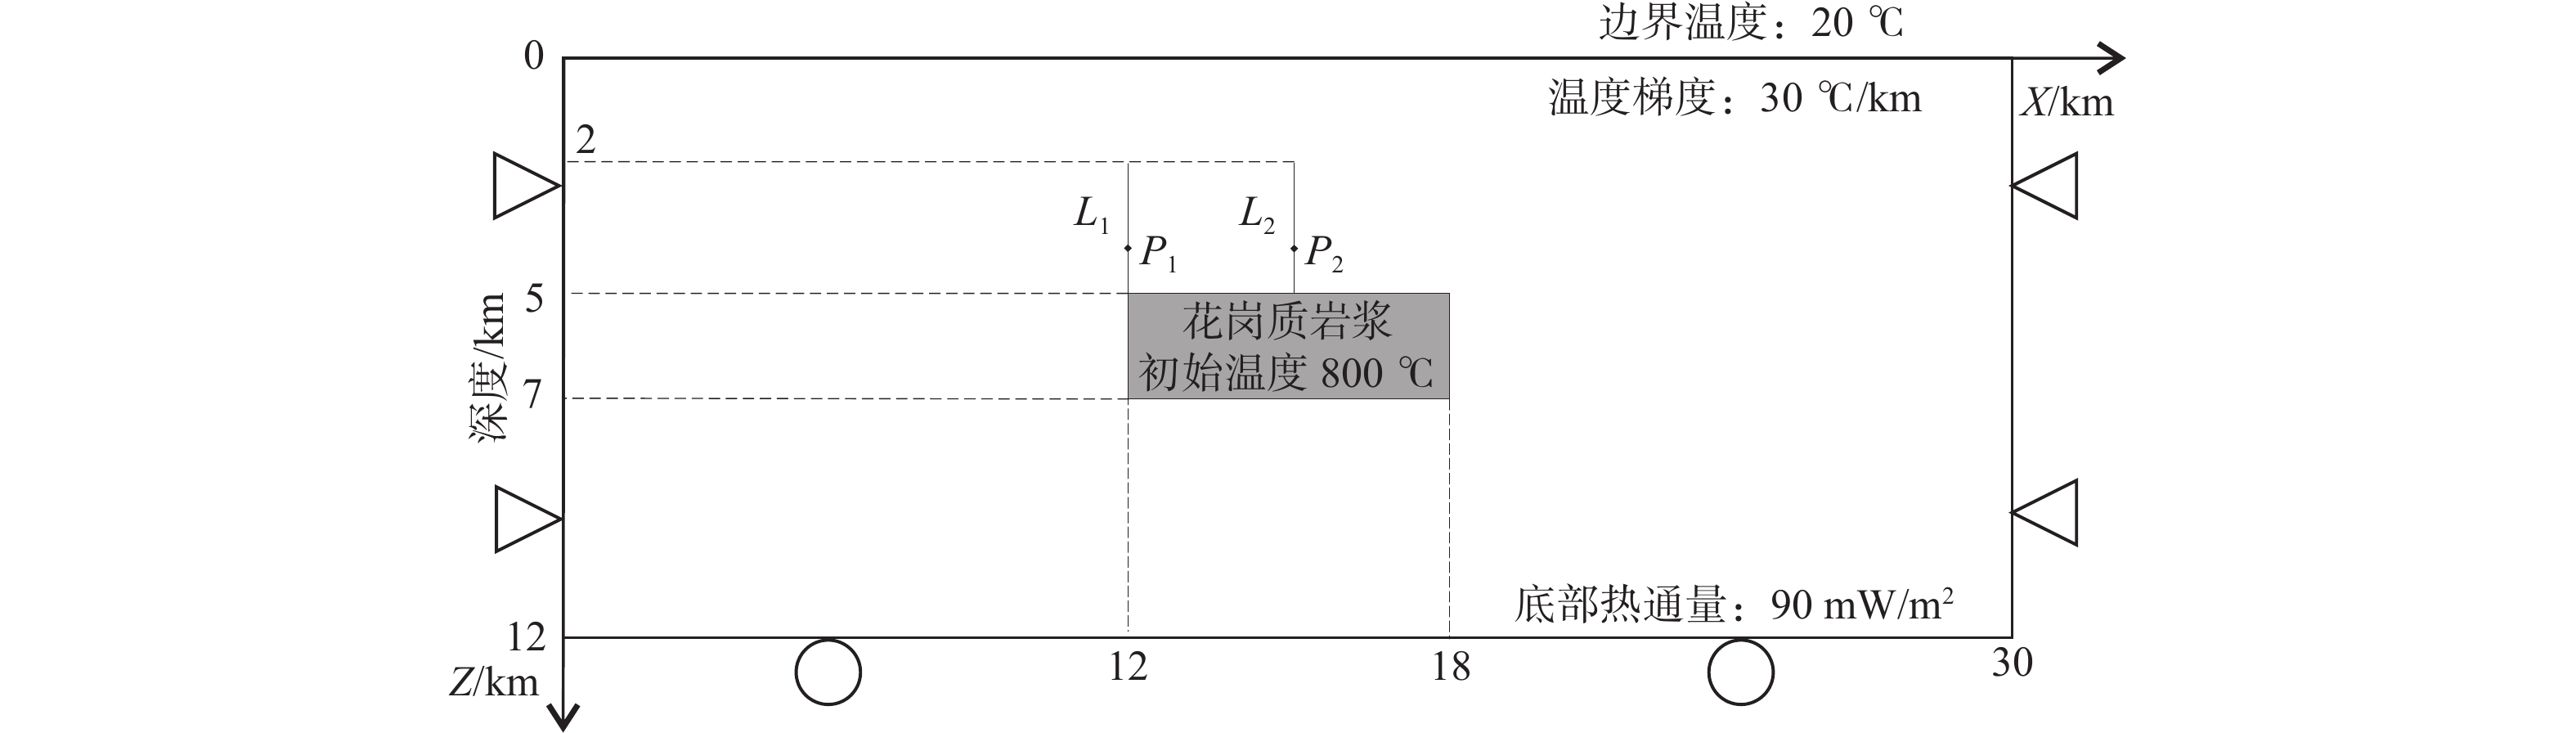
图 1 岩浆侵位二维数值模拟模型
三角代表固定两端水平方向的位移;圆形代表竖直方向可以向上产生运动但不可向下运动,水平方向也可自由移动;L1表示每隔200m记录的X、Z方向上的剪应力及温度的变化;L2表示每隔200 m记录的X、Z方向上的正应力及温度的变化;P1、P2表示系列实验1的记录点;图中所给的边界条件及初始条件见1.5节
Figure 1. The two-dimensional numerical model of magma emplacement
The boundary and initial condition are shown in the model are described in Section 1.5. The triangles represent that the horizontal displacement is fixed, and the circles represent that the bottom cannot move downward but can move horizontally. L1 indicates that shear stress in the X, Z direction and temperature change are recorded every 200 m; L2 indicates that normal stress in the X, Z direction and temperature change are recorded every 200 m. P1 and P2 are the points used in the numerical experiment series 1.

图 2 不同岩石类型的线性热膨胀系数随温度的变化特征
a—花岗岩(花岗岩1—花岗岩3中斜长石含量高于石英);b—碳酸盐岩
Figure 2. The trend of the linear thermal expansion coefficient with temperature for various rock kinds
(a) Granite (granite1–granite 3 with higher plagioclase content than quartz); (b) Carbonate rock
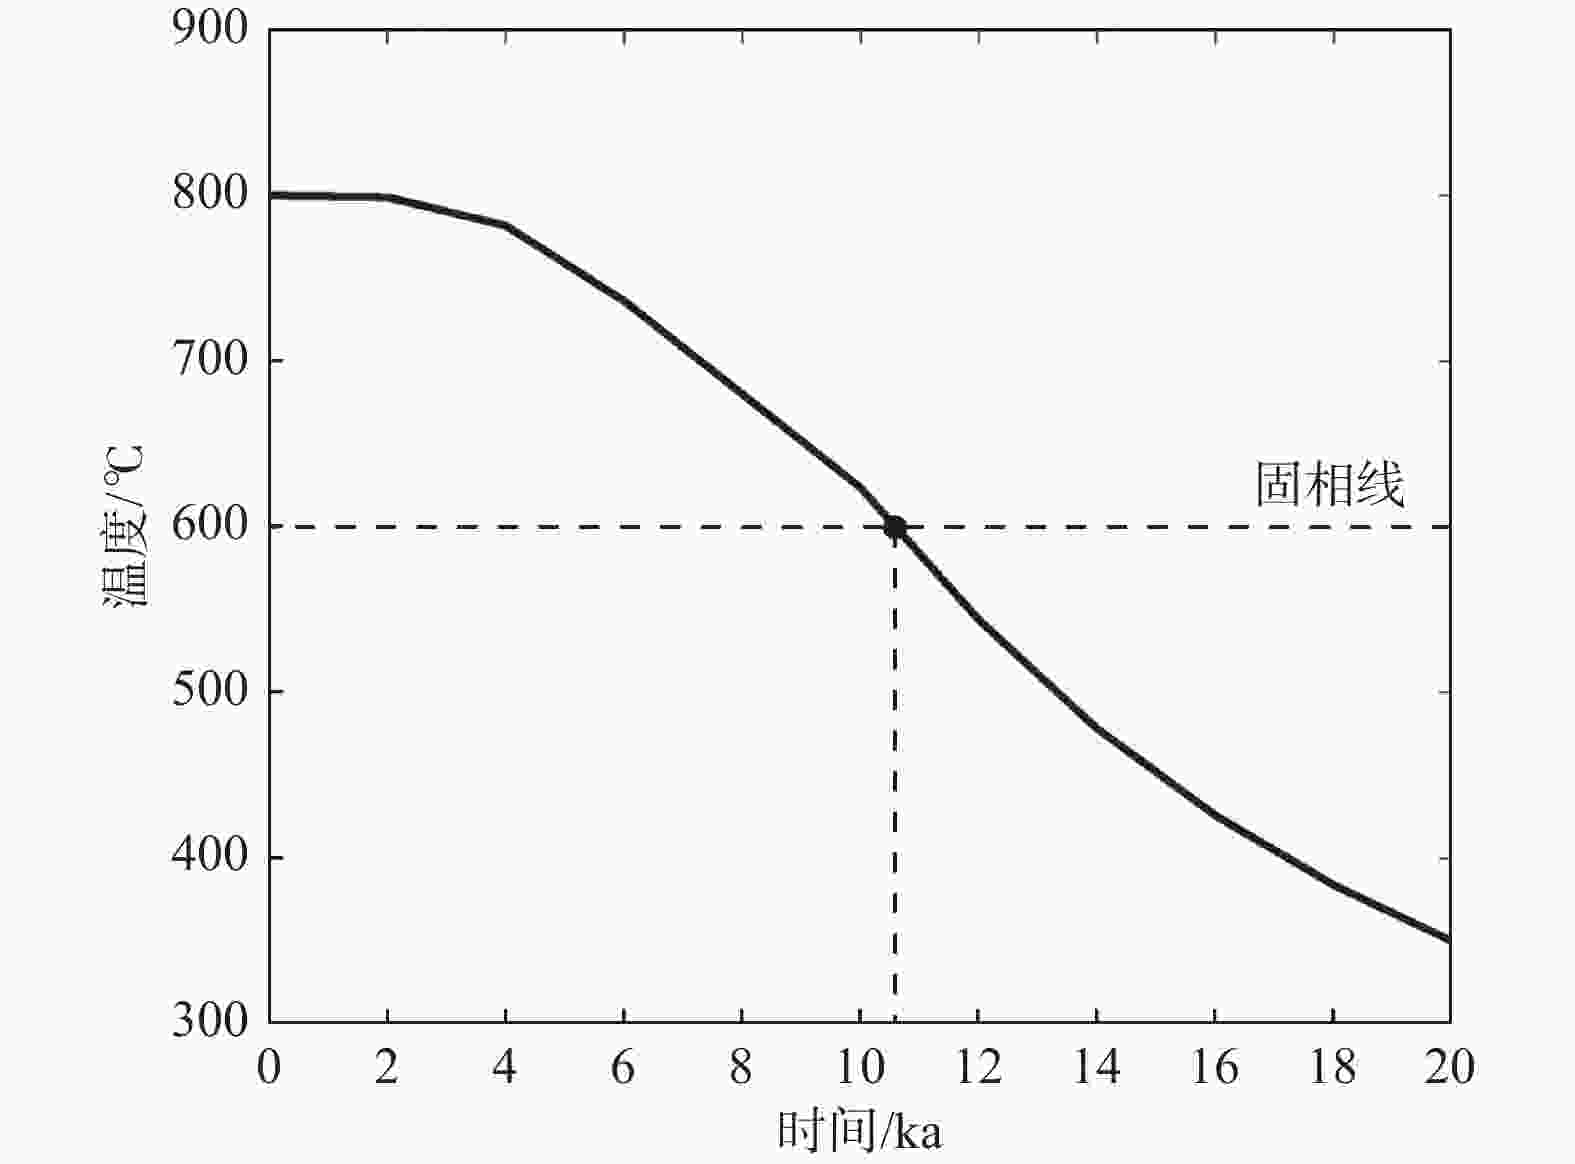
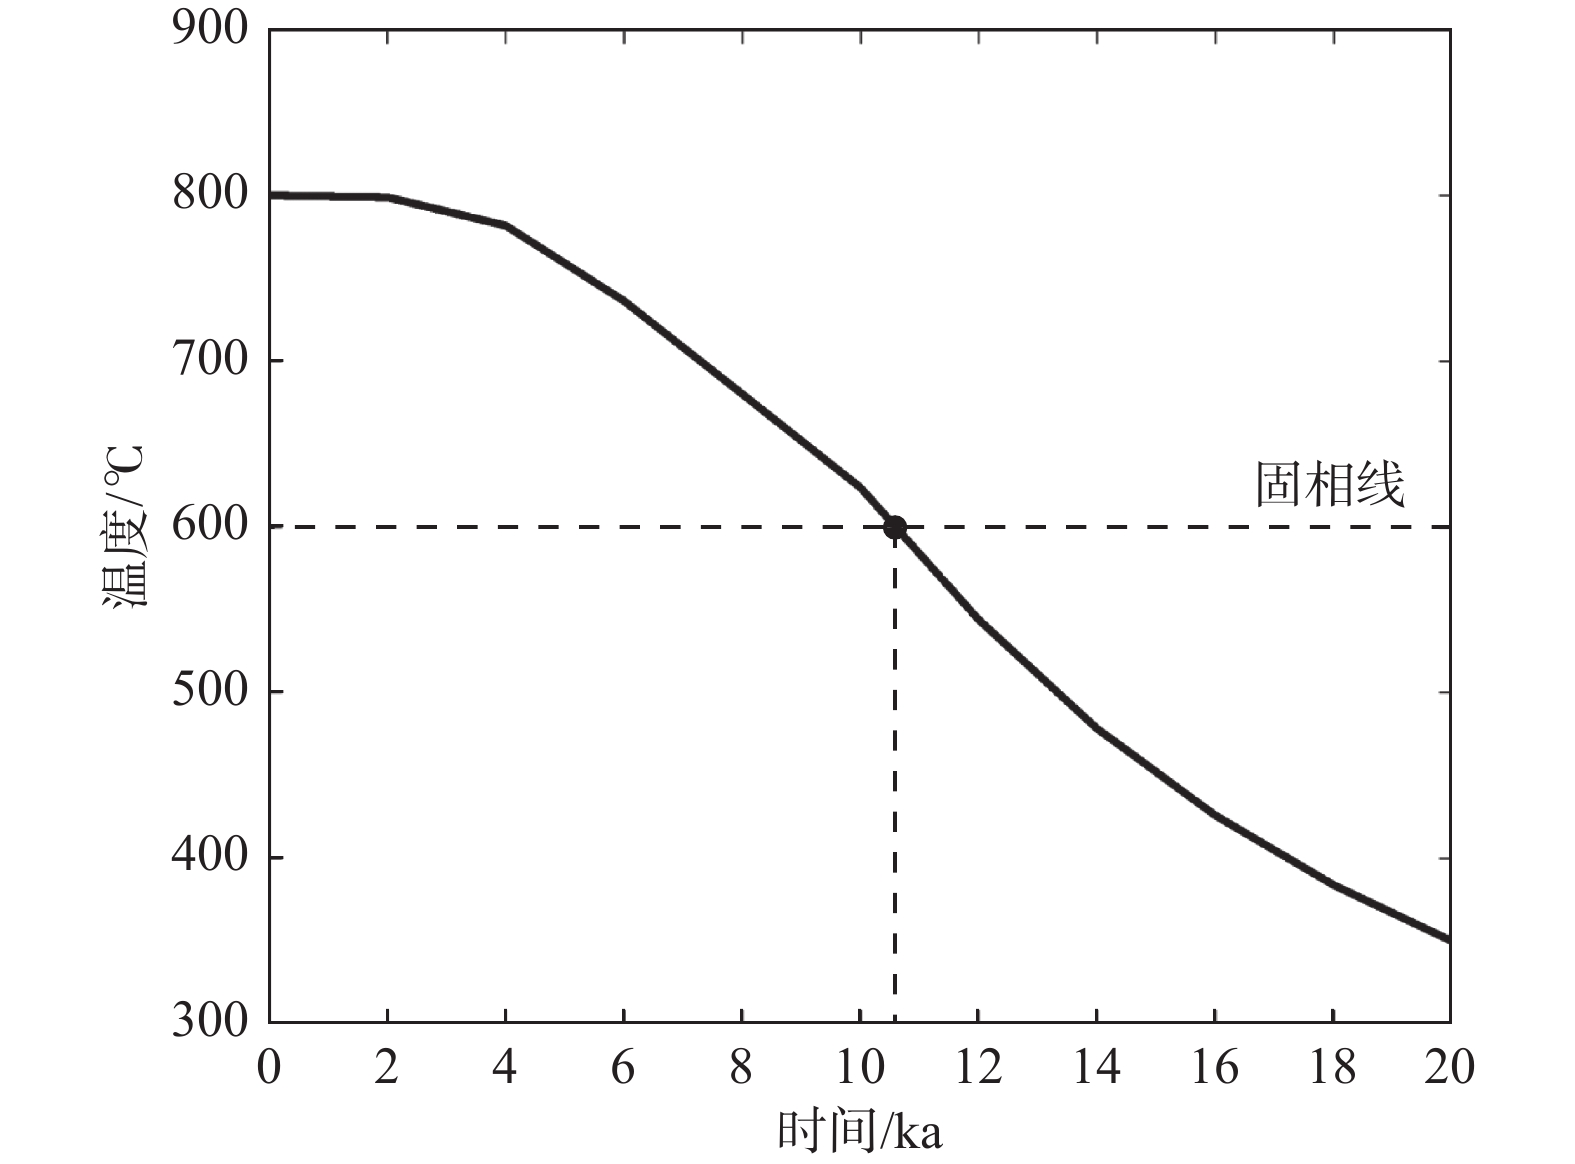
图 3 花岗质岩浆房中心温度变化曲线变化趋势
Figure 3. The trend of temperature variation for granitic magma centers
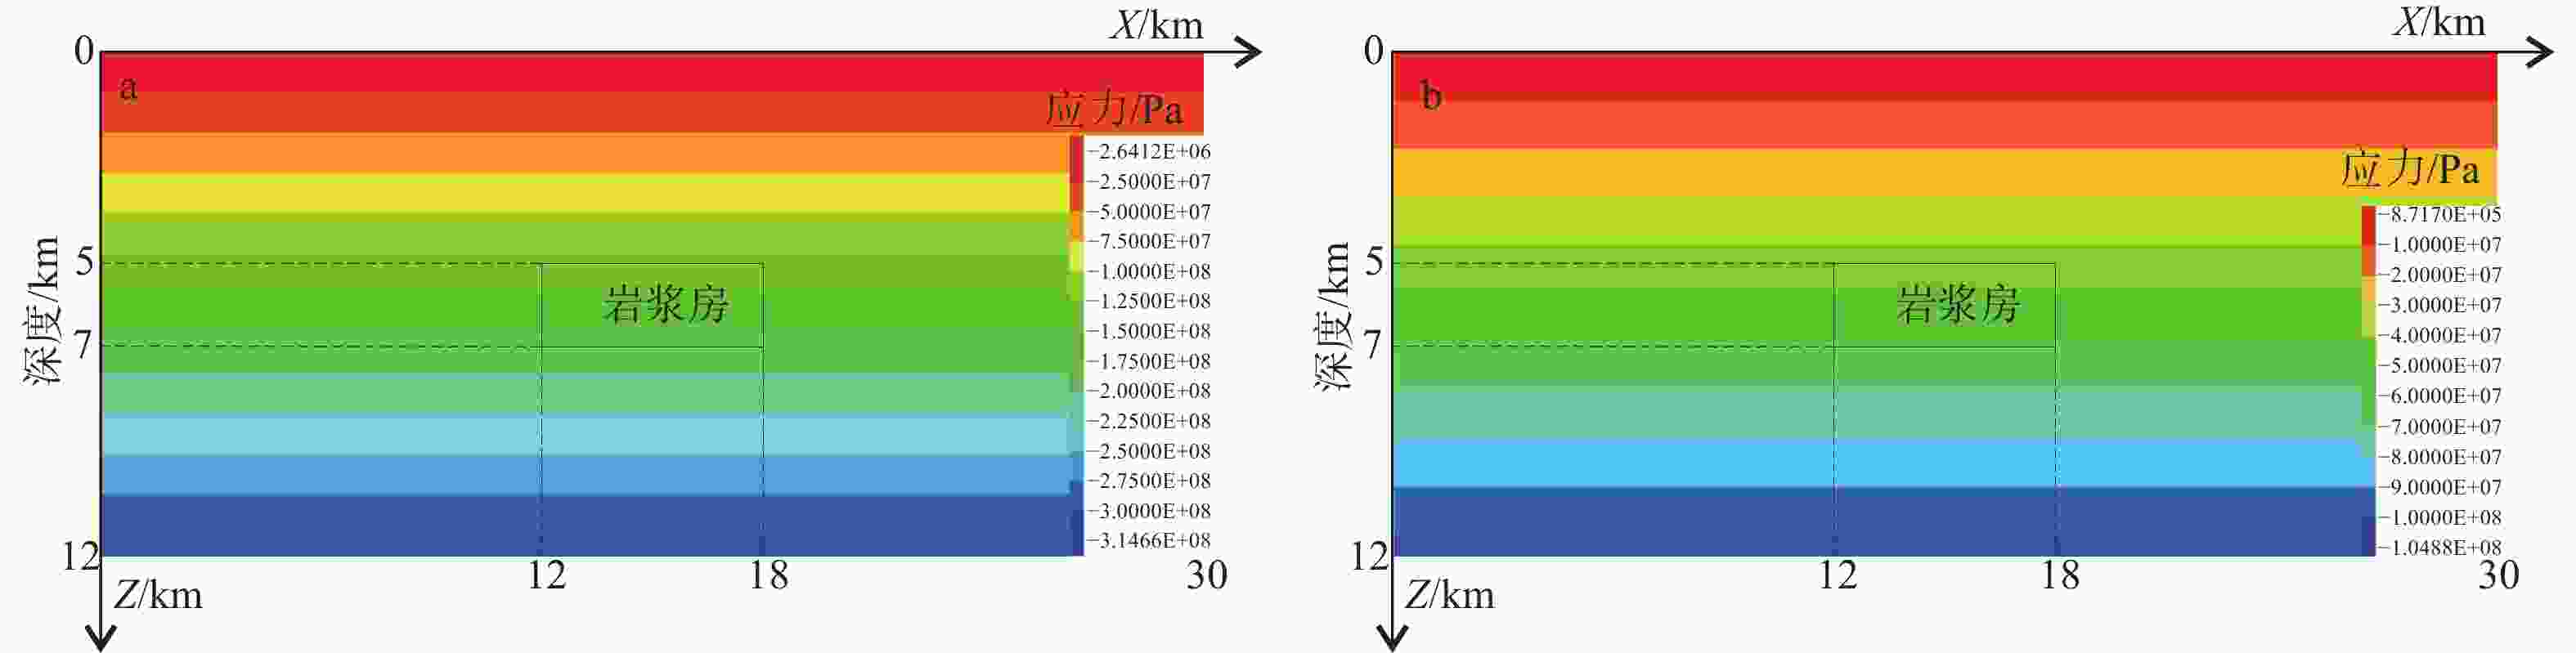
图 4 重力引起的初始应力场
a—Z方向初始正应力(最大为315 MPa);b—X方向初始正应力(最大为105 MPa)
Figure 4. The initial stress field caused by gravity
(a) Initial normal stress in Z-direction (max. 315 MPa); (b) Initial normal stress in X-direction (max. 105 MPa)
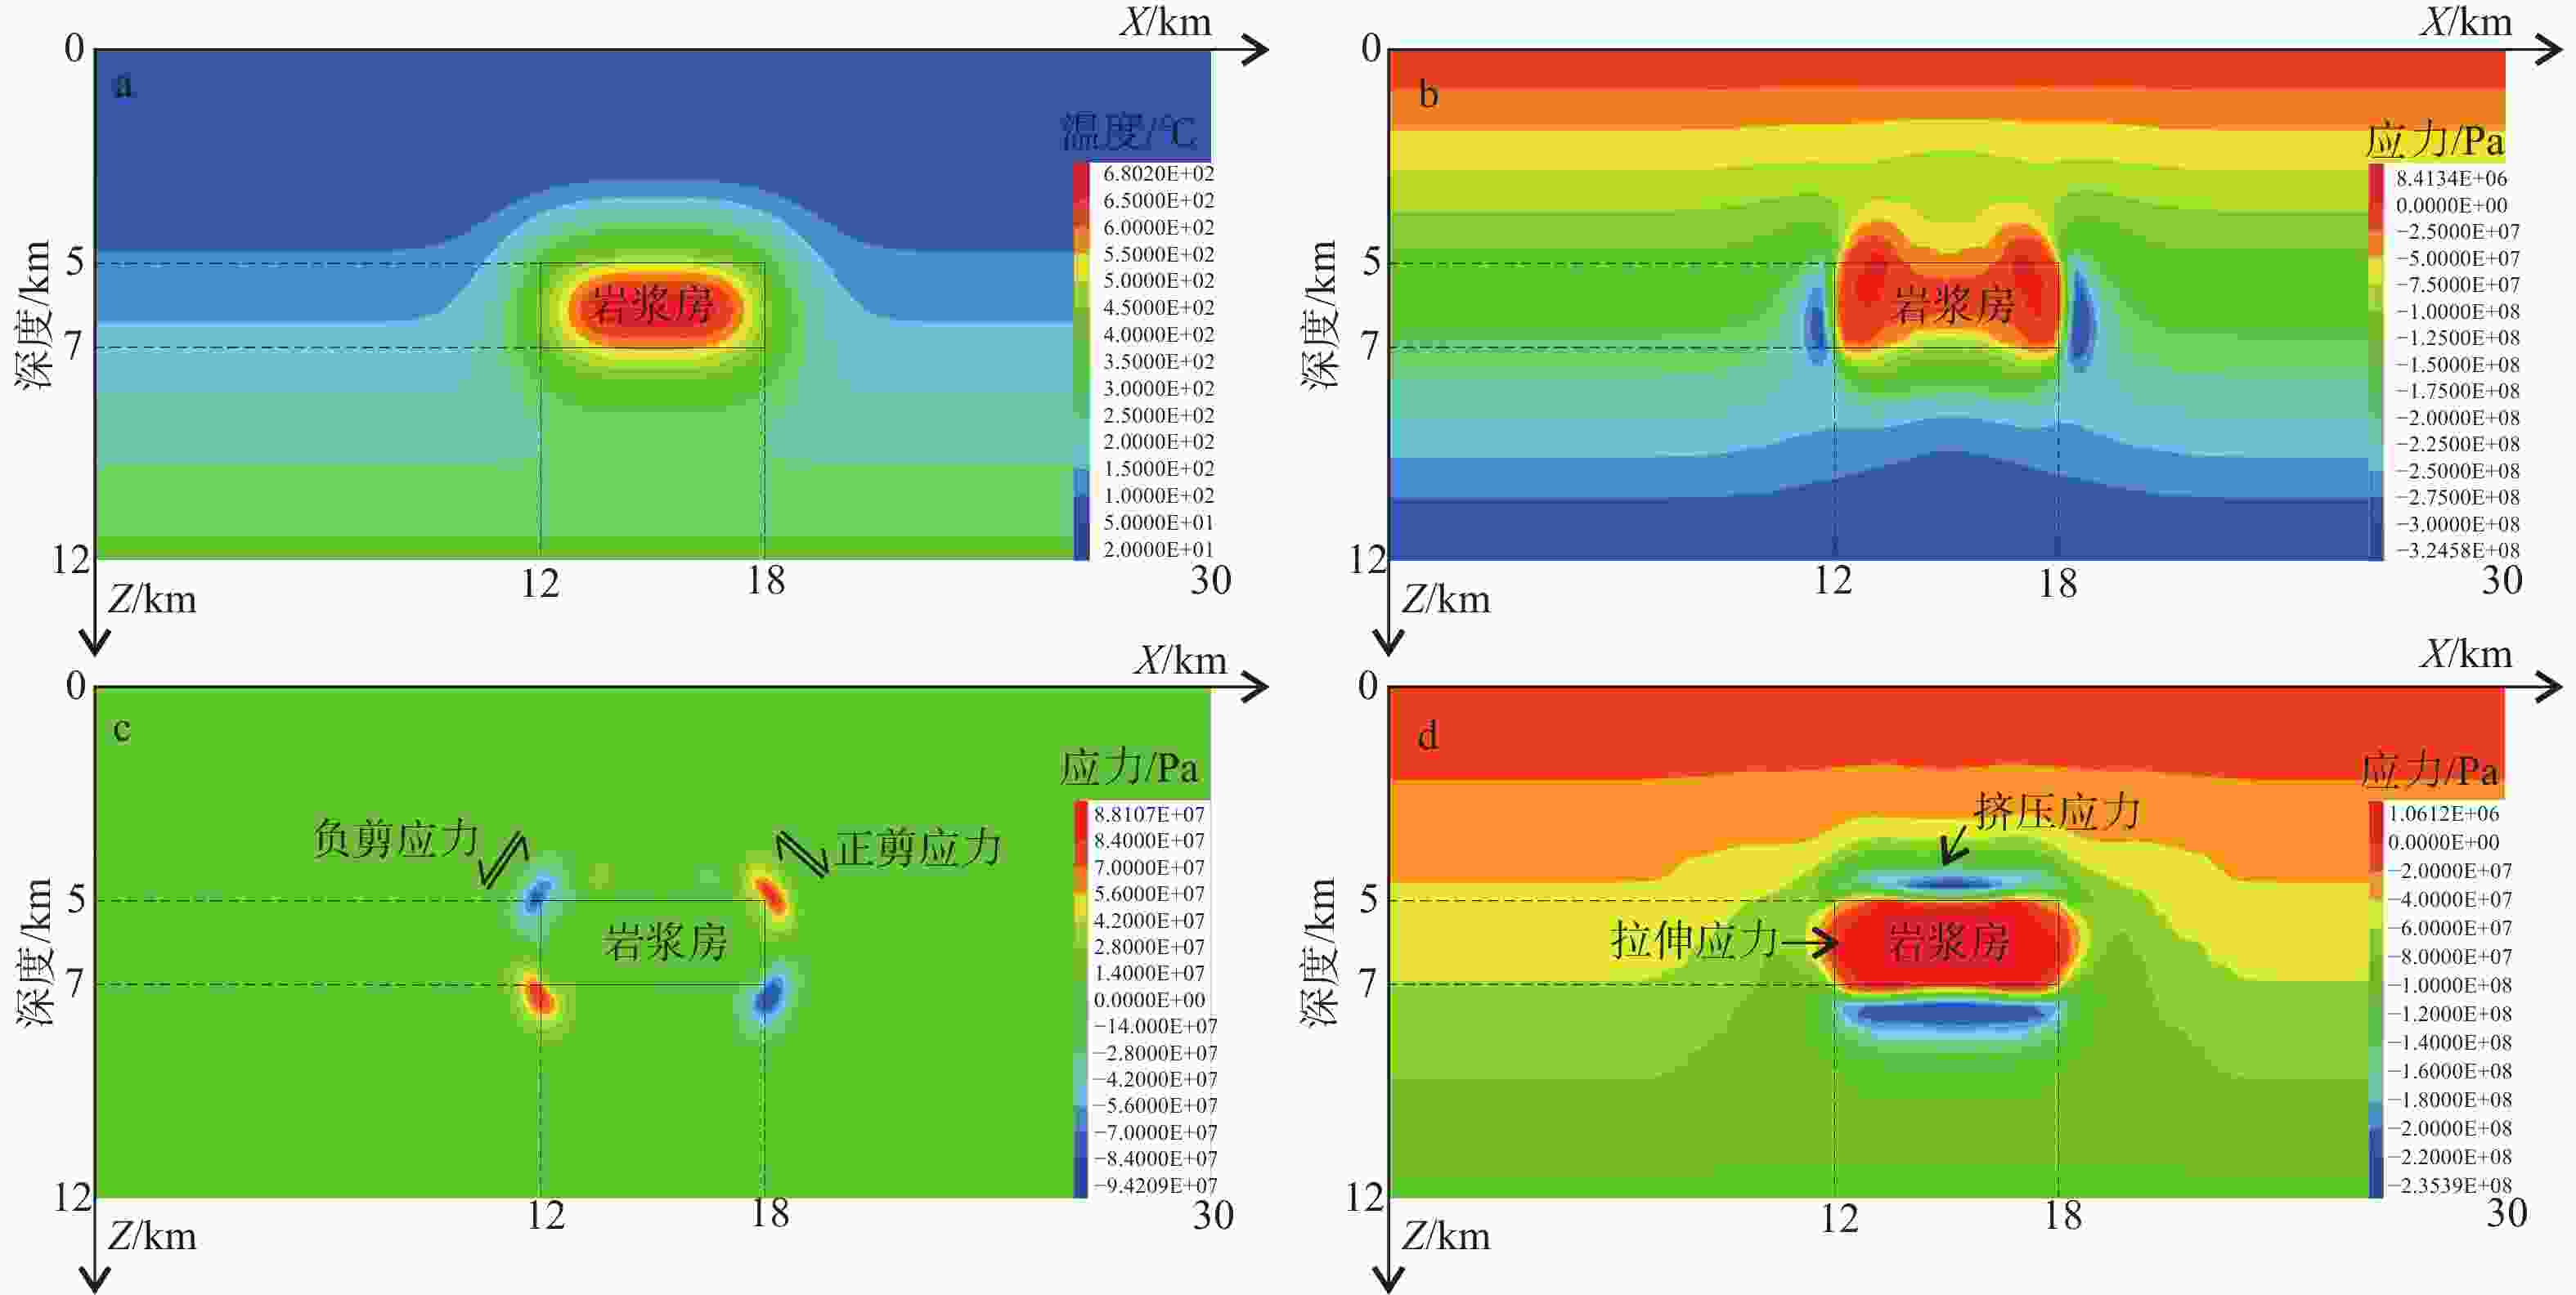
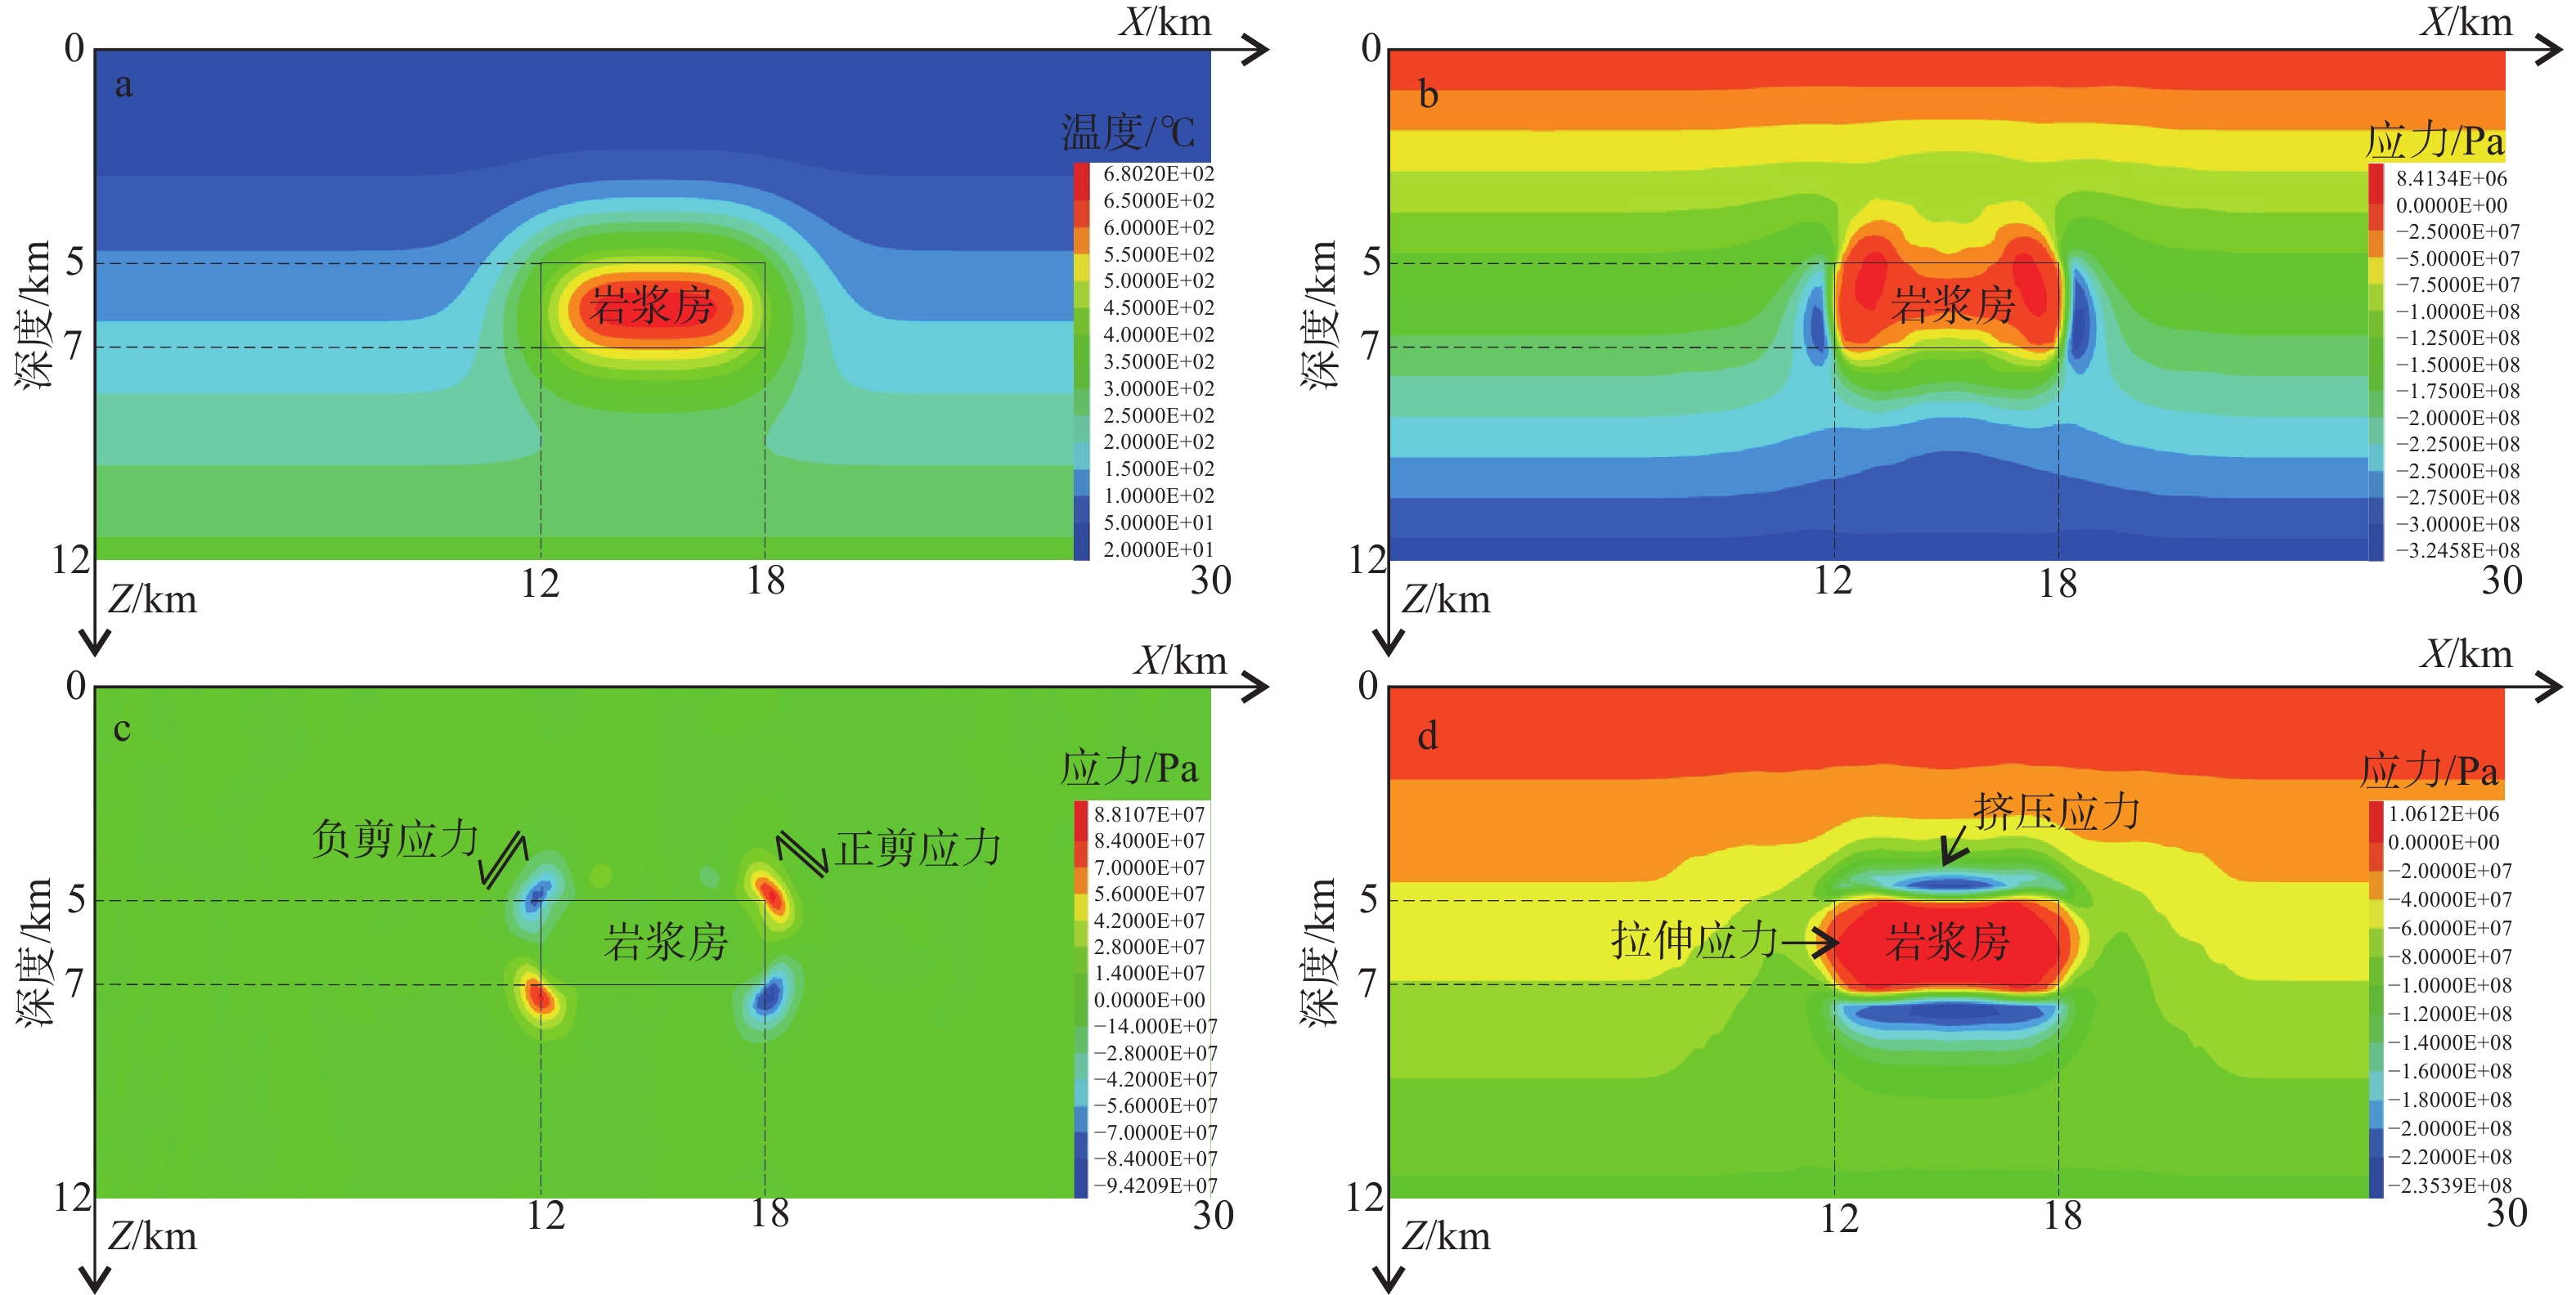
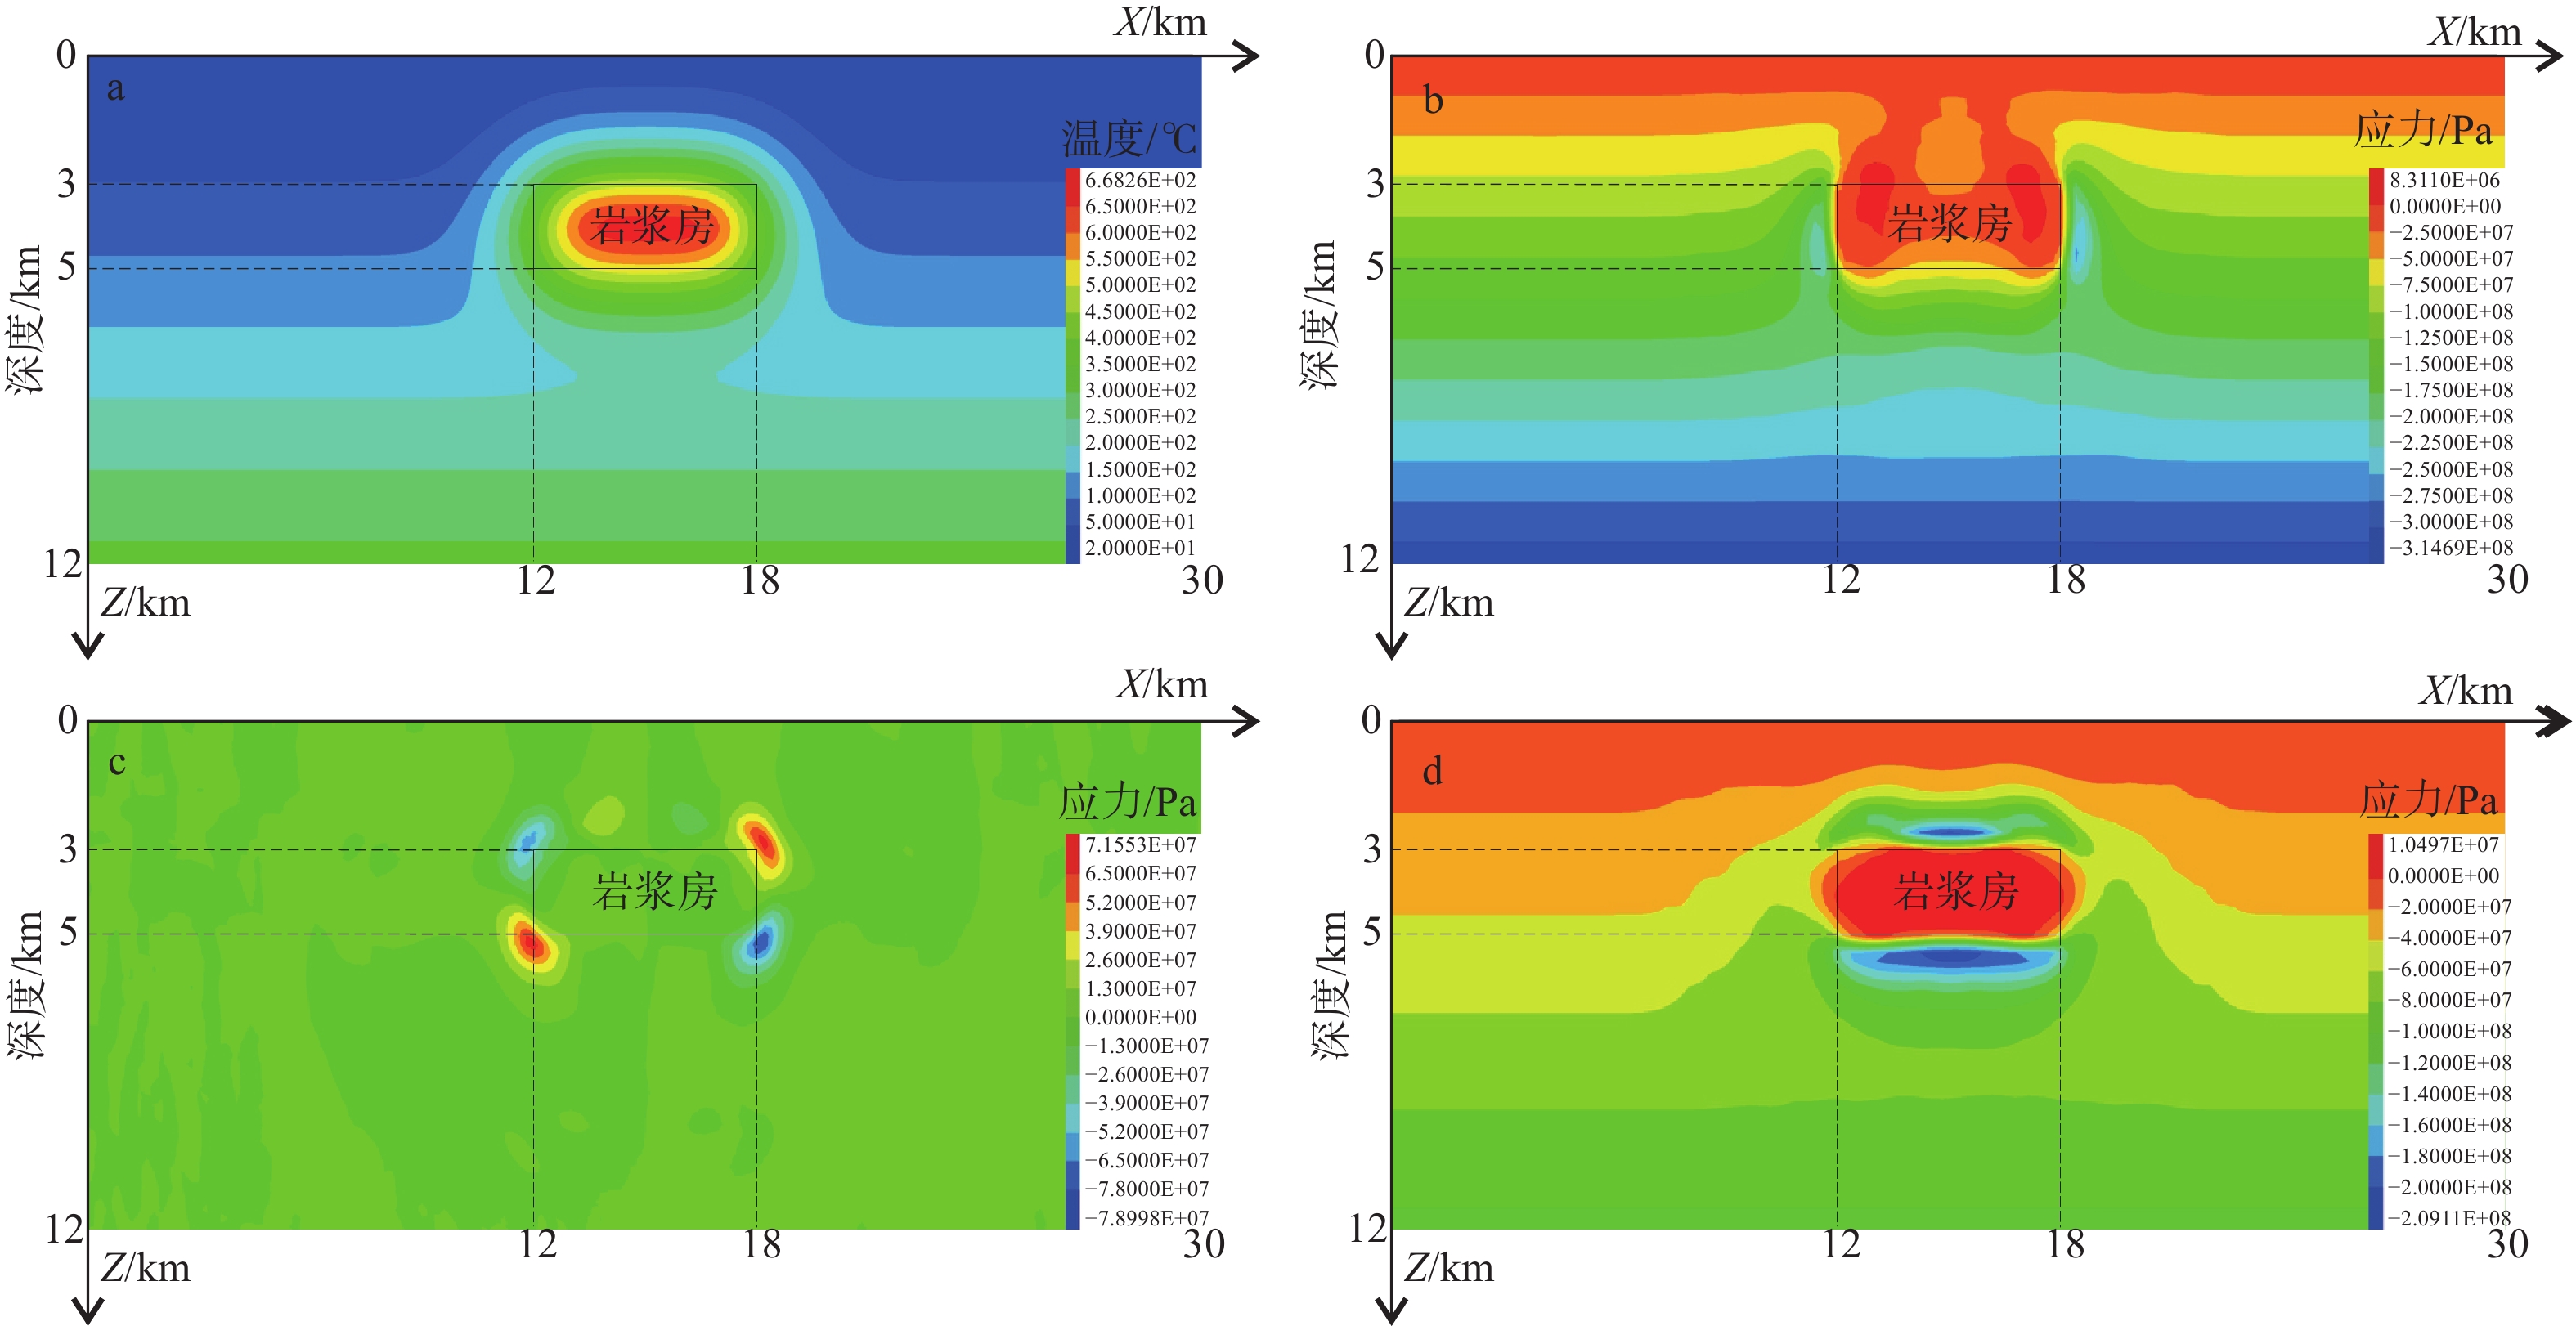
图 5 岩浆侵位8 ka后岩浆房周围温度场及热应力场
a—温度场;b—Z方向正应力;c—XZ方向剪应力;d—X方向正应力
Figure 5. The distribution of temperature and thermal stress around the granitic magma after 8 ka
(a) Temperature field; (b) Normal stress in Z-direction; (c) Shear stress in XZ-direction; (d) Normal stress in X-direction

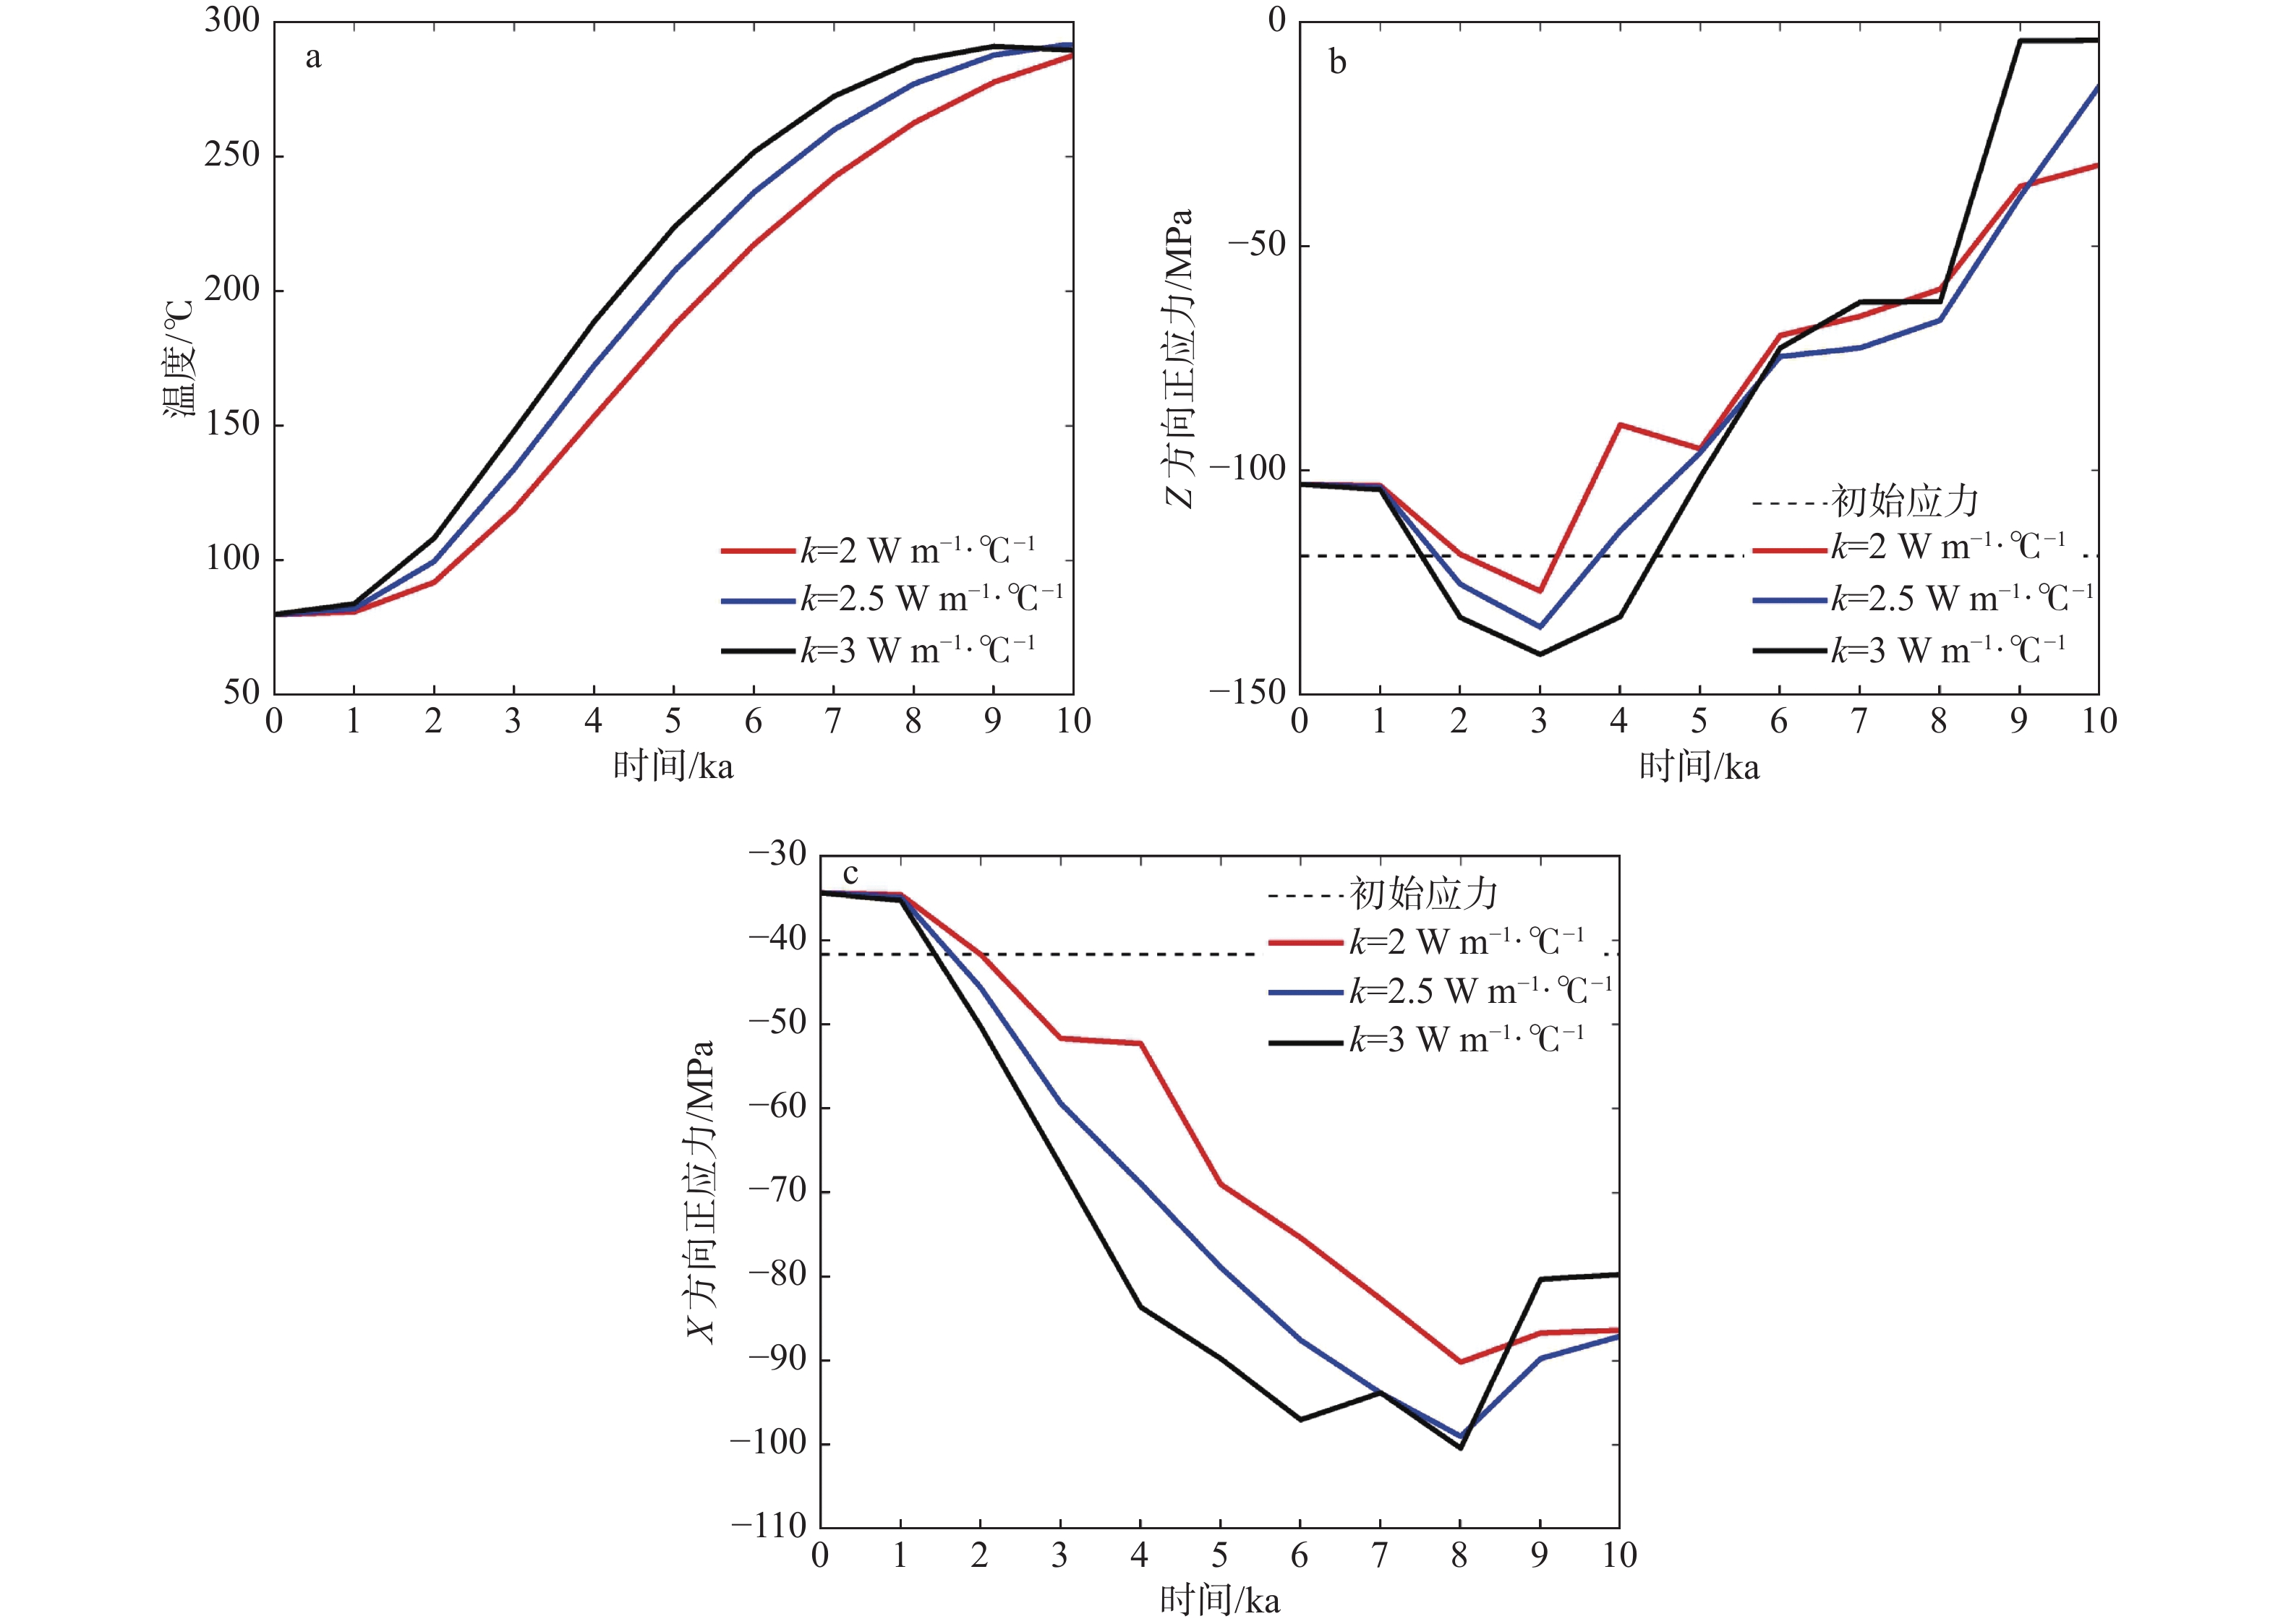
图 6 距岩浆房上方1 km处的温度和正应力随时间的变化曲线
k—热传导系数a—温度场;b—Z方向正应力;c—X方向正应力
Figure 6. Time changes of temperature and normal stress at 1 km in the upper part of the granitic magma
(a) Temperature field; (b) Normal stress in Z-direction; (c) Normal stress in X-directionk—thermal conductivity
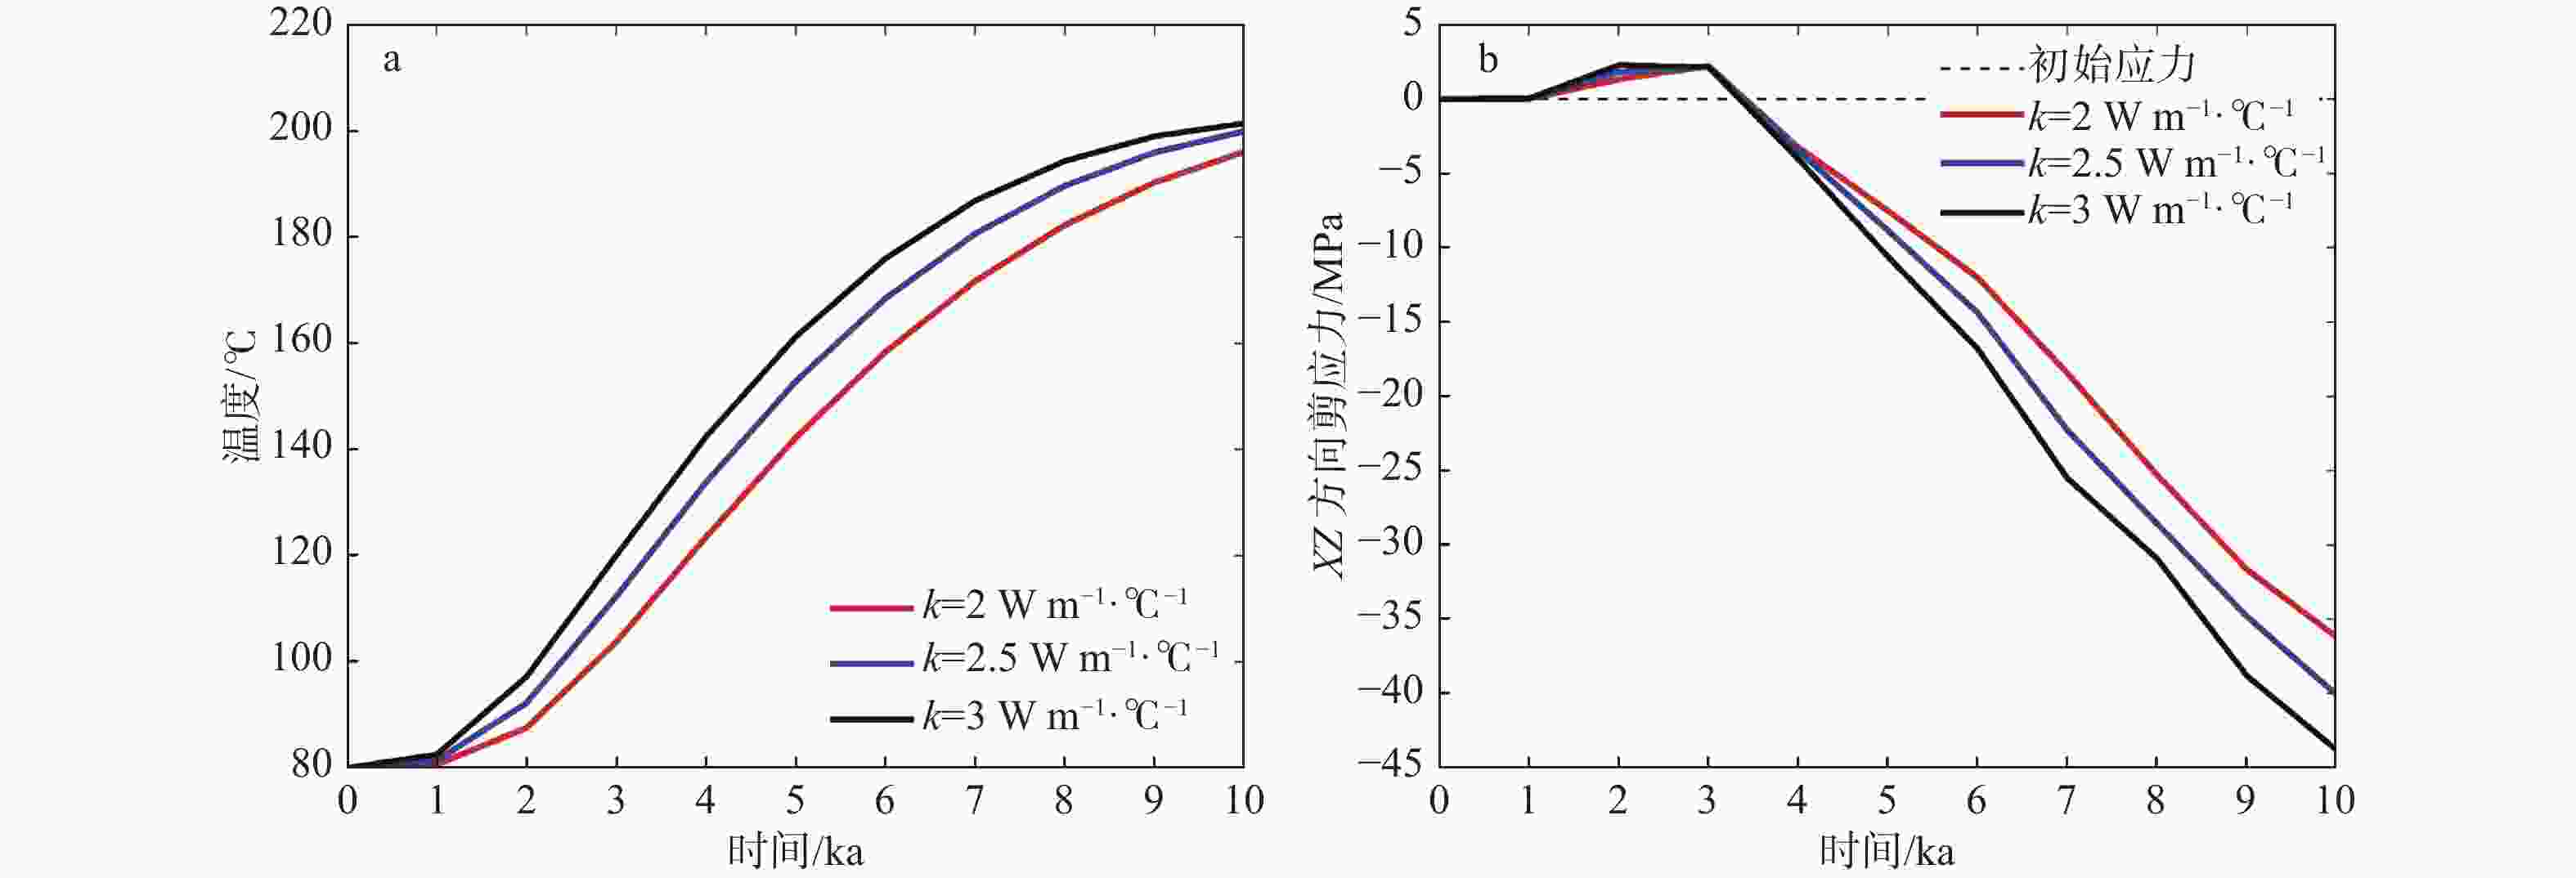
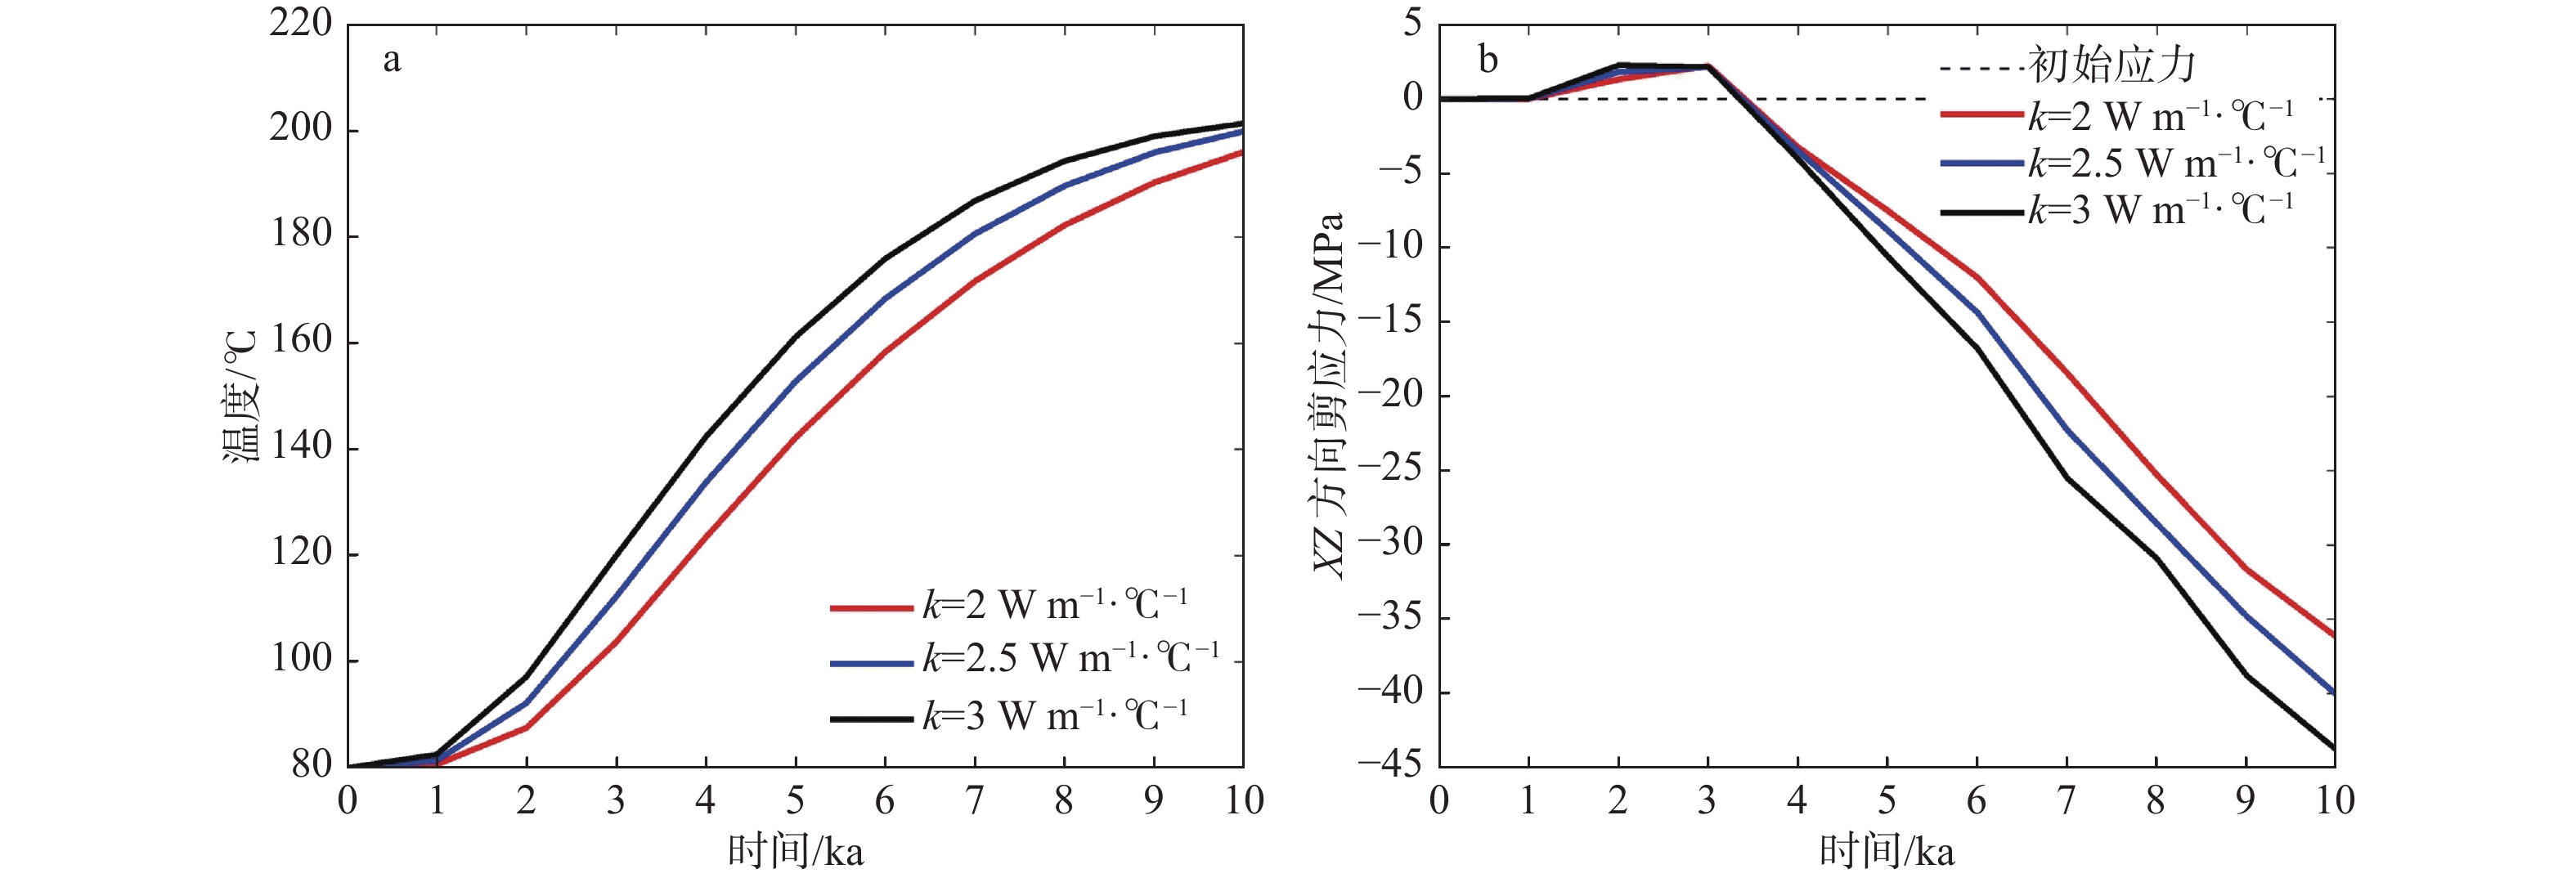
图 7 距岩浆房左上角上方1 km处温度和剪应力随时间变化曲线
k—热传导系数a—温度场;b—XZ方向剪应力
Figure 7. Temperature and shear stress variation curves over time at 1 km in the upper left corner of the granitic magma center
(a) Temperature field; (b) Shear stress in XZ-directionk—thermal conductivity

图 8 侵位时间8 ka后岩浆房上方(图1中L2)的温度和正应力变化曲线
E—杨氏模量a—温度场;b—Z方向正应力;c—X方向正应力
Figure 8. Temperature and normal stress change in the upper part of the granitic magma center (see L2 in Fig. 1) after 8 ka
(a) Temperature field; (b) Normal stress in Z-direction; (c) Normal stress in X-directionE—Young's modulus
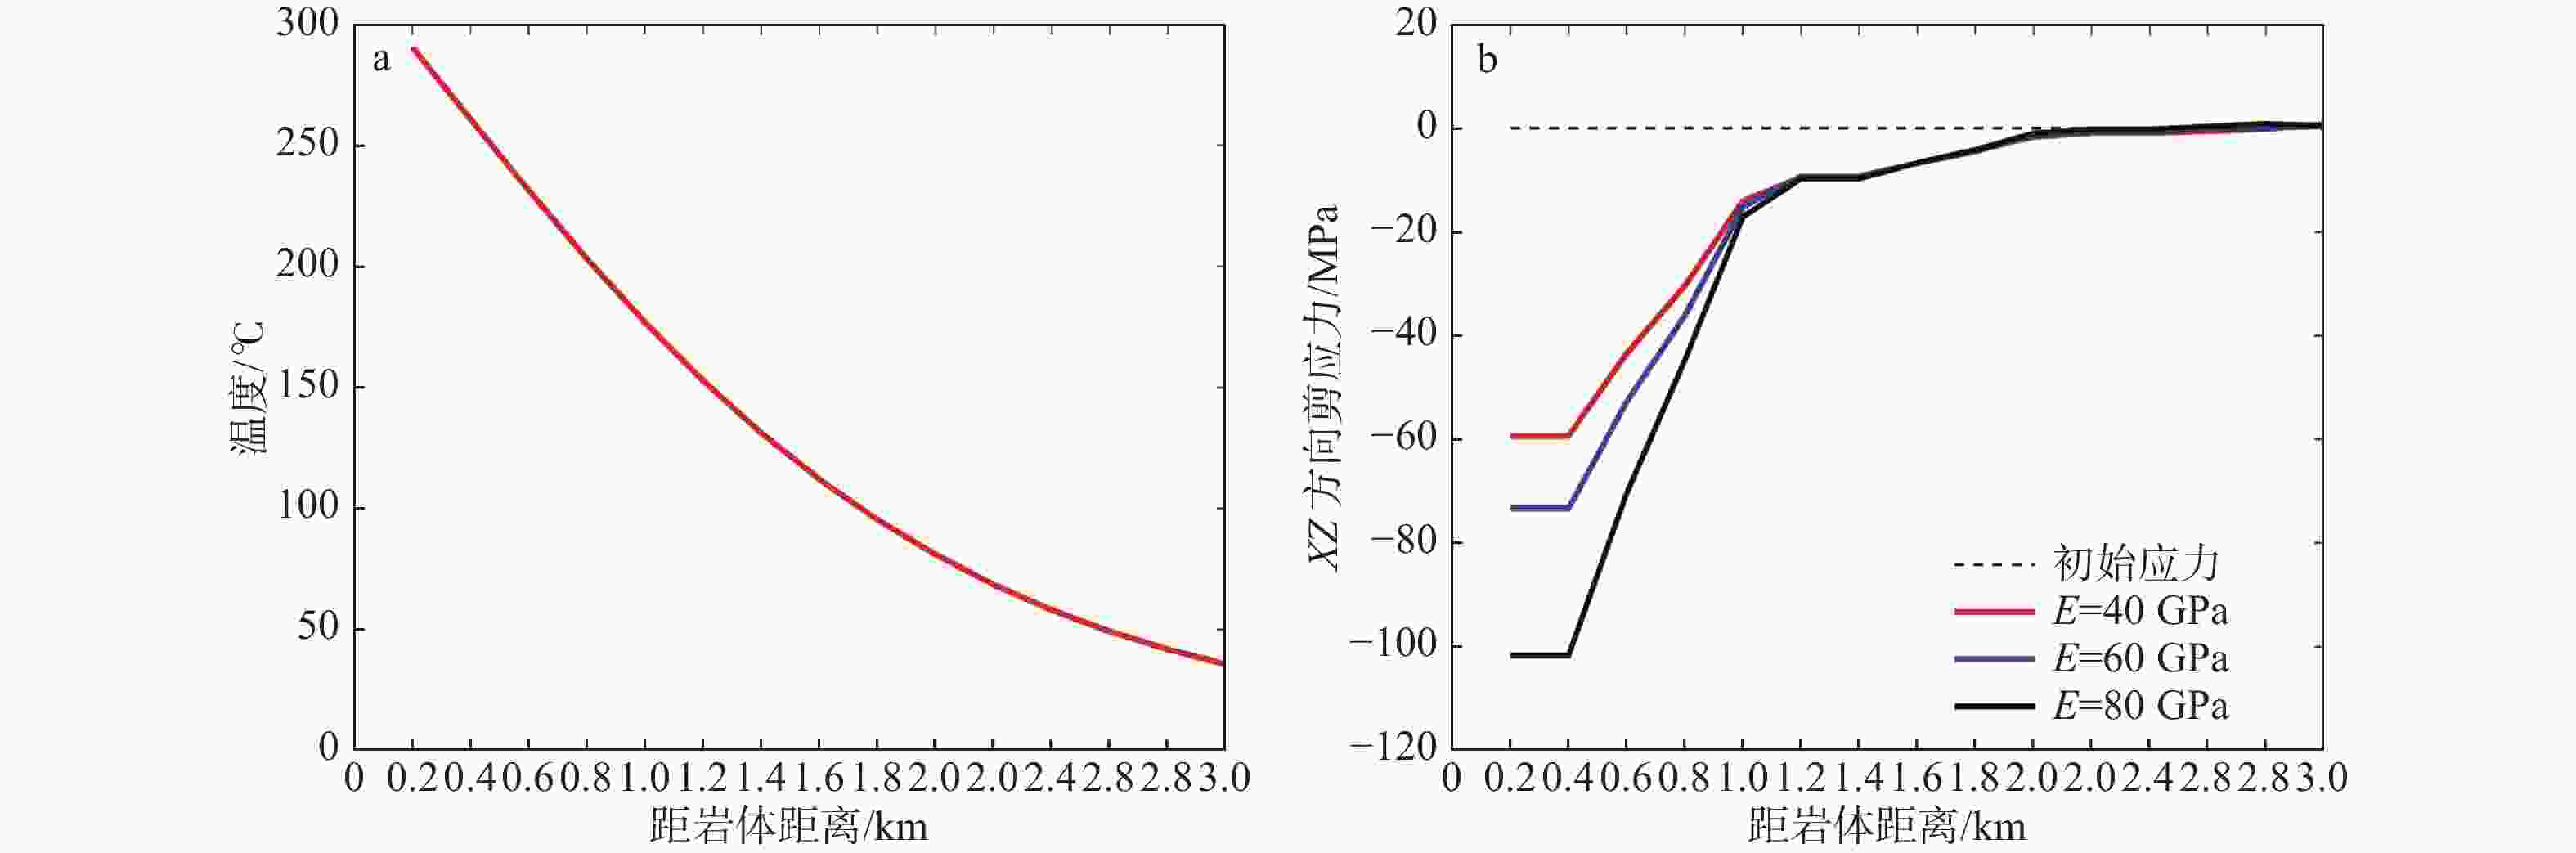
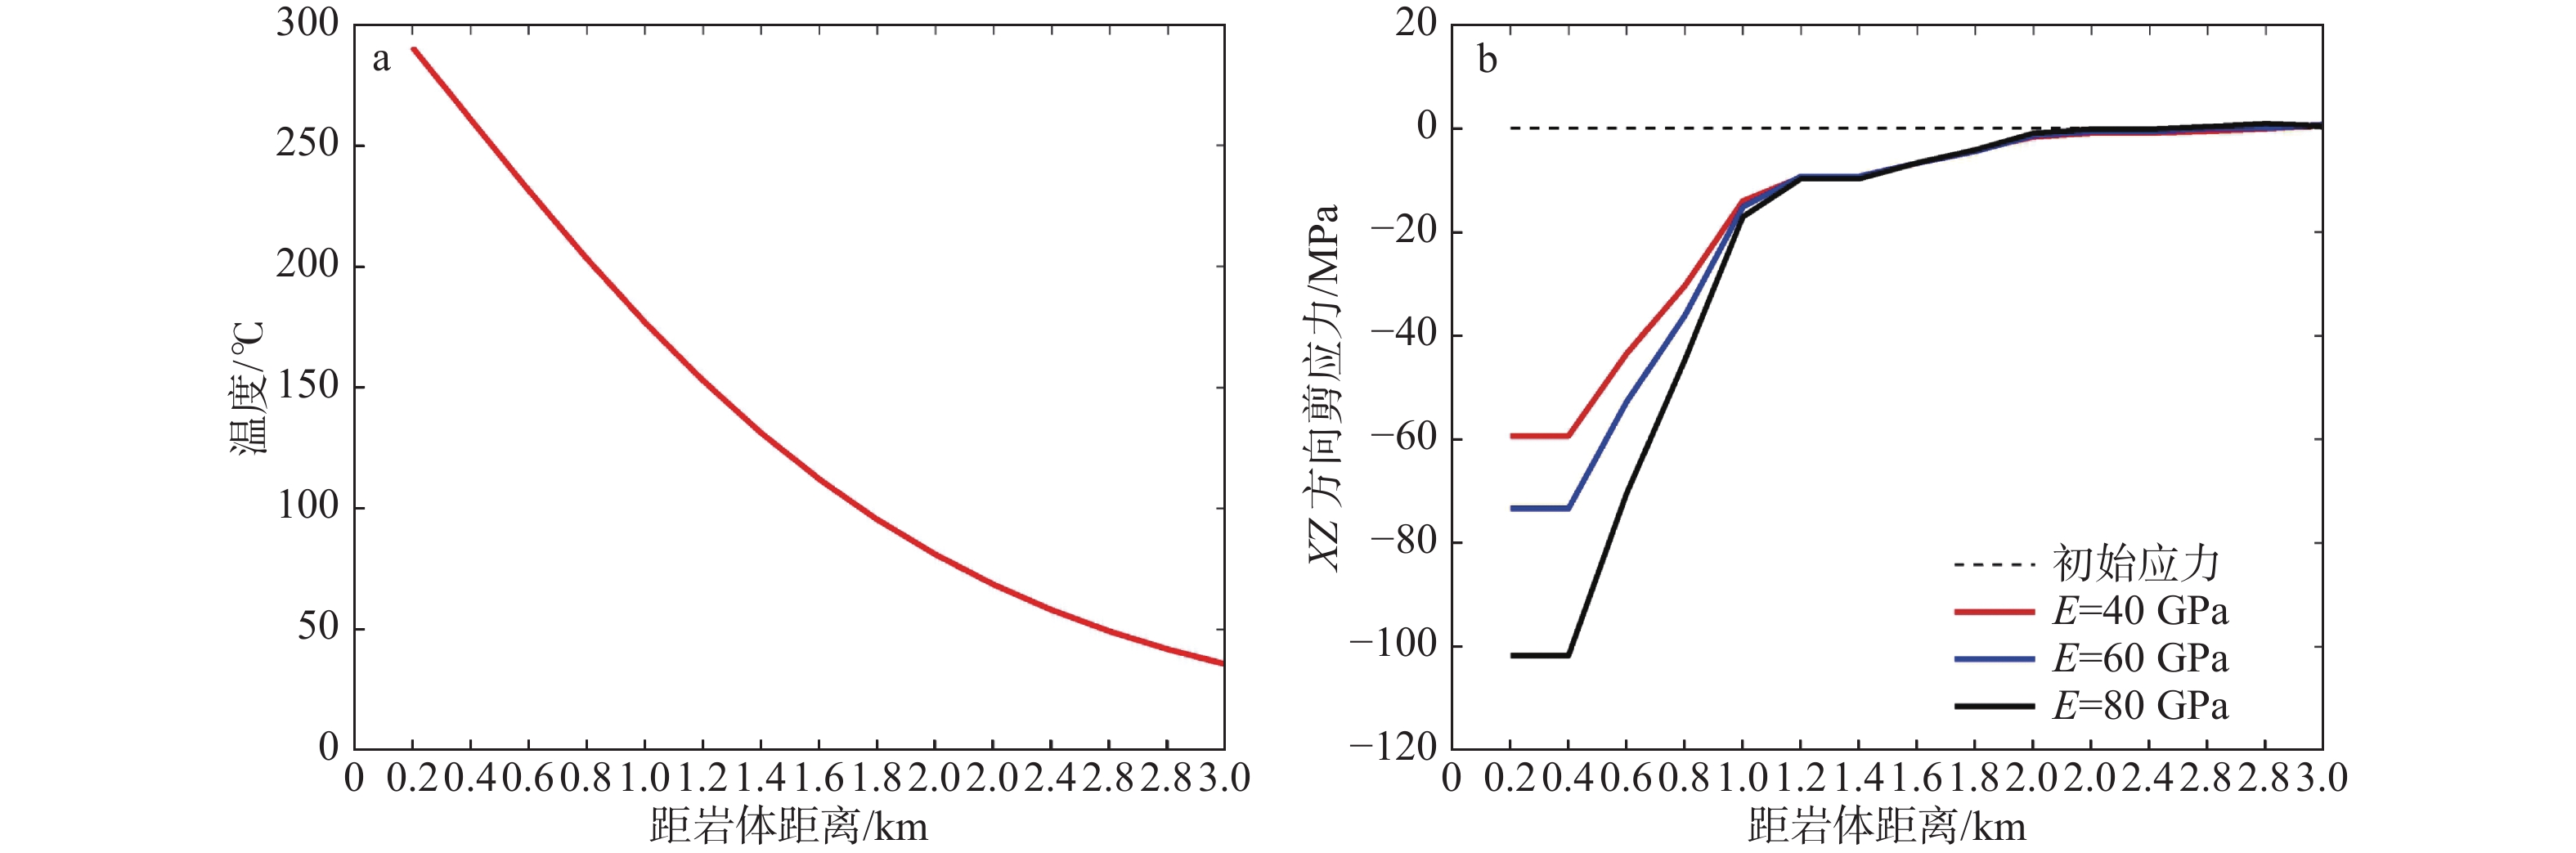
图 9 侵位时间8 ka后岩浆房左上角上方(图1中L1)的温度和剪应力变化曲线
E—杨氏模量a—温度场;b—XZ方向剪应力
Figure 9. Temperature and shear stress change in the upper left corner of the granitic magma center (see L1 in Fig. 1) after 8 ka
(a) Temperature field; (b) Shear stress in XZ-directionE—Young's modulus
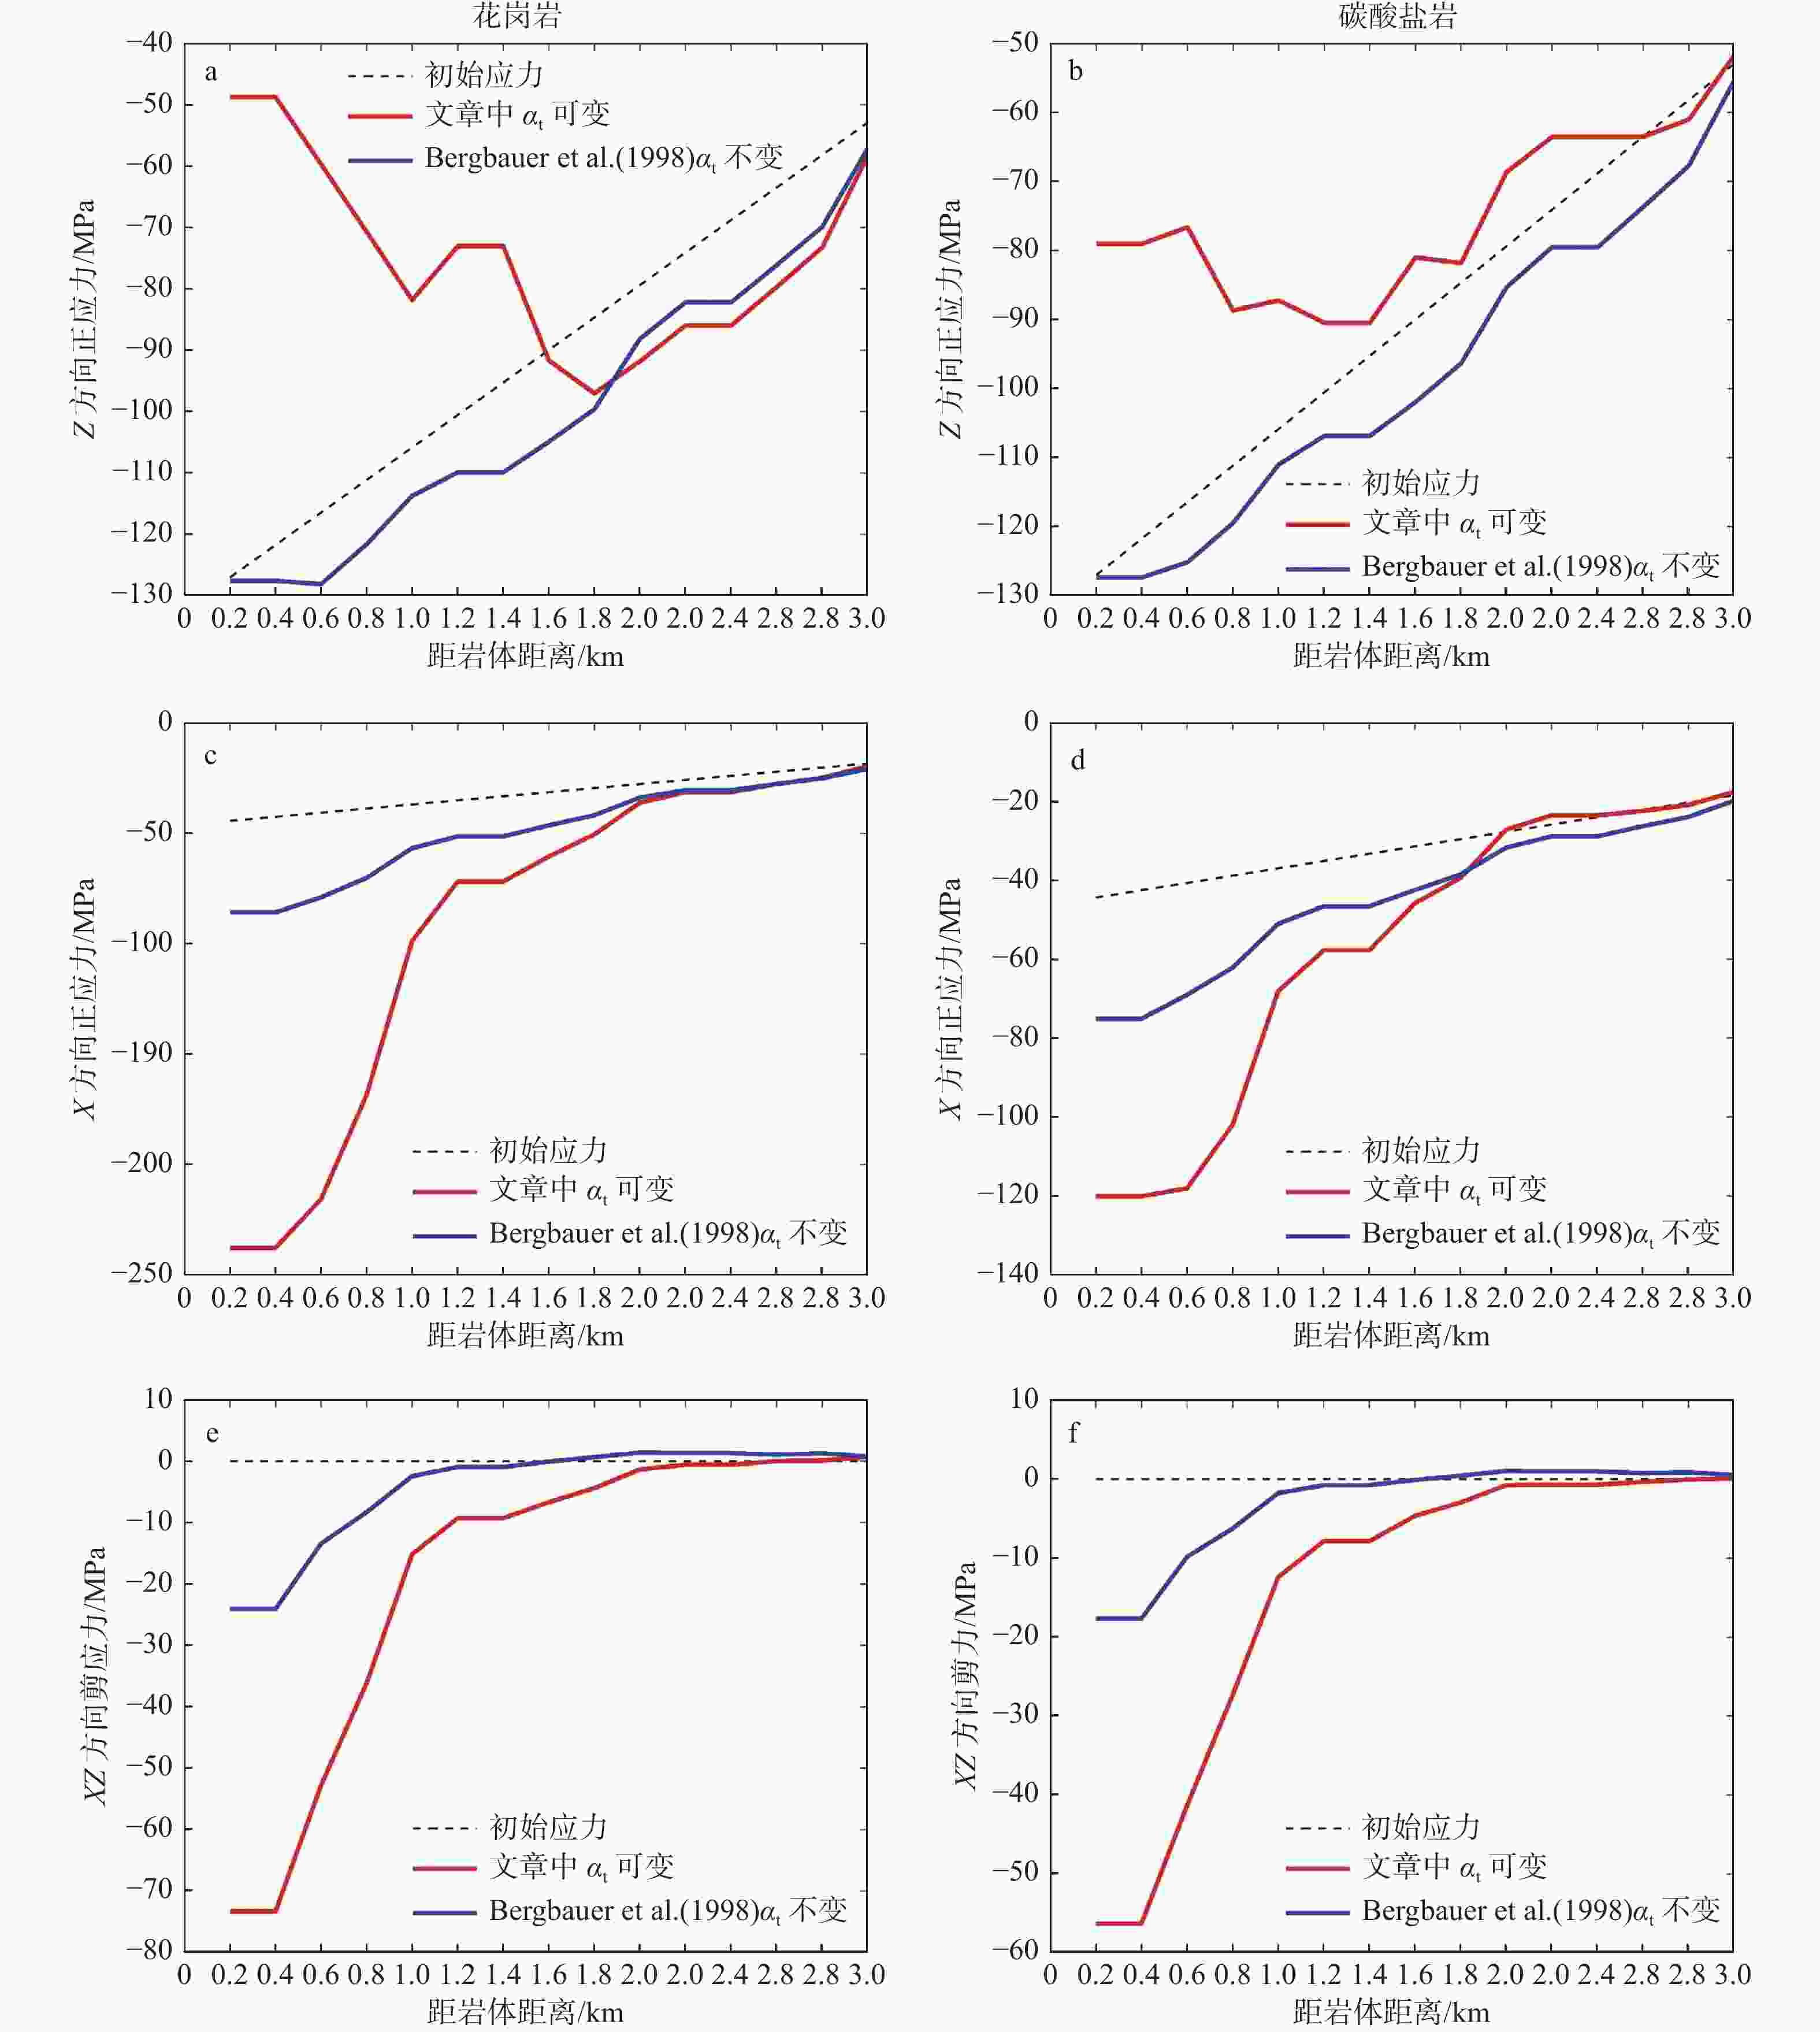
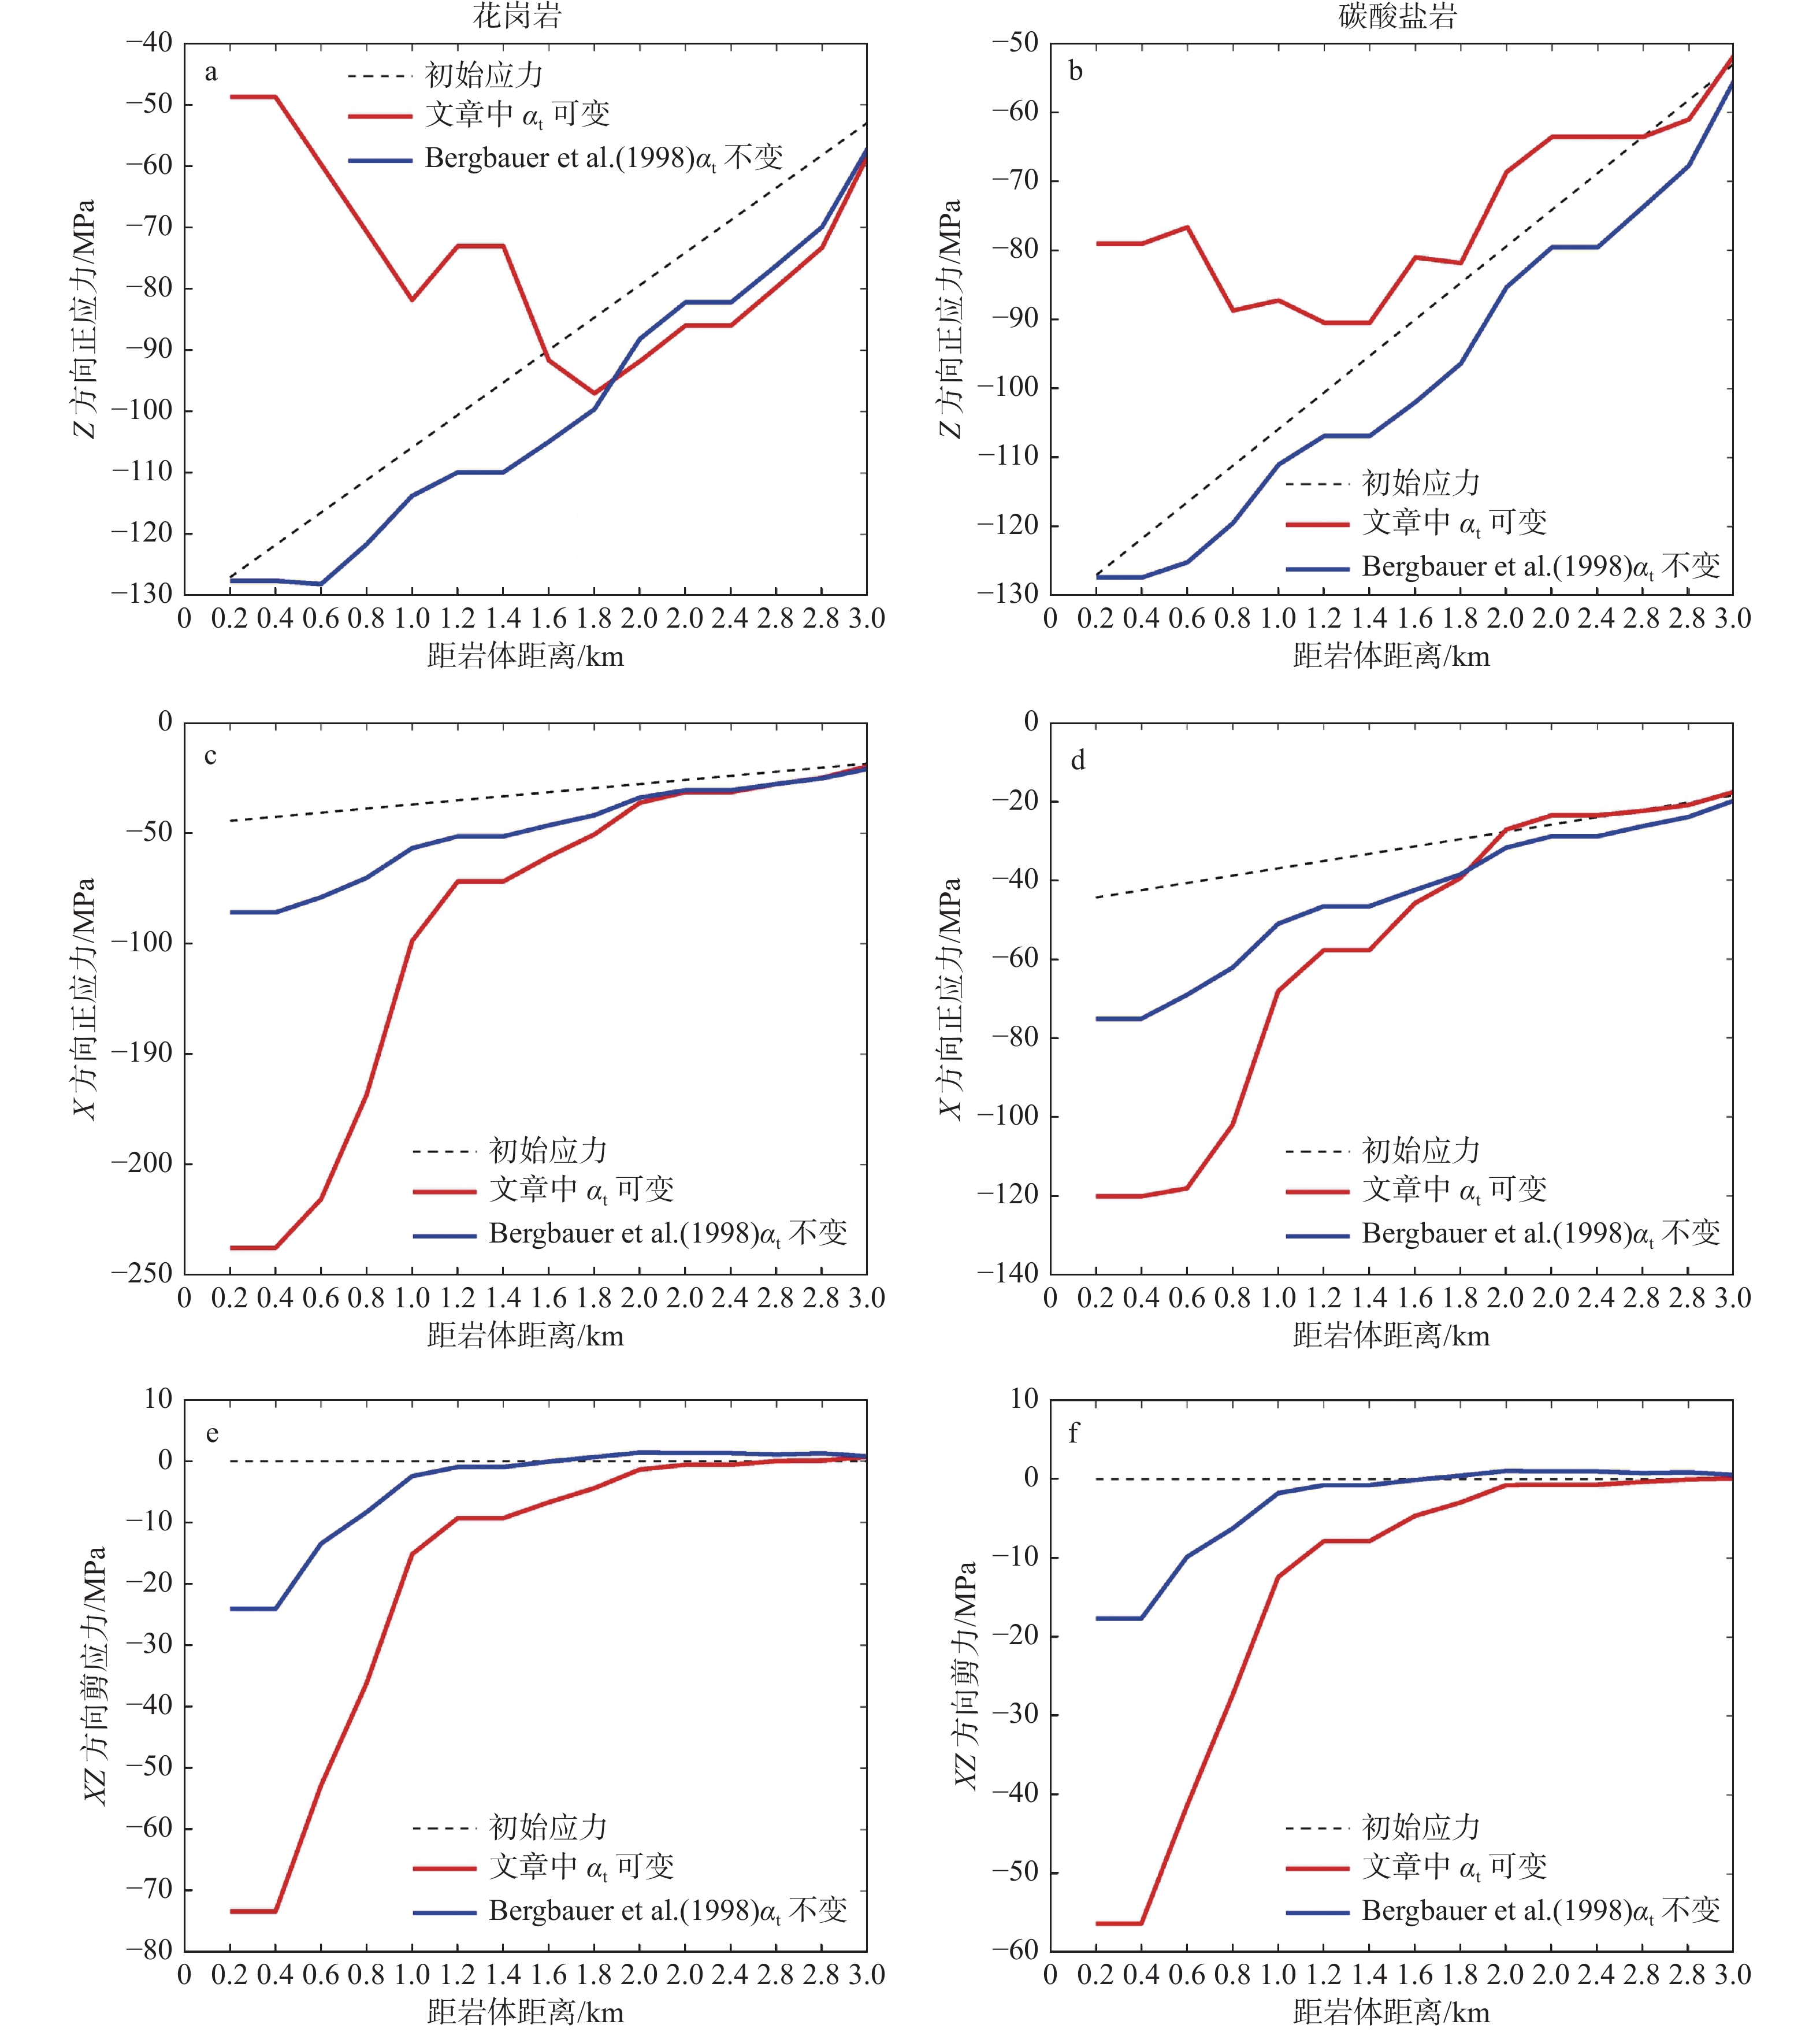
图 10 岩浆侵位至具有不同线性热膨胀系数的围岩所产生的热应力变化曲线
$ {\alpha }_{{\rm{t}}} $—线性热膨胀系数a、b—Z方向正应力;c、d—X方向正应力;e、f—XZ方向剪应力
Figure 10. Thermal stress change from granitic magma emplacement to surrounding rock with varying linear thermal expansion coefficients
(a, b) Normal stress in Z-direction; (c, d) Normal stress in X-direction; (e, f) Shear stress in XZ-direction$ {\alpha }_{t} $—The linear thermal expansion coefficients
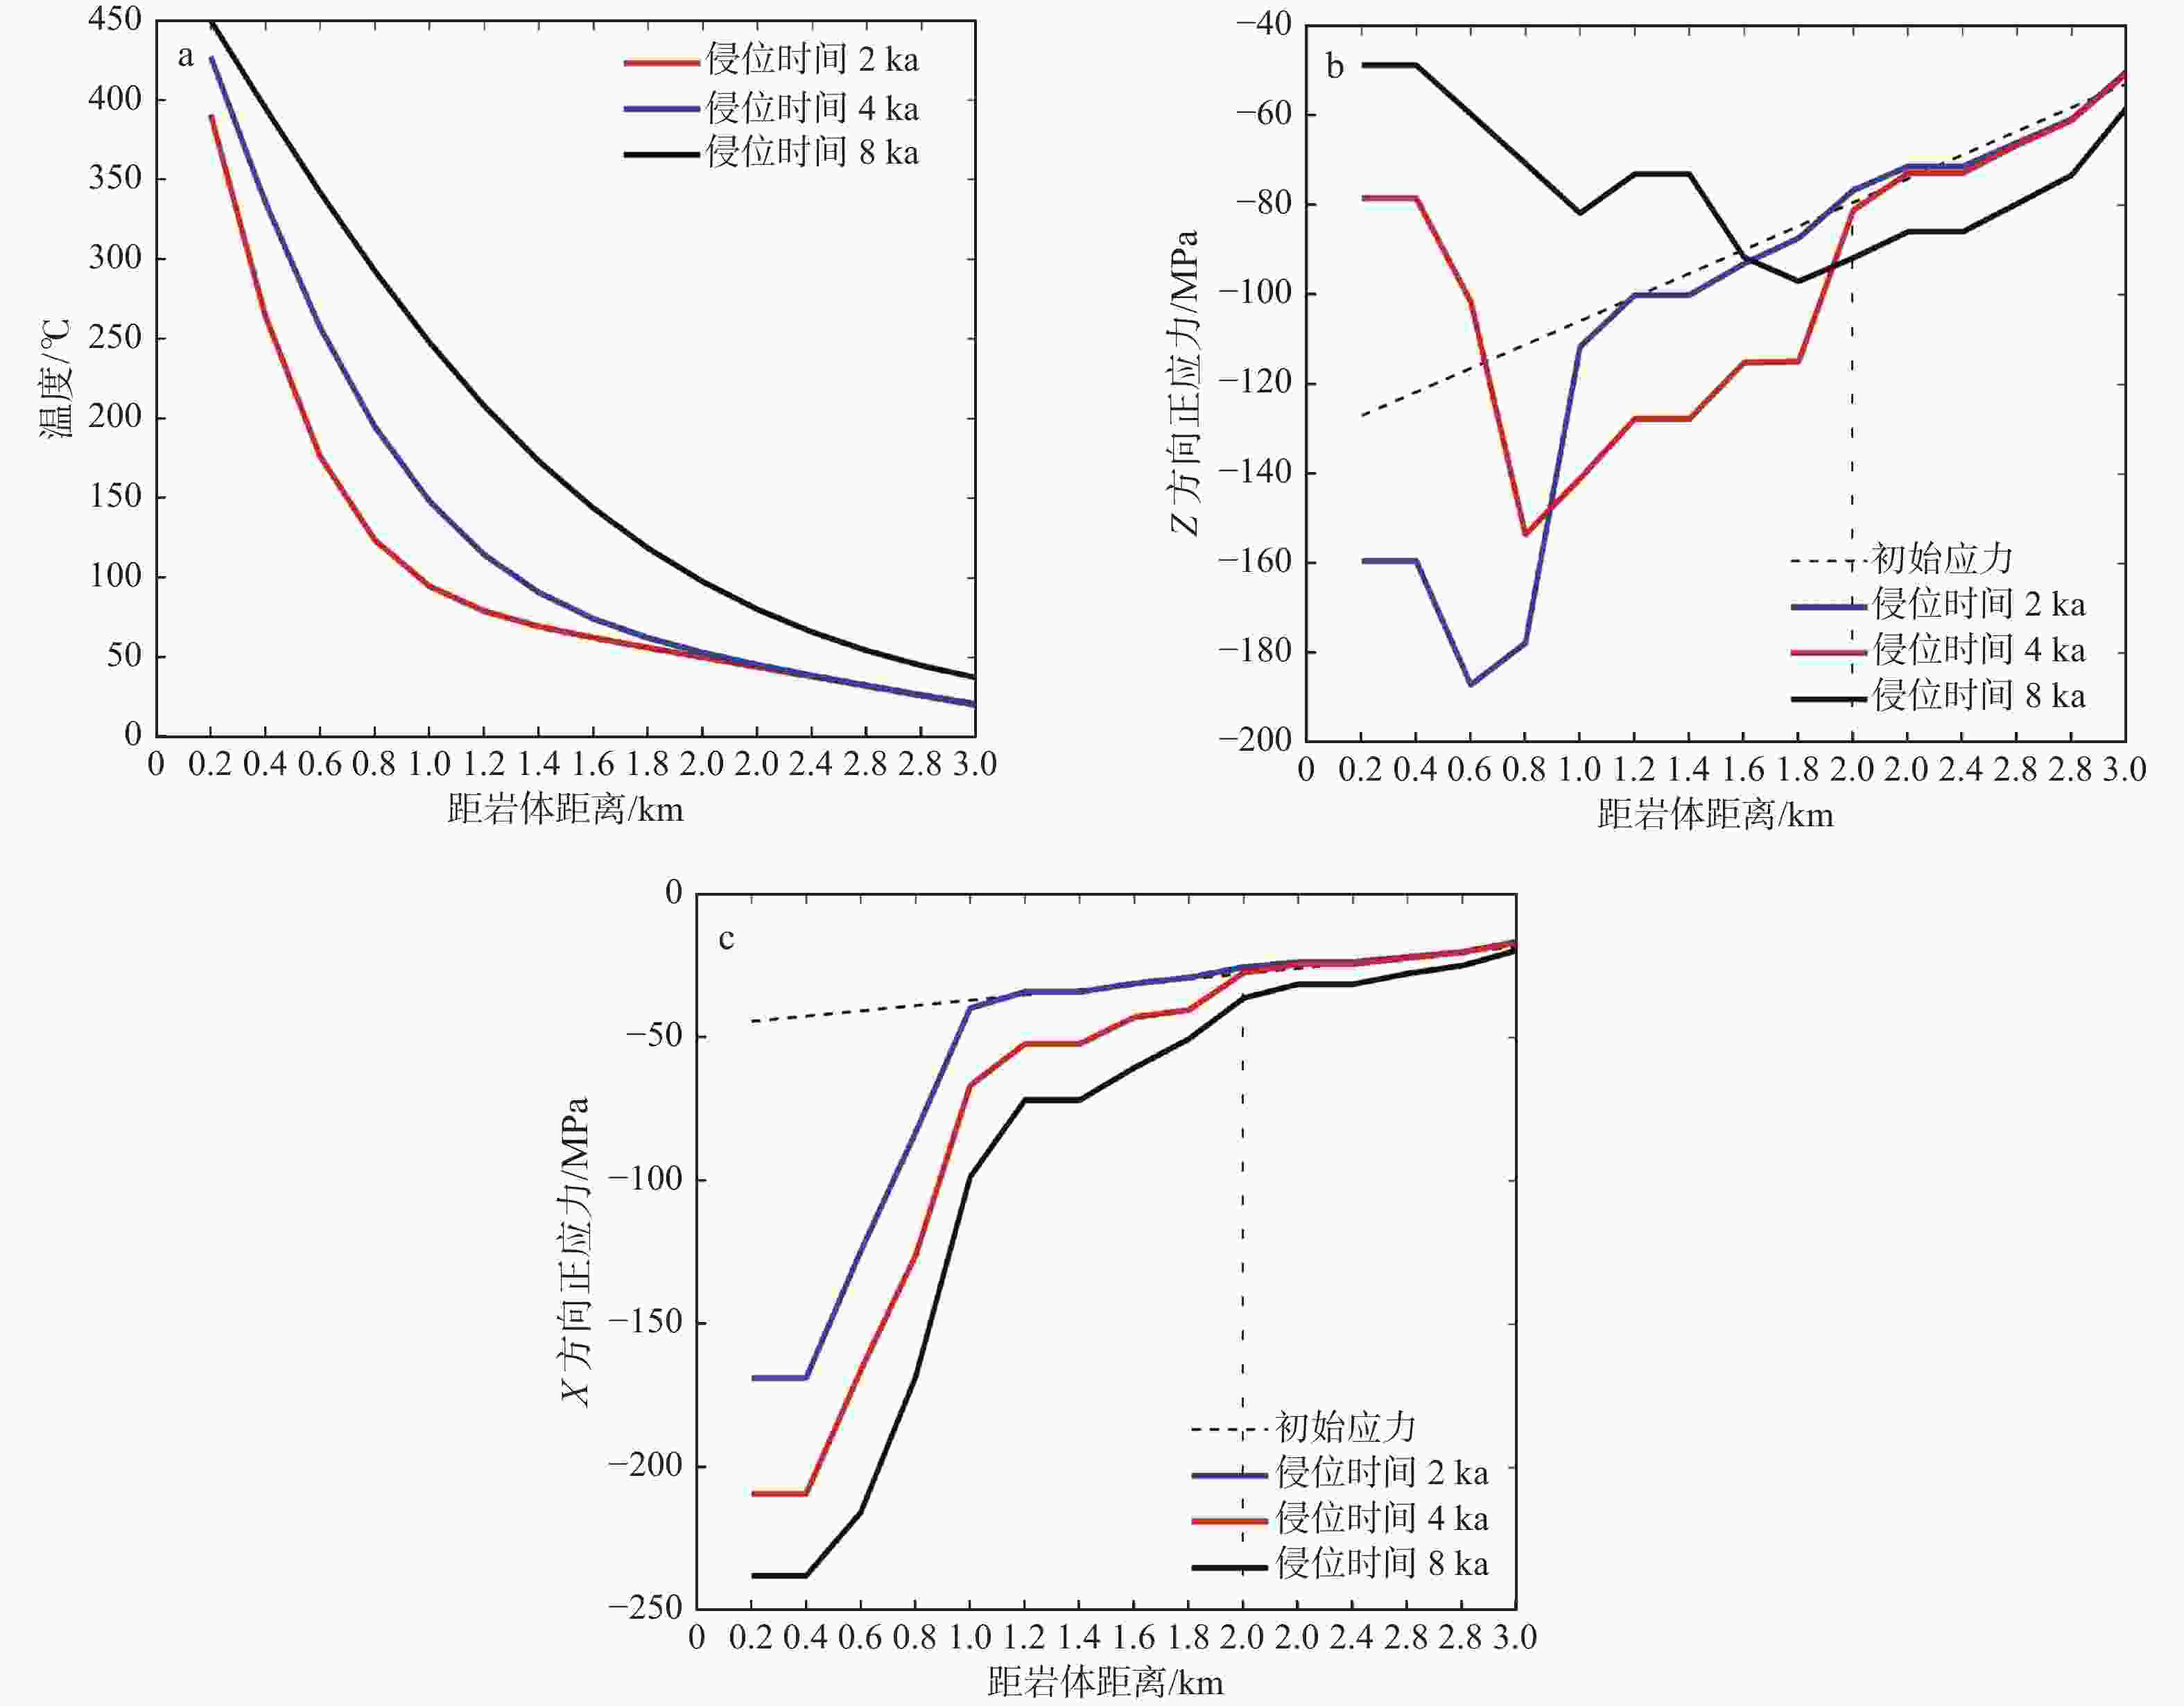
图 11 岩浆房上方(图1中L2)的温度和正应力变化曲线
a—温度场;b—Z方向正应力;c—X方向正应力
Figure 11. Spatial changes of temperature and normal stress in the upper part of the granitic magma center (see L2 in Fig. 1)
(a) Temperature field; (b) Normal stress in Z-direction; (c) Normal stress in X-direction
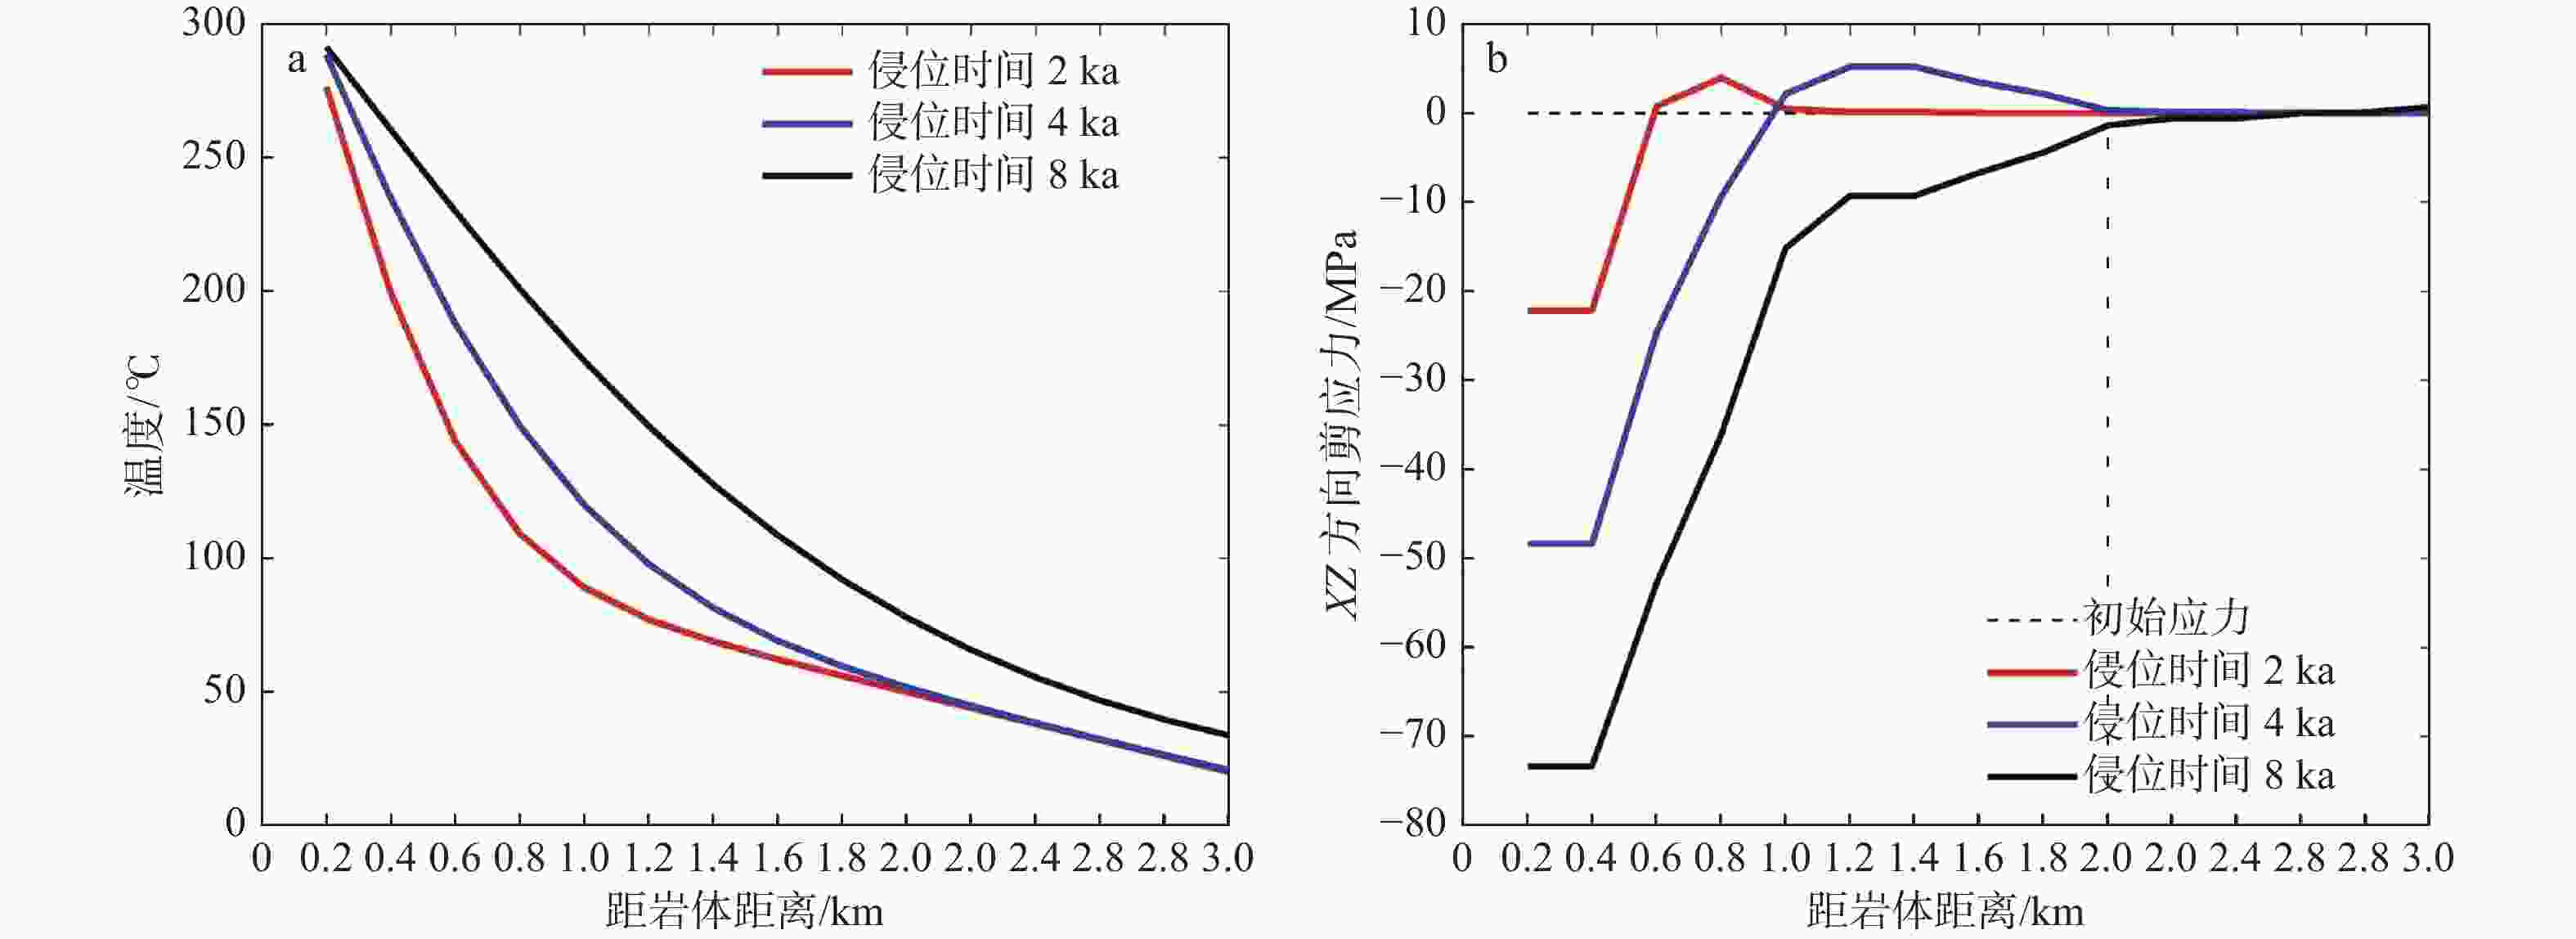
图 12 岩浆房左上角上方(图1中L1)温度和剪应力变化曲线
a—温度场;b—XZ方向剪应力
Figure 12. Spatial changes of temperature and shear stress in the upper left corner of the granitic magma center (see L1in Fig. 1)
(a) Temperature field; (b) Shear stress in XZ-direction
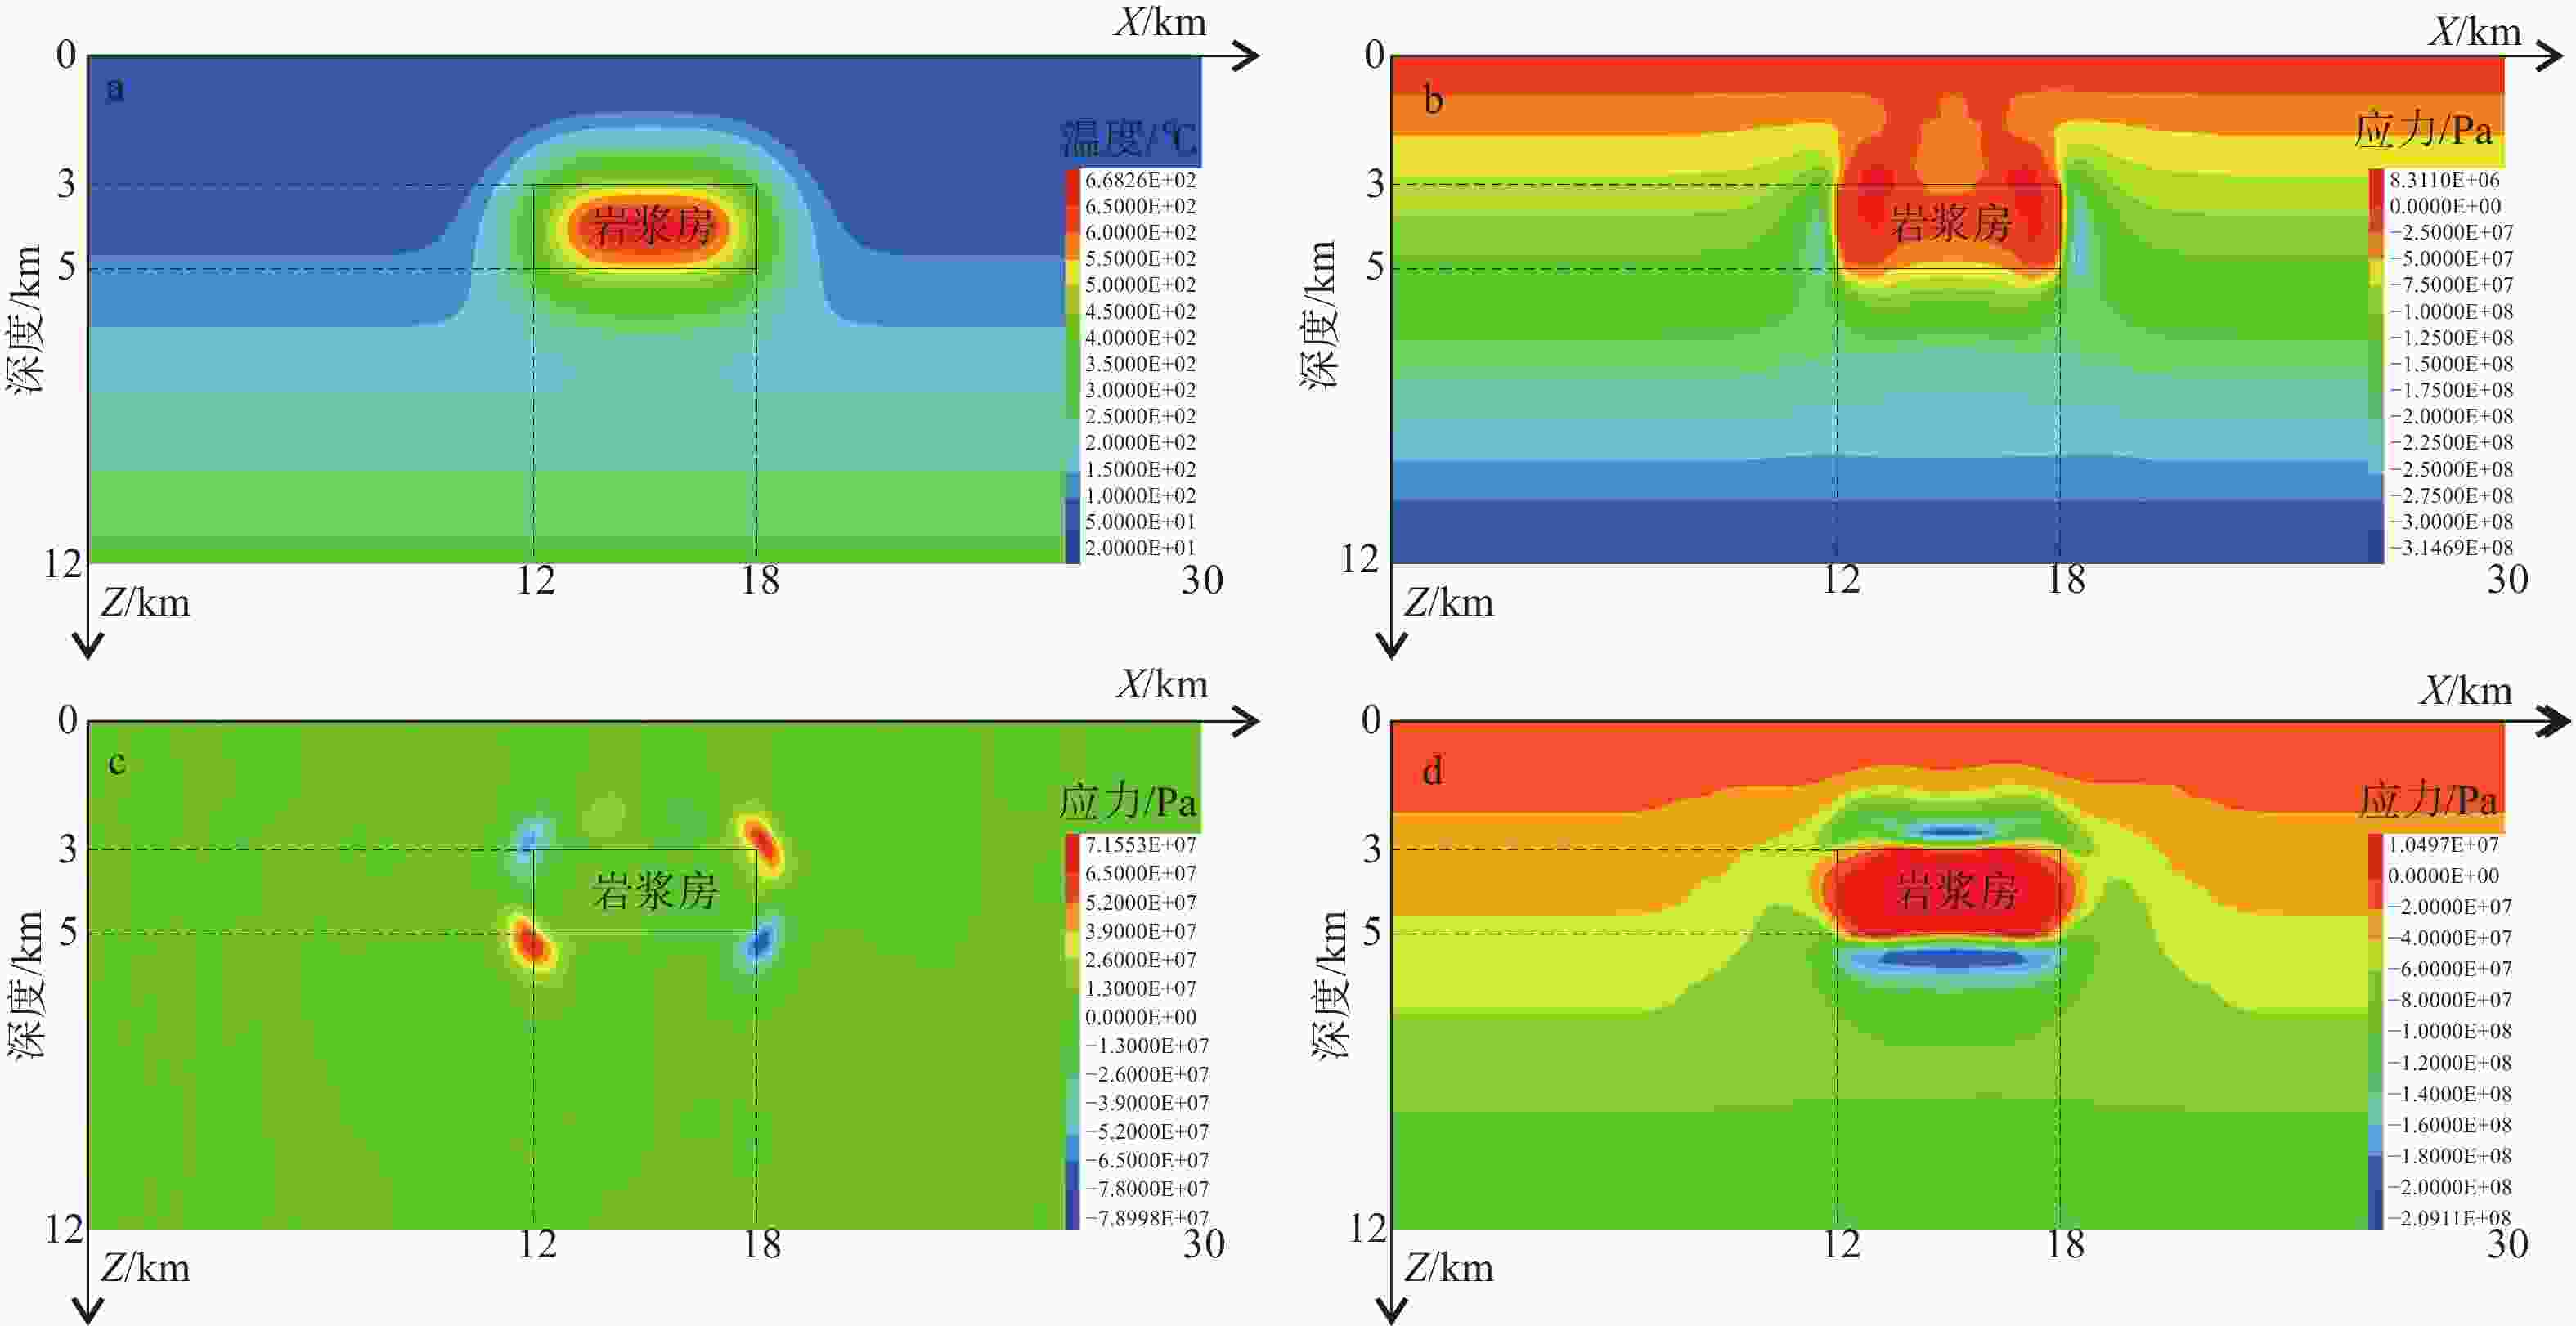
图 13 侵位深度为3 km侵位时间8 ka后的温度场和热应力场
a—温度场;b—Z方向正应力;c—XZ方向剪应力;d—X方向正应力
Figure 13. The distribution of temperature field and thermal stress around the granitic magma center at 3 km emplacement depth after 8 ka
(a) Temperature field; (b) Normal stress in Z-direction; (c) Shear stress in XZ-direction; (d) Normal stress in X-direction
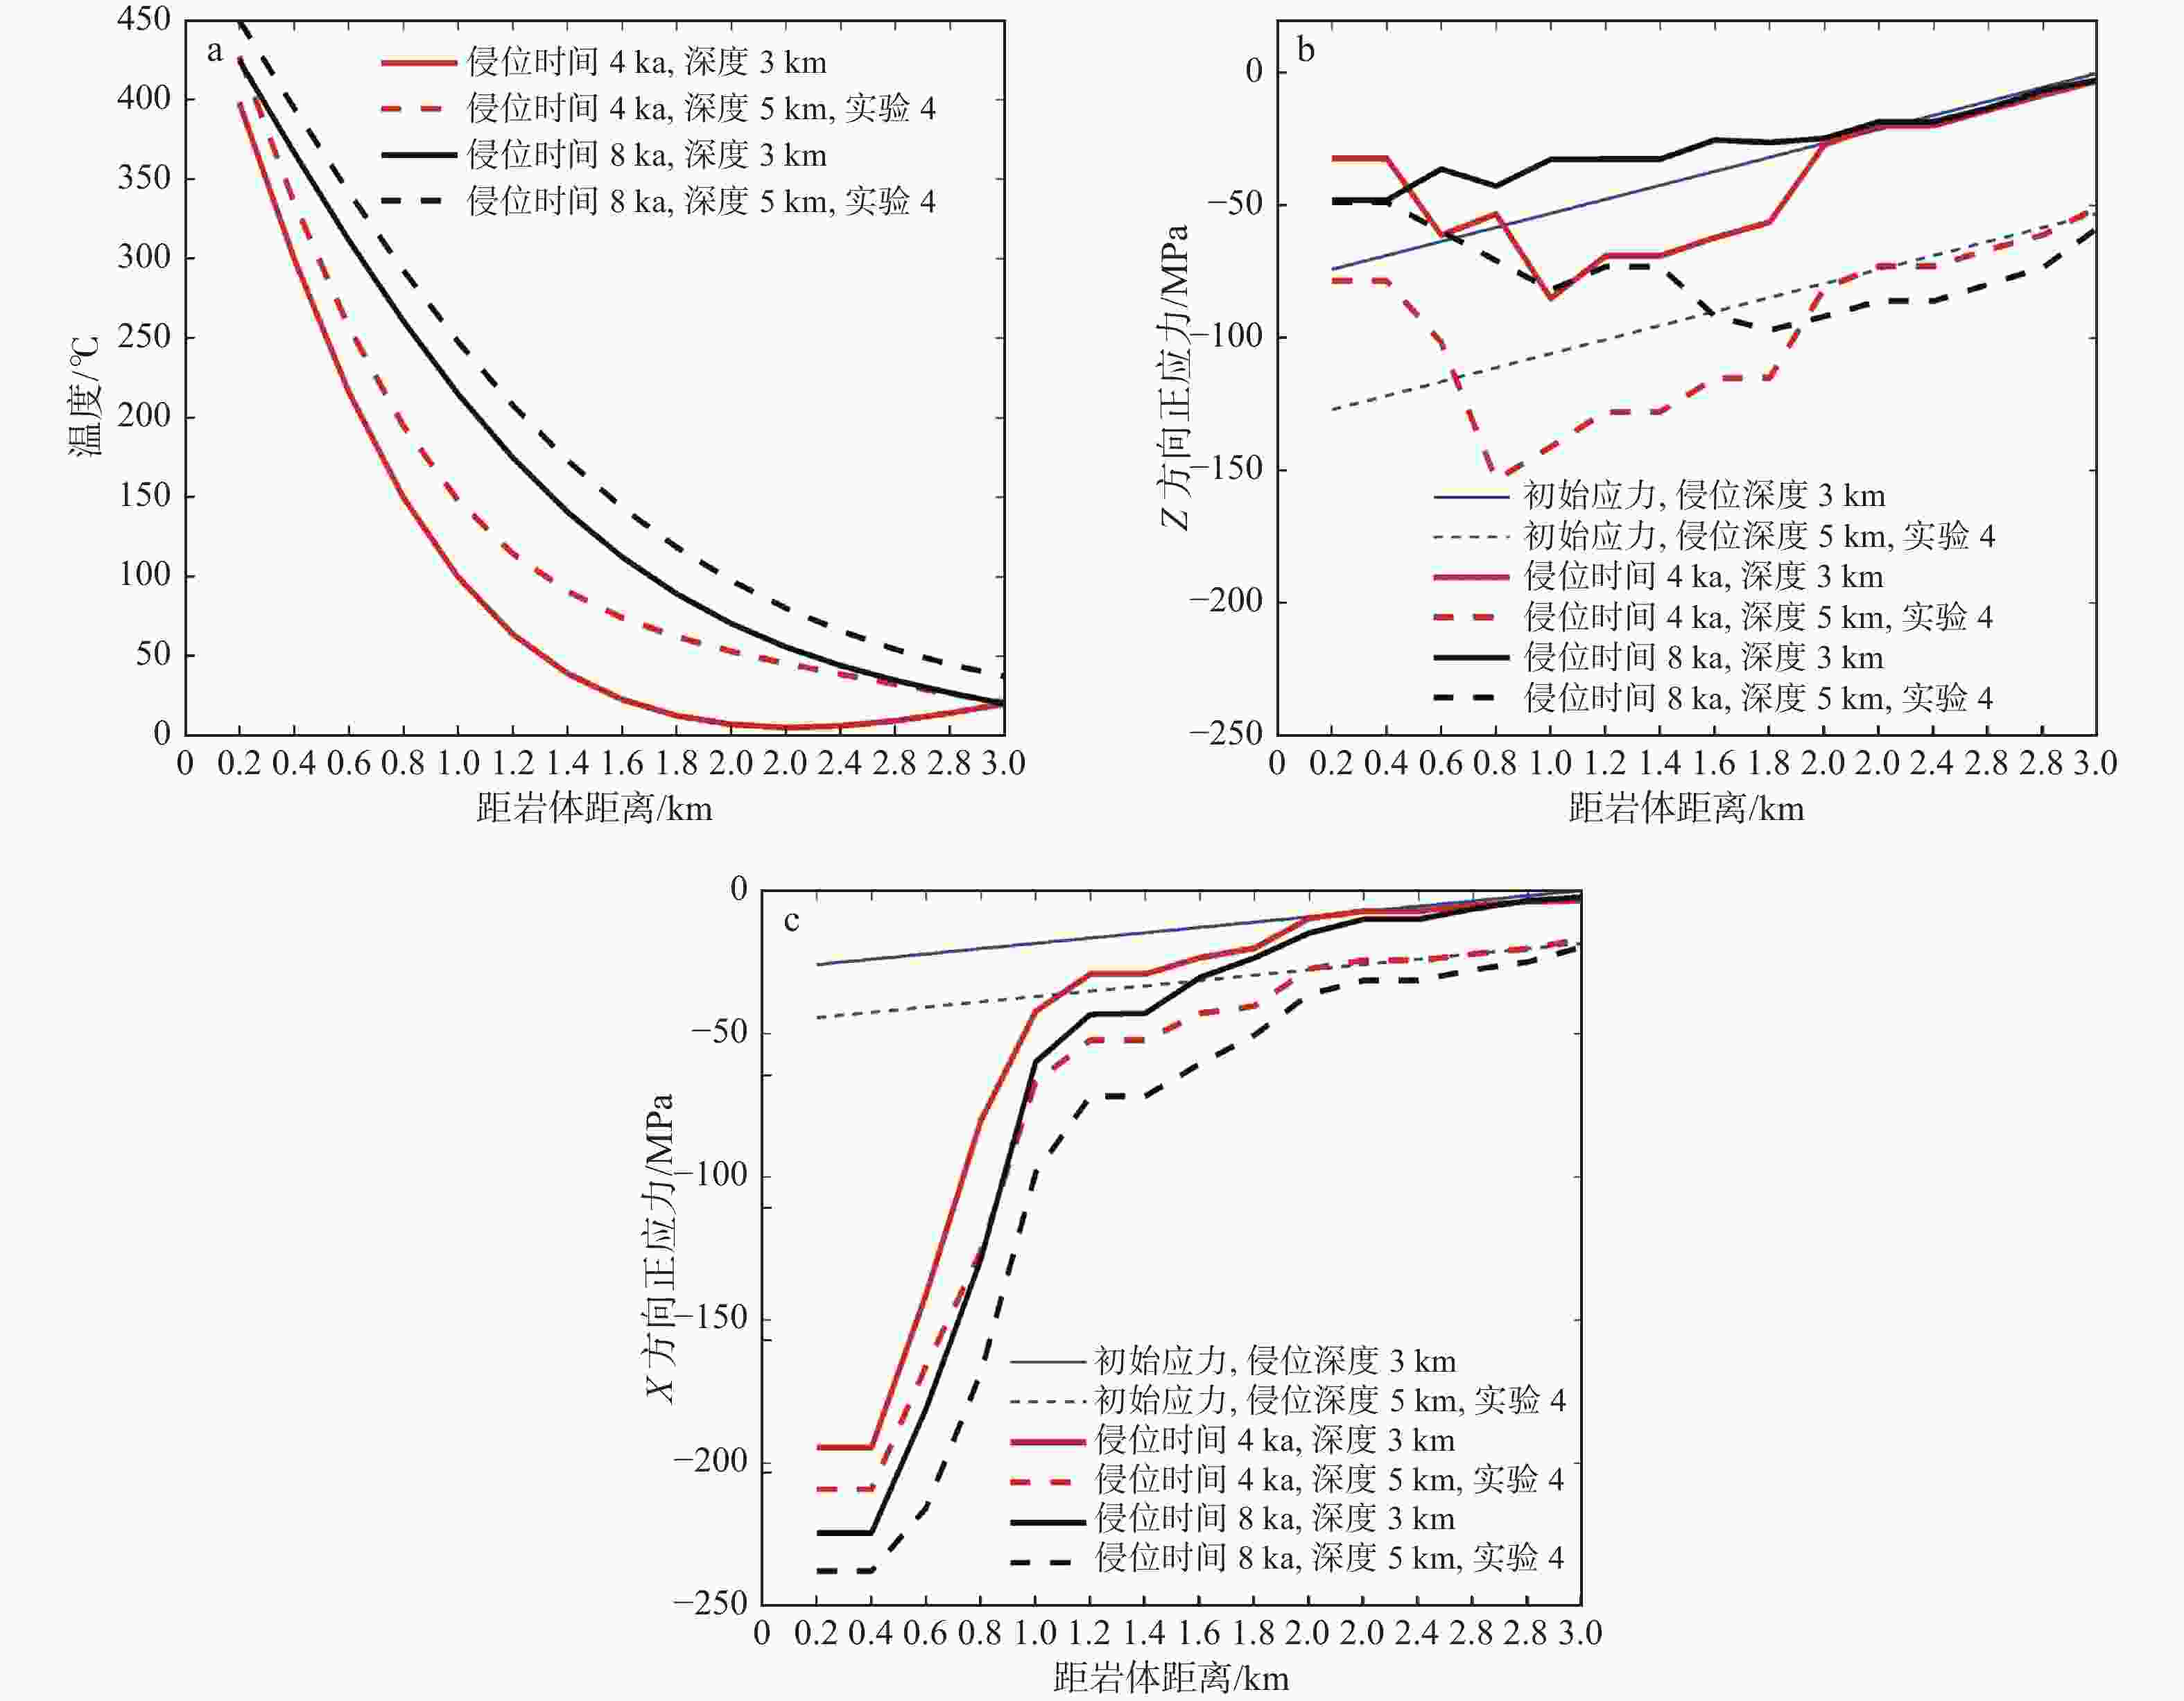
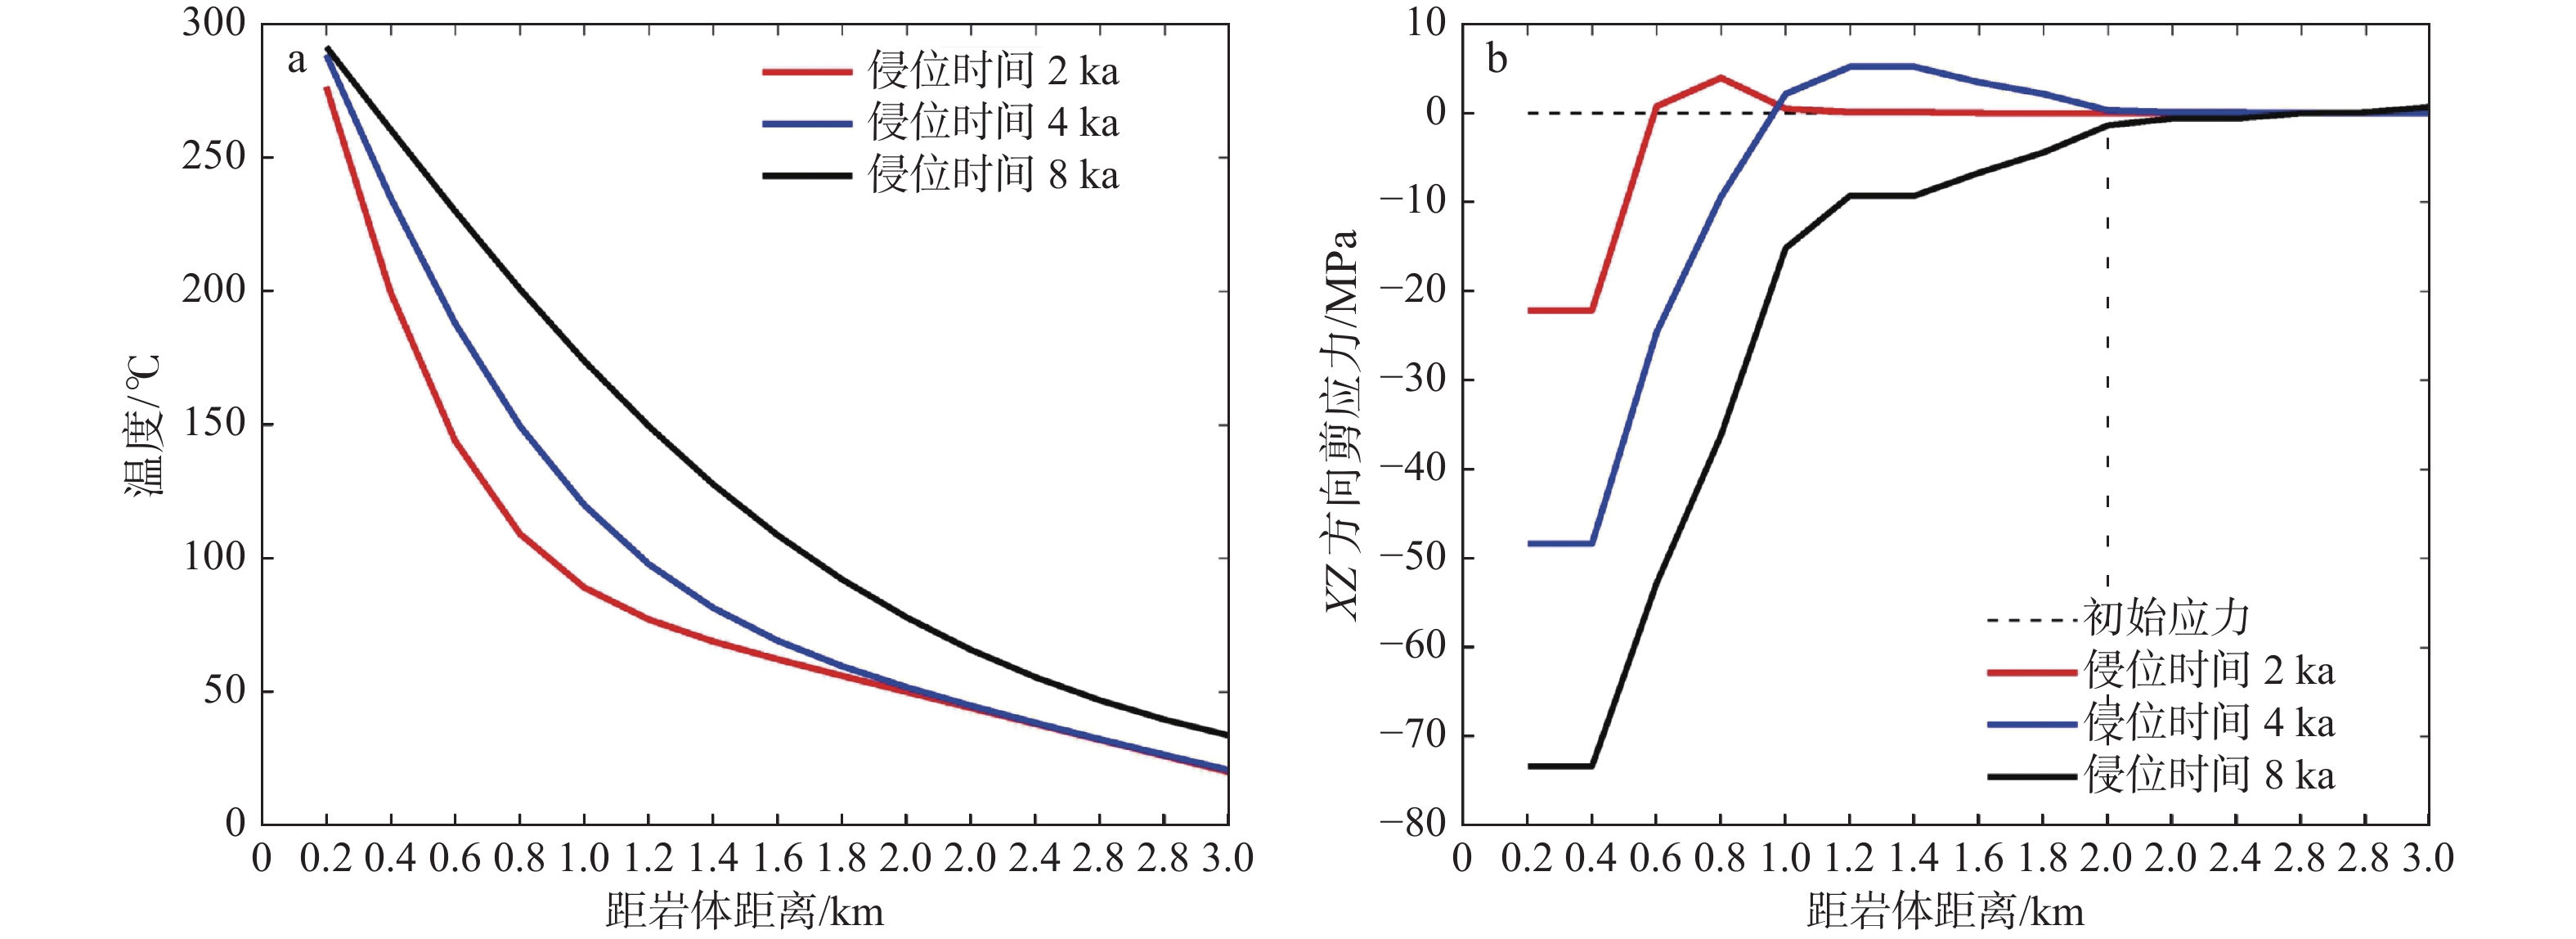
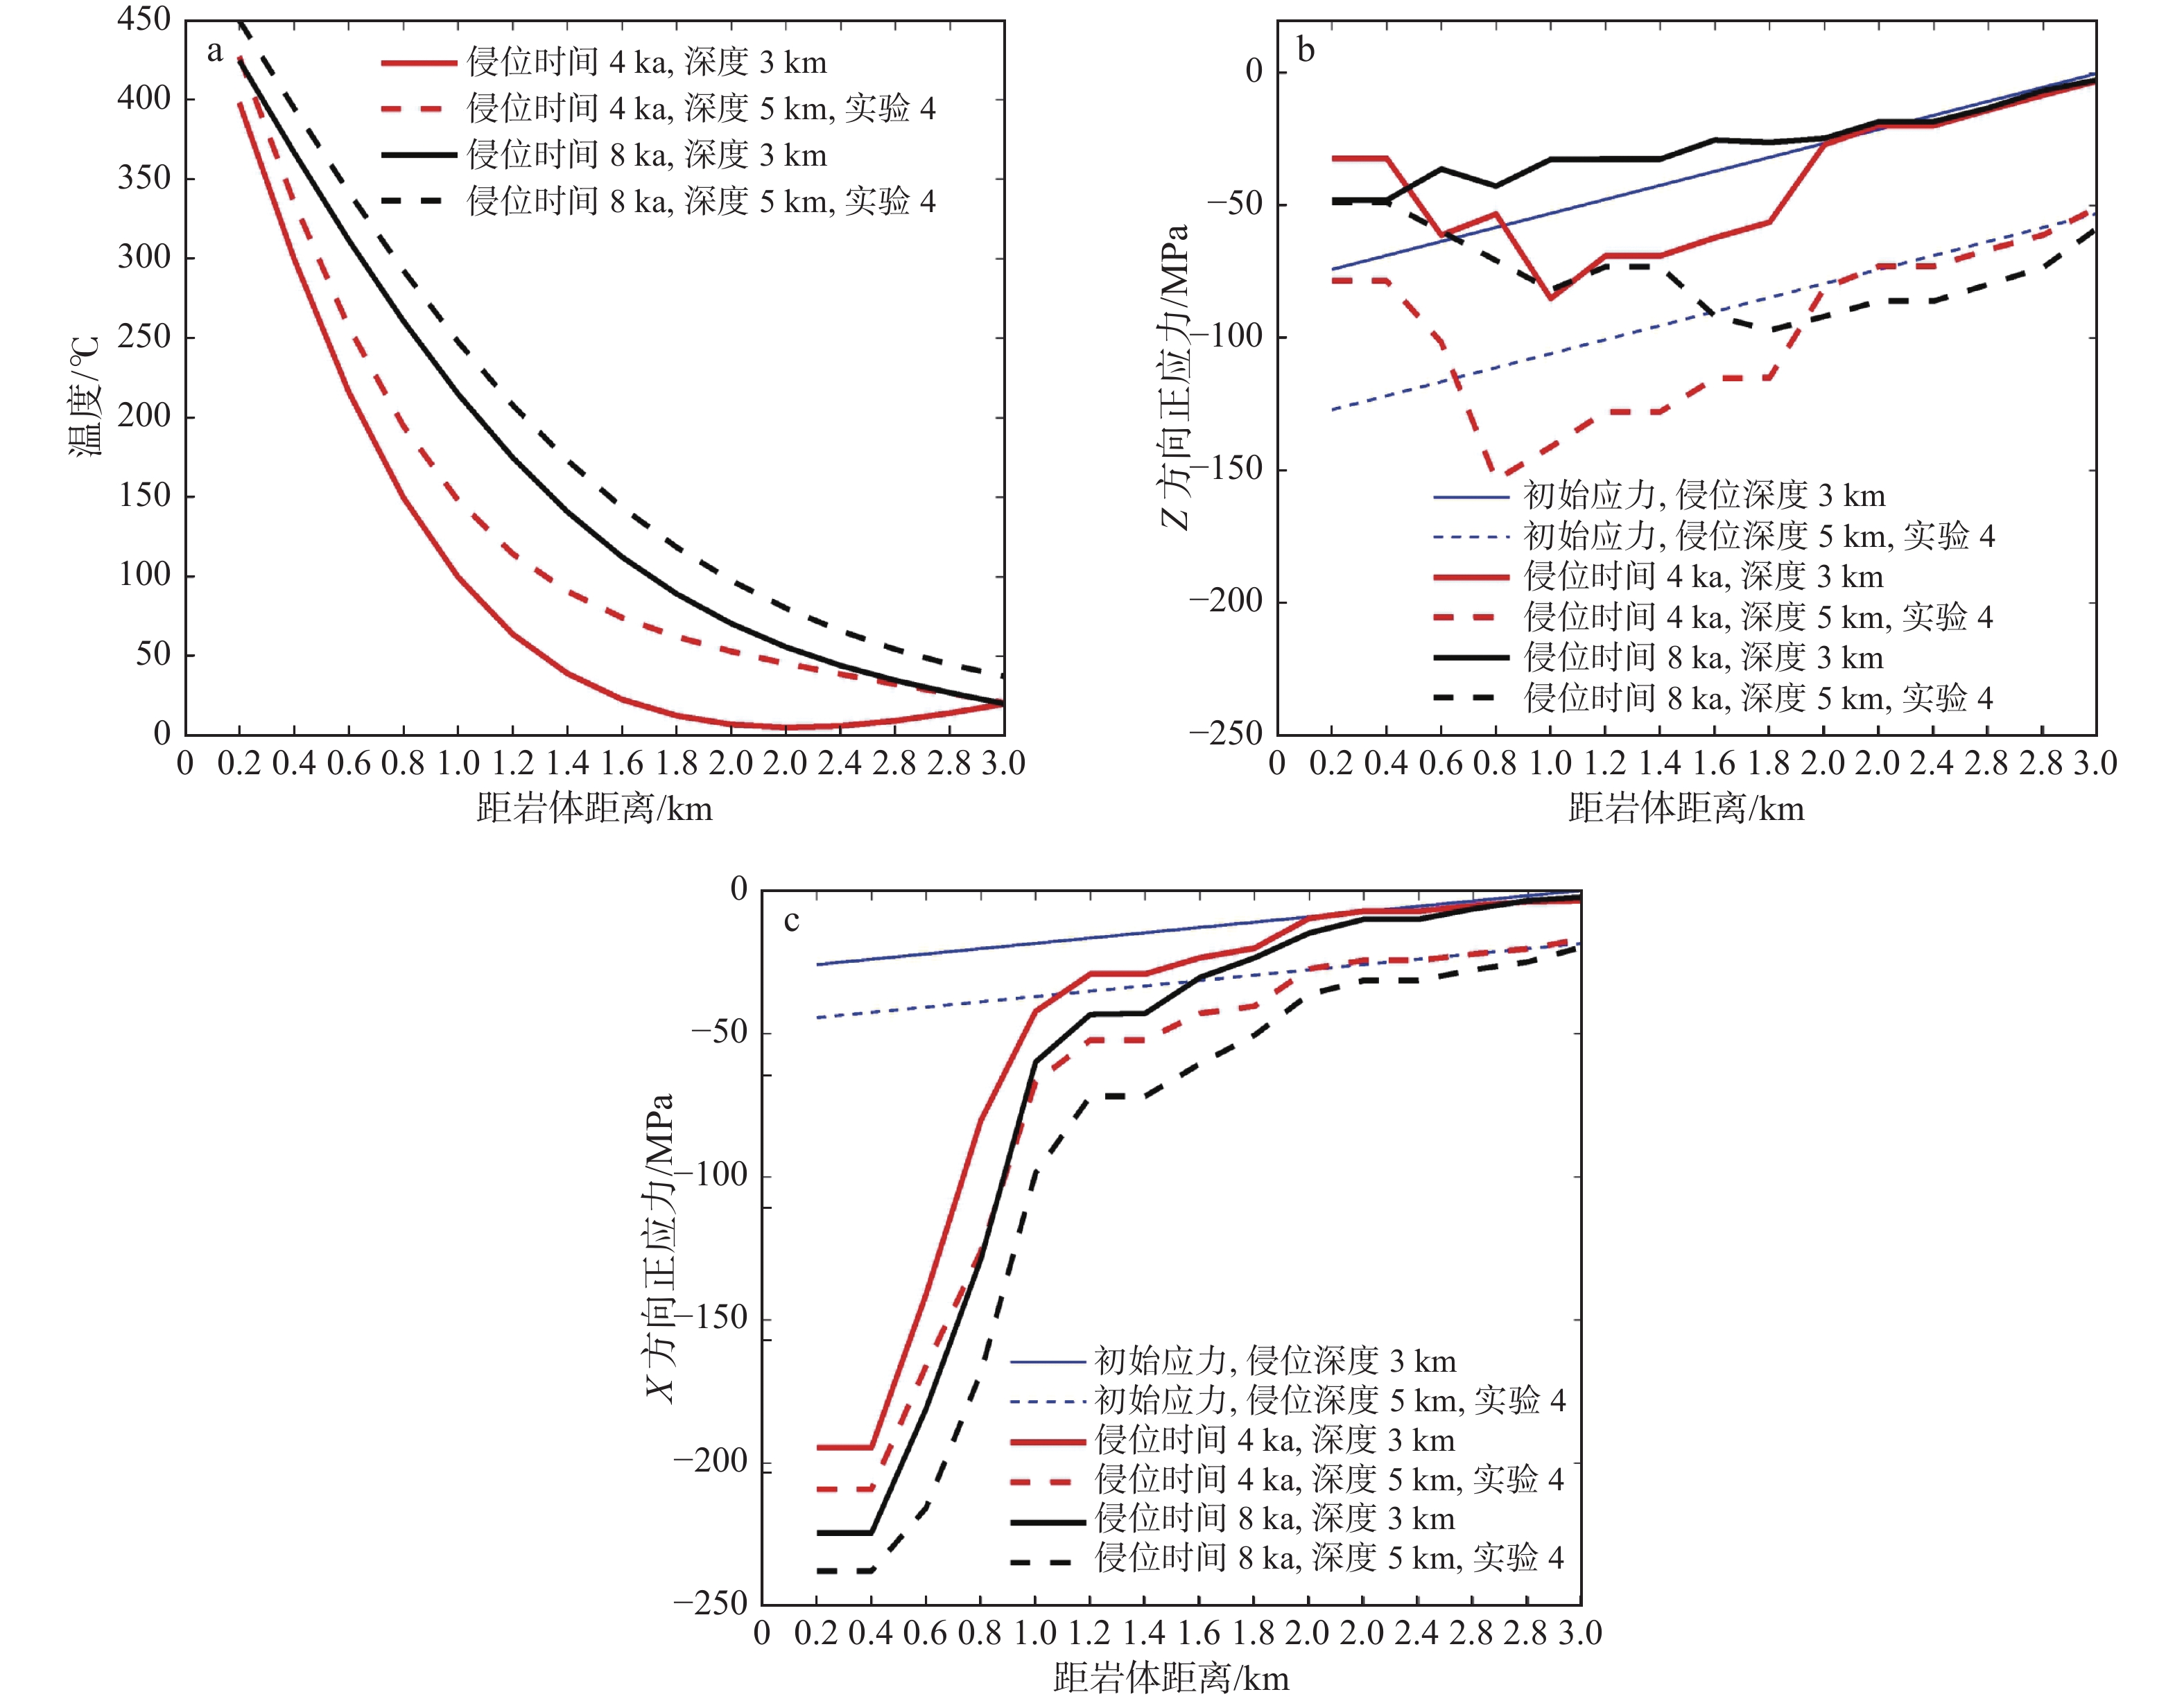
图 14 实验5与实验4的温度和正应力结果对比曲线
a—温度场;b—Z方向正应力;c—X方向正应力
Figure 14. The trend of temperature and normal stress for Experiment 5 compared to Experiment 4
(a) Temperature field; (b) Normal stress in Z-direction; (c) Normal stress in X-direction
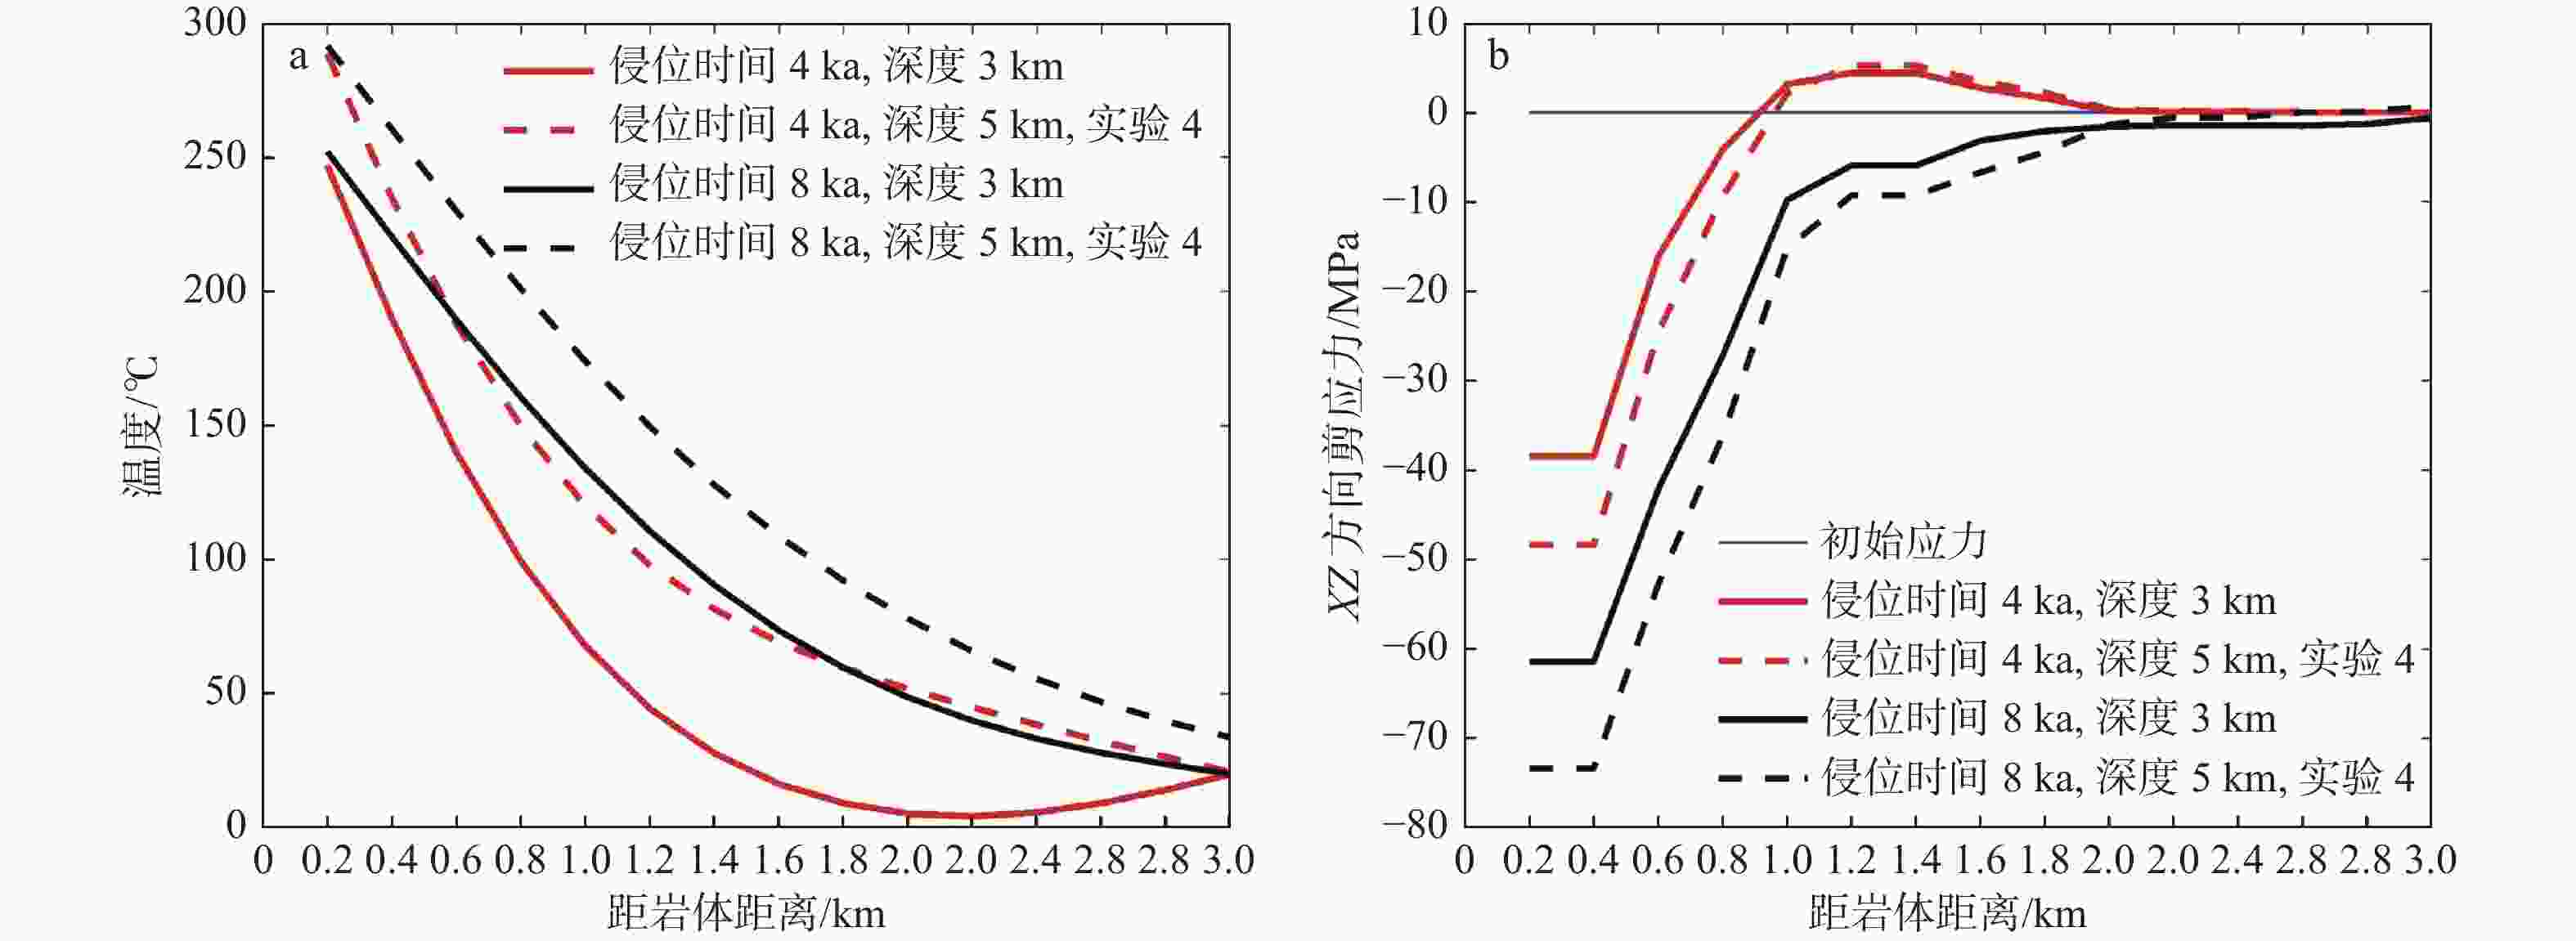
图 15 实验5与实验4的温度和剪应力结果对比曲线
a—温度场;b—XZ方向剪应力
Figure 15. The trends of temperature and shear stress for Experiment 5 compared to Experiment 4
(a) Temperature field; (b) Shear stress in XZ-direction
表 1 数值模拟实验中采用的岩石力学和热学参数
Table 1. Rock mechanics and thermal parameters used in numerical experiments
实验 序号 围岩 密度/
($ \mathrm{k}\mathrm{g}/{\mathrm{m}}^{3} $)杨氏模量/
$ \mathrm{G}\mathrm{P}\mathrm{a} $泊松比 抗拉强度/
$ \mathrm{M}\mathrm{P}\mathrm{a} $摩擦角/
(°)黏聚力/
$ \mathrm{M}\mathrm{P}\mathrm{a} $比热容/
$ \mathrm{J}/(\mathrm{k}\mathrm{g}\cdot \text{℃}) $热传导系数/
$ \mathrm{W}/(\mathrm{m}\cdot \text{℃}$)线性热膨胀系数/
(1/$ \text{℃} $)系列实验1 1-1 花岗岩 2700 60 0.25 10 50 23 800 2 由公式(7) 得出 1-2 2.5 1-3 3 系列实验2 2-1 花岗岩 2700 40 0.25 10 50 23 800 3 由公式(7) 得出 2-2 60 2-3 80 系列实验3 3-1 花岗岩 2700 60 0.25 10 50 23 800 3 由公式(7) 得出 3-2 花岗岩 $ 1.8\times {10}^{-6} $ 3-3 碳酸盐岩 45 由公式(8)得出 3-4 碳酸盐岩 $ 1.8\times {10}^{-6} $ 实验4 1-3、2-3、3-1 花岗岩 2700 60 0.25 10 50 23 800 3 由公式(7) 得出 实验5 — 花岗岩 2700 60 0.25 10 50 23 800 3 由公式(7) 得出  下载: 导出CSV
-
[1] ABOOTALEBI P, SIEMENS G, 2018. Thermal properties of engineered barriers for a Canadian deep geological repository[J]. Canadian Geotechnical Journal, 55(6): 759-776. doi: 10.1139/cgj-2017-0150 [2] AHRENS T J, 1995. Mineral physics & crystallography: a handbook of physical constants[M]. Washington: American Geophysical Union. [3] ANNEN C, LATYPOV R, CHISTYAKOVA S, et al. , 2022. Catastrophic growth of totally molten magma chambers in months to years[J]. Science Advances, 8(38): eabq0394. doi: 10.1126/sciadv.abq0394 [4] ARTEMIEVA I M, THYBO H, JAKOBSEN K, et al. , 2017. Heat production in granitic rocks: Global analysis based on a new data compilation GRANITE2017[J]. Earth-Science Reviews, 172: 1-26. doi: 10.1016/j.earscirev.2017.07.003 [5] BARBOZA S A, BERGANTZ G W, 1996. Dynamic model of dehydration melting motivated by a natural analogue: applications to the Ivrea–Verbano zone, northern Italy[J]. Earth and Environmental Science Transactions of the Royal Society of Edinburgh, 87(1-2): 23-31. doi: 10.1017/S0263593300006441 [6] BEA F, 2012. The sources of energy for crustal melting and the geochemistry of heat-producing elements[J]. Lithos, 153: 278-291. doi: 10.1016/j.lithos.2012.01.017 [7] BERGBAUER S, MARTEL S J, HIERONYMUS C F, 1998. Thermal stress evolution in cooling pluton environments of different geometries[J]. Geophysical Research Letters, 25(5): 707-710. doi: 10.1029/98GL00047 [8] BERGBAUER S, MARTEL S J, 1999. Formation of joints in cooling plutons[J]. Journal of Structural Geology, 21(7): 821-835. doi: 10.1016/S0191-8141(99)00082-6 [9] BIOT M A, 1956. Thermoelasticity and irreversible thermodynamics[J]. Journal of Applied Physics, 27(3): 240-253. doi: 10.1063/1.1722351 [10] BOHRSON W A, SPERA F J, 2001. Energy-constrained open-system magmatic processes II: application of energy-constrained assimilation–fractional crystallization (EC-AFC) model to magmatic systems[J]. Journal of Petrology, 42(5): 1019-1041. doi: 10.1093/petrology/42.5.1019 [11] CAO H W, 2015. Research on Mesozoic-Cenozoic magmatic evolution and its relation with metallogeny in Tengchong-Lianghe tin ore belt, Western Yunnan[D]. Beijing: China University of Geosciences (Beijing): 1-340. (in Chinese with English abstract) [12] CATHLES L M, ERENDI A H J, BARRIE T, 1997. How long can a hydrothermal system be sustained by a single intrusive event? [J]. Economic Geology, 92(7-8): 766-771. doi: 10.2113/gsecongeo.92.7-8.766 [13] CEN K, TIAN Z X, 2012. Ore-forming system around magma — model of spatial zonation for magmatic rock and deposit set[J]. Geoscience, 26(5): 1051-1057. (in Chinese with English abstract) [14] CHANG C, LUO G, 2022. The fracture forming mechanism at the top of the intrusion body in porphyry deposits: the insights from a multi-physical field coupled numerical model[J]. Chinese Journal of Geophysics, 65(8): 3006-3024. (in Chinese with English abstract) [15] CHAPPELL B W, WHITE A J R, WILLIAMS I S, et al. , 2004. Low- and high-temperature granites[J]. Transactions of the Royal Society of Edinburgh: Earth Sciences, 95, 125–140. [16] CHEN B L, GAO Y, 2022. Study on ore-bearing fracture system of veinlet orebody in Tongchang porphyry copper deposit, Dexing of Jiangxi[J]. Mineral Deposits, 41(6): 1093-1107. (in Chinese with English abstract) [17] CHEN Y, WU X D, ZHANG F Q, 1999. Experimental study on thermal cracking of rocks[J]. Chinese Science Bulletin, 44(8): 880-883. (in Chinese) doi: 10.1360/csb1999-44-8-880 [18] CHEN Y M, XU D P, 2013. FLAC/FLAC 3D fundamentals and engineering examples[M]. 2nd ed. Beijing: China Water & Power Press. (in Chinese) [19] COLEMAN D S, GRAY W, GLAZNER A F, 2004. Rethinking the emplacement and evolution of zoned plutons: Geochronologic evidence for incremental assembly of the Tuolumne Intrusive Suite, California[J]. Geology, 32(5): 433-436. doi: 10.1130/G20220.1 [20] CRUDEN A R, MCCAFFREY K J W, 2001. Growth of plutons by floor subsidence: implications for rates of emplacement, intrusion spacing and melt-extraction mechanisms[J]. Physics and Chemistry of the Earth, Part A: Solid Earth and Geodesy, 26(4-5): 303-315. doi: 10.1016/S1464-1895(01)00060-6 [21] DWIVEDI R D, GOEL R K, PRASAD V V R, et al. , 2008. Thermo-mechanical properties of Indian and other granites[J]. International Journal of Rock Mechanics and MINING SCIENCES, 45(3): 303-315. doi: 10.1016/j.ijrmms.2007.05.008 [22] DUHAMEL J M C, 1837. Second mémoire sur les phénoménes thermo-mécaniques[J]. J de l’École Polytechnique,15(25): 1–57. [23] ELLIS J F, BLENKINSOP T, 2019. Analogue modelling of fracturing in cooling plutonic bodies[J]. Tectonophysics, 766: 14-19. doi: 10.1016/j.tecto.2019.05.019 [24] ENGLISH J M, 2012. Thermomechanical origin of regional fracture systems[J]. AAPG Bulletin, 96(9): 1597-1625. doi: 10.1306/01021211018 [25] ESLAMI M R, HETNARSKI R B, IGNACZAK J, et al. , 2013. Theory of elasticity and thermal stresses: explanations, problems and solutions[M]. Dordrecht: Springer. [26] EVANS D J, ROWLEY W J, CHADWICK R A, et al. , 1994. Seismic reflection data and the internal structure of the Lake District batholith, Cumbria, northern England[J]. Proceedings of the Yorkshire Geological Society, 50: 11-24. doi: 10.1144/pygs.50.1.11 [27] FAN Y L, GAO J W, YU S, et al. , 2023. Prediction and analysis on large deformation of surrounding rocks in the Muzhailing Tunnel of the Weiyuan–Wudu Expressway under high in-situ stress[J]. Journal of Geomechanics, 29(6): 786-800. (in Chinese with English abstract) [28] FANG G C, WANG D H, FENG Z X, et al. , 2021. The fan-like distribution of ore veins in the quartz-vein type tungsten deposits in South China and its prospecting significance[J]. Geotectonica et Metallogenia, 45(3): 523-533. (in Chinese with English abstract) [29] FOURIER J B J, 2009. The analytical theory of heat[M]. Cambridge: Cambridge University Press: 466. [30] FU H F, ZHANG B H, GE J H, et al. , 2019. Thermal diffusivity and thermal conductivity of granitoids at 283-988 K and 0.3-1.5 GPa [J]. American Mineralogist, 104(11): 1533-1545. doi: 10.2138/am-2019-7099 [31] GERCEK H, 2007. Poisson's ratio values for rocks[J]. International Journal of Rock Mechanics and Mining Sciences, 44(1): 1-13. doi: 10.1016/j.ijrmms.2006.04.011 [32] GERDES M L, BAUMGARTNER L P, PERSON M, 1998. Convective fluid flow through heterogeneous country rocks during contact metamorphism[J]. Journal of Geophysical Research: Solid Earth, 103(B10): 23983-24003. doi: 10.1029/98JB02049 [33] GERLA P J, 1988. Stress and fracture evolution in a cooling pluton: An example from the Diamond Joe stock, western Arizona, U. S. A. [J]. Journal of Volcanology and Geothermal Research, 34(3-4): 267-282. doi: 10.1016/0377-0273(88)90038-8 [34] GHIORSO M S, 1991. Temperatures in and around cooling magma bodies[M]//PERCHUK L L. Progress in metamorphic and magmatic petrology: a memorial volume in Honour of D. S. Korzhinskiy. Cambridge: Cambridge University Press: 387-410. [35] GU D S, LI X B, 2003. Science problems and research state of deep mining in metal and nonferrous mines[J]. Mining Research and Development, 23(S1): 1-5. (in Chinese with English abstract) [36] Guangdong Nonferrous Metal Geological Exploration Company 932 Team, 1966. How we use the "five-story" law to find, evaluate and explore wolframite quartz vein deposits[J]. Geology and Exploration, (5): 15-19. (in Chinese) [37] GUILLOU-FROTTIER L, BUROV E, 2003. The development and fracturing of plutonic apexes: implications for porphyry ore deposits[J]. Earth and Planetary Science Letters, 214(1-2): 341-356. doi: 10.1016/S0012-821X(03)00366-2 [38] HAN X H, CHU Z H, ZHANG Y Z, 2005. Thermal-induced rock cracking and its significance in engineering[J]. Petroleum Geology & Experiment, 27(1): 98-100. (in Chinese with English abstract) [39] HEARD H C, PAGE L, 1982. Elastic moduli, thermal expansion, and inferred permeability of two granites to 350°C and 55 megapascals[J]. Journal of Geophysical Research: Solid Earth, 87(B11): 9340-9348. doi: 10.1029/JB087iB11p09340 [40] HEUZE F E, 1983. High-temperature mechanical, physical and thermal properties of granitic rocks—a review[J]. International Journal of Rock Mechanics and Mining Sciences & Geomechanics Abstracts, 20(1): 3-10. [41] HU H, ARGYROPOULOS S A, 1996. Mathematical modelling of solidification and melting: a review[J]. Modelling and Simulation in Materials Science and Engineering, 4(4): 371. doi: 10.1088/0965-0393/4/4/004 [42] HUPPERT H E, SPARKS R S J, 1988. The generation of granitic magmas by intrusion of basalt into continental crust[J]. Journal of Petrology, 29(3): 599-624. doi: 10.1093/petrology/29.3.599 [43] ITASCA CONSULTING GROUP INC, 2012. FLAC 3D Fast Lagrangian Analysis of Continua in 3 Dimensions—FLAC 3D help. Minneapolis, Minnesota. [44] KUMARI W G P, RANJITH P G, PERERA M S A, et al. , 2017. Mechanical behaviour of Australian Strathbogie granite under in-situ stress and temperature conditions: an application to geothermal energy extraction[J]. Geothermics, 65: 44-59. doi: 10.1016/j.geothermics.2016.07.002 [45] LANGE R A, CASHMAN K V, NAVROTSKY A, 1994. Direct measurements of latent heat during crystallization and melting of a ugandite and an olivine basalt[J]. Contributions to Mineralogy and Petrology, 118(2): 169-181. doi: 10.1007/BF01052867 [46] LESSEN M, 1956. Thermoelasticity and thermal shock[J]. Journal of the Mechanics and Physics of Solids, 5(1): 57-61. doi: 10.1016/0022-5096(56)90007-2 [47] LI W T, HUANG B H, BI Z B, 2004. Thermal stress theory analysis and application[M]. Beijing: China Electric Power Press. (in Chinese) [48] LI Z H, CHI G X, BETHUNE K M, 2016. The effects of basement faults on thermal convection and implications for the formation of unconformity‐related uranium deposits in the Athabasca Basin, Canada[J]. Geofluids, 16(4): 729-751. doi: 10.2113/econgeo.112.2.451 [49] LI Z H, CHI G X, BETHUNE K M, et al. , 2017. Structural controls on fluid flow during compressional reactivation of basement faults: insights from numerical modeling for the formation of unconformity-related uranium deposits in the Athabasca Basin, Canada[J]. Economic Geology, 112(2): 451-466. [50] LIENHARD V J H, LIENHARD IV J H, 2011. A heat transfer textbook[M]. 4th ed. Massachusetts: Phlogiston Press, 749. [51] LIU X C, XING H L, ZHANG D H, 2015. The mechanisms of the infill textures and its implications for the five-floor zonation at the Dajishan vein-type tungsten deposit, China[J]. Ore Geology Reviews, 65: 365-374. doi: 10.1016/j.oregeorev.2014.10.011 [52] LIU X C, ZHANG D H, ZHAO B, et al. , 2017. Quantitative analysis of the “five-floor” vertical morphological zonation in the Piaotang tungsten deposits, South China[J]. Geological Journal of China Universities, 23(3): 408-416. (in Chinese with English abstract) [53] LIU X C, XIAO C H, ZHANG S H, et al. , 2020. Whether Sanguliu granite provided energy required for forming Wulong gold deposit, Liaoning Province, China?[J]. Earth Science, 45(11): 3998-4013. (in Chinese with English abstract) [54] LIU X C, ZHANG D H, YANG J W, et al. , 2023. High heat producing granites and prolonged extraction of tungsten and tin from melts[J]. Geochimica et Cosmochimica Acta, 348: 340-354. doi: 10.1016/j.gca.2023.03.012 [55] LORD H W, SHULMAN Y, 1967. A generalized dynamical theory of thermoelasticity[J]. Journal of the Mechanics and Physics of Solids, 15(5): 299-309. doi: 10.1016/0022-5096(67)90024-5 [56] MA C Q, LI Y Q, 2017. Incremental growth of granitoid plutons and highly crystalline magmatic differentiation[J]. Acta Petrologica Sinica, 33(5): 1479-1488. (in Chinese with English abstract) [57] MAO J W, XIE G Q, CHENG Y B, et al. , 2009. Mineral deposit models of Mesozoic ore deposits in South China[J]. Geological Review, 55(3): 347-354. (in Chinese with English abstract) [58] MATZEL J E P, BOWRING S A, MILLER R B, 2006. Time scales of pluton construction at differing crustal levels: examples from the Mount Stuart and Tenpeak intrusions, North Cascades, Washington[J]. Geological Society of America Bulletin, 118(11-12): 1412-1430. doi: 10.1130/B25923.1 [59] MERRIMAN J D, WHITTINGTON A G, HOFMEISTER A M, et al. , 2013. Thermal transport properties of major Archean rock types to high temperature and implications for cratonic geotherms[J]. Precambrian Research, 233: 358-372. doi: 10.1016/j.precamres.2013.05.009 [60] MIAO S Q, LI H P, CHEN G, 2014. Temperature dependence of thermal diffusivity, specific heat capacity, and thermal conductivity for several types of rocks[J]. Journal of Thermal Analysis and Calorimetry, 115(2): 1057-1063. doi: 10.1007/s10973-013-3427-2 [61] MICHEL J, BAUMGARTNER L, PUTLITZ B, et al. , 2008. Incremental growth of the Patagonian Torres del Paine laccolith over 90 k. y. [J]. Geology, 36(6): 459-462. doi: 10.1130/G24546A.1 [62] MÜLLER G, 1998. Experimental simulation of basalt columns[J]. Journal of Volcanology and Geothermal Research, 86(1-4): 93-96. doi: 10.1016/S0377-0273(98)00045-6 [63] NABELEK P I, HOFMEOSTER A M, WHITTINGTON A G, 2012. The influence of temperature-dependent thermal diffusivity on the conductive cooling rates of plutons and temperature-time paths in contact aureoles[J]. Earth and Planetary Science Letters, 317-318: 157-164. doi: 10.1016/j.jpgl.2011.11.009 [64] NAJAFI M, JALALI S M E, KHALOKAKAIE R, 2014. Thermal–mechanical–numerical analysis of stress distribution in the vicinity of underground coal gasification (UCG) panels[J]. International Journal of Coal Geology, 134-135: 1-16. doi: 10.1016/j.coal.2014.09.014 [65] PETFORD N, CRUDEN A R, MCCAFFREY K J W, et al. , 2000. Granite magma formation, transport and emplacement in the Earth's crust[J]. Nature, 408(6813): 669-673. doi: 10.1038/35047000 [66] POLYAKOVA I G, 2014. The main silica phases and some of their properties[M]//SCHMELZER J W P. Glass: selected properties and crystallization. Berlin: De Gruyter: 197-268. [67] QIN K Z, ZHAO J X, FAN H R, et al. , 2021. On the ore-forming depth and possible maximum vertical extension of the major type ore deposits[J]. Earth Science Frontiers, 28(3): 271-294. (in Chinese with English abstract) [68] RAGHAMI E, SCHRANK C, KRUHL J H, 2020. 3D modelling of the effect of thermal-elastic stress on grain-boundary opening in quartz grain aggregates[J]. Tectonophysics, 774: 228242. doi: 10.1016/j.tecto.2019.228242 [69] SCAILLET B, PICHAVANT M, ROUX J, 1995. Experimental crystallization of leucogranite magmas[J]. Journal of Petrology, 36(3): 663-705. doi: 10.1093/petrology/36.3.663 [70] SCAILLET B, HOLTZ F, PICHAVANT M, 2016. Experimental constraints on the formation of silicic magmas[J]. Elements, 12(2): 109-114. doi: 10.2113/gselements.12.2.109 [71] SCHÖN J H, 2015. Physical properties of rocks: fundamentals and principles of petrophysics[M]. Amsterdam: Elsevier. [72] SCHÖPA A, ANNEN C, DILLES J H, et al. , 2017. Magma emplacement rates and porphyry copper deposits: thermal modeling of the Yerington Batholith, Nevada[J]. Economic Geology, 112(7): 1653-1672. doi: 10.5382/econgeo.2017.4525 [73] SCHRANK C E, FUSSEIS F, KARRECH A, et al. , 2012. Thermal-elastic stresses and the criticality of the continental crust[J]. Geochemistry, Geophysics, Geosystems, 13(9): Q09005. [74] SONG Z X, QIAN X L, 1996. On the formation mechanism of granite: a review[J]. Geological Science and Technology Information, 15(3): 20-26. (in Chinese with English abstract) [75] STEIN C A, STEIN S, 1992. A model for the global variation in oceanic depth and heat flow with lithospheric age[J]. Nature, 359(6391): 123-129. doi: 10.1038/359123a0 [76] TOSDAL R M, RICHARDS J P, 2001. Magmatic and structural controls on the development of porphyry Cu ± Mo ± Au deposits[M]//RICHARDS J P, TOSDAL R M. Structural controls on ore genesis. Society of Economic Geologists, 14: 157-181. [77] VOSTEEN H D, SCHELLSCHMIDT R, 2003. Influence of temperature on thermal conductivity, thermal capacity and thermal diffusivity for different types of rock[J]. Physics and Chemistry of the Earth, Parts A/B/C, 28(9-11): 499-509. doi: 10.1016/S1474-7065(03)00069-X [78] WANG D H, TANG J X, YING L J, et al. , 2010. Application of “Five levels + Basement” model for prospecting deposits into depth[J]. Journal of Jilin University (Earth Science Edition), 40(4): 733-738. (in Chinese with English abstract) [79] WANG D H, HUANG F, WANG Y, et al. , 2020a. Regional metallogeny of Tungsten-tin-polymetallic deposits in Nanling region, South China[J]. Ore Geology Reviews, 120: 103305. doi: 10.1016/j.oregeorev.2019.103305 [80] WANG F, KONIETZKY H, 2019. Thermo-mechanical properties of granite at elevated temperatures and numerical simulation of thermal cracking[J]. Rock Mechanics and Rock Engineering, 52(10): 3737-3755. doi: 10.1007/s00603-019-01837-1 [81] WANG F, KONIETZKY H, FRÜHWIRT T, et al. , 2020b. Laboratory testing and numerical simulation of properties and thermal-induced cracking of Eibenstock granite at elevated temperatures[J]. Acta Geotechnica, 15(8): 2259-2275. doi: 10.1007/s11440-020-00926-8 [82] WANG X N, HUANG R Q, 1998. Influence of thermal stress on the surface stability of surrounding rock in a diversion tunnel[J]. Journal of Geological Hazards and Environment Preservation, 9(1): 43-48. (in Chinese with English abstract) [83] WEI X Y, LI Z H, DU P F, et al. , 2022. Application of numerical modeling in the study of fluid flow mechanism related to sandstone-type uranium deposits[J]. Uranium Geology, 38(1): 106-114. (in Chinese with English abstract) [84] WEIS P, DRIESNER T, HEINRICH C A, 2012. Porphyry-copper ore shells form at stable pressure-temperature fronts within dynamic fluid plumes[J]. Science, 338(6114): 1613-1616. doi: 10.1126/science.1225009 [85] XING H L, MAKINOUCHI A, 2002. Three-dimensional finite element modeling of thermomechanical frictional contact between finite deformation bodies using R-minimum strategy[J]. Computer Methods in Applied Mechanics and Engineering, 191(37-38): 4193-4214. doi: 10.1016/S0045-7825(02)00372-9 [86] XU J X, ZENG Z L, WANG D H, et al. , 2008. A new type of tungsten deposit in southern Jiangxi and the new model of "Five Floors + Basement" for prospecting[J]. Acta Geologica Sinica, 82(7): 880-887. (in Chinese with English abstract) [87] ŽÁK J, VYHNÁLEK B, KABELE P, 2006. Is there a relationship between magmatic fabrics and brittle fractures in plutons? A view based on structural analysis, anisotropy of magnetic susceptibility and thermo-mechanical modelling of the Tanvald pluton (Bohemian Massif) [J]. Physics of the Earth and Planetary Interiors, 157(3-4): 286-310. doi: 10.1016/j.pepi.2006.05.001 [88] ZHANG D, LI F, HE J L, et al. , 2021. Mesozoic tectonic deformation and its rock / ore-control mechanism in the important metallogenic belts in South China [J]. Journal of Geomechanics, 27(4): 497-528. (in Chinese with English abstract) [89] ZHANG D H, JIN X D, MAO S D, et al. , 2011. The classification of ore-forming fluid and the efficiency of ore formation of magmatic hydrothermal solution[J]. Earth Science Frontiers, 18(5): 90-102. (in Chinese with English abstract) [90] ZHANG Q, JIN W J, LI C D, et al. , 2014. Magma-thermal field: its basic characteristics, and differences with geothermal field[J]. Acta Petrologica Sinica, 30(2): 341-349. (in Chinese with English abstract) [91] ZHANG S K, YU X F, JIA C, et al. , 2018. Effect study on thermal stress to weathering damage of dinosaur fossils[J]. Shandong Land and Resources, 34(5): 42-48. (in Chinese with English abstract) [92] ZHANG S S, 2011. Numerical simulation of magmatic hydrothermal system: a case study of Gejiu polymetallic mining district[D]. Wuhan: China University of Geosciences (Wuhan): 1-54. (in Chinese with English abstract) [93] ZHAO M C, YU X C, ZHANG Y F, et al. , 2020. Conceptual model for genesis of mineralized fissures in porphyry deposits and its geological significance[J]. Mineral Deposits, 39(1): 19-41. (in Chinese with English abstract) [94] ZHU Z N, YANG S Q, WANG R, et al. , 2022. Effects of high temperature on the linear thermal expansion coefficient of Nanan granite[J]. Acta Geodaetica et Geophysica, 57(2): 231-243. doi: 10.1007/s40328-022-00375-7 [95] 曹华文, 2015. 滇西腾-梁锡矿带中-新生代岩浆岩演化与成矿关系研究[D]. 北京: 中国地质大学(北京): 1-340. [96] 岑况, 田兆雪, 2012. 岩浆中心成矿系: 岩浆岩体和矿床组合的空间分带理想模式[J]. 现代地质, 26(5): 1051-1057. doi: 10.3969/j.issn.1000-8527.2012.05.026 [97] 常成, 罗纲, 2022. 斑岩矿床侵入体顶部破裂系统形成的力学机制: 多场耦合数值模拟的启示[J]. 地球物理学报, 65(8): 3006-3024. doi: 10.6038/cjg2022P0375 [98] 陈柏林, 高允, 2022. 江西德兴铜厂斑岩铜矿床细脉型矿体含矿裂隙系统研究[J]. 矿床地质, 41(6): 1093-1107. [99] 陈颙, 吴晓东, 张福勤, 1999. 岩石热开裂的实验研究[J]. 科学通报, 44(8): 880-883. doi: 10.3321/j.issn:0023-074X.1999.08.022 [100] 陈育民, 徐鼎平, 2013. FLAC/FLAC 3D基础与工程实例[M]. 2版. 北京: 中国水利水电出版社. [101] 范玉璐, 曹佳文, 余顺, 等, 2023. 高地应力作用下渭武高速木寨岭隧道围岩大变形灾变预测分析研究[J]. 地质力学学报, 29(6): 786-800. doi: 10.12090/j.issn.1006-6616.2022110 [102] 方贵聪, 王登红, 冯佐海, 等, 2021. 华南石英脉型钨矿床扇状成矿的规律及其找矿意义[J]. 大地构造与成矿学, 45(3): 523-533. [103] 古德生, 李夕兵, 2003. 有色金属深井采矿研究现状与科学前沿[J]. 矿业研究与开发, 23(S1): 1-5. [104] 广东有色金属地质勘探公司九三二队, 1966. 我们是怎样用“五层楼”规律寻找、评价和勘探黑钨石英脉矿床的[J]. 地质与勘探(5): 15-19. [105] 韩学辉, 楚泽涵, 张元中, 2005. 岩石热开裂及其在工程学上的意义[J]. 石油实验地质, 27(1): 98-100. doi: 10.3969/j.issn.1001-6112.2005.01.018 [106] 李维特, 黄保海, 毕仲波, 2004. 热应力理论分析及应用[M]. 北京: 中国电力出版社. [107] 刘向冲, 张德会, 赵波, 等, 2017. 漂塘钨矿床“五层楼”垂直形态分带定量分析[J]. 高校地质学报, 23(3): 408-416. [108] 刘向冲, 肖昌浩, 张拴宏, 等, 2020. 辽东三股流岩体是否为五龙金矿成矿提供必要的能量?[J]. 地球科学, 45(11): 3998-4013. [109] 马昌前, 李艳青, 2017. 花岗岩体的累积生长与高结晶度岩浆的分异[J]. 岩石学报, 33(5): 1479-1488. [110] 毛景文, 谢桂青, 程彦博, 等, 2009. 华南地区中生代主要金属矿床模型[J]. 地质论评, 55(3): 347-354. doi: 10.3321/j.issn:0371-5736.2009.03.005 [111] 秦克章, 赵俊兴, 范宏瑞, 等, 2021. 试论主要类型矿床的形成深度与最大延深垂幅[J]. 地学前缘, 28(3): 271-294. [112] 宋子新, 钱祥麟, 1996. 花岗岩成因机制研究综述[J]. 地质科技情报, 15(3): 20-26. [113] 王登红, 唐菊兴, 应立娟, 等, 2010. “五层楼+地下室”找矿模型的适用性及其对深部找矿的意义[J]. 吉林大学学报(地球科学版), 40(4): 733-738. [114] 王贤能, 黄润秋, 1998. 引水隧洞工程中热应力对围岩表层稳定性的影响分析[J]. 地质灾害与环境保护, 9(1): 43-48. [115] 韦晓艳, 李增华, 杜鹏飞, 等, 2022. 数值模拟在砂岩型铀矿流体运移机制研究中的应用[J]. 铀矿地质, 38(1): 106-114. doi: 10.3969/j.issn.1000-0658.2022.38.009 [116] 许建祥, 曾载淋, 王登红, 等, 2008. 赣南钨矿新类型及“五层楼+地下室”找矿模型[J]. 地质学报, 82(7): 880-887. doi: 10.3321/j.issn:0001-5717.2008.07.003 [117] 张达, 李芳, 贺晓龙, 等, 2021. 华南重要成矿区带中生代构造变形及其控岩控矿机理[J]. 地质力学学报, 27(04): 497-528. [118] 张德会, 金旭东, 毛世德, 等, 2011. 成矿热液分类兼论岩浆热液的成矿效率[J]. 地学前缘, 18(5): 90-102. [119] 张旗, 金惟俊, 李承东, 等, 2014. 岩浆热场: 它的基本特征及其与地热场的区别[J]. 岩石学报, 30(2): 341-349. [120] 张尚坤, 于学峰, 贾超, 等, 2018. 热应力对恐龙化石风化损坏的影响研究[J]. 山东国土资源, 34(5): 42-48. doi: 10.3969/j.issn.1672-6979.2018.05.005 [121] 张嵩松, 2011. 岩浆热液成矿系统的数值模拟: 以云南个旧锡多金属矿区为例[D]. 武汉: 中国地质大学(武汉): 1-54. [122] 赵茂春, 余先川, 张翼飞, 等, 2020. 斑岩型矿床容矿裂隙成因的几种概念模型及其意义[J]. 矿床地质, 39(1): 19-41. -

 下载:
下载:


计量
- 文章访问数: 1921
- HTML全文浏览量: 444
- PDF下载量: 140
- 被引次数: 0
