

Differences in crustal stress direction in the southern section of the Huayingshan fault zone in Sichuan Basin: Insights from in situ borehole image logging
-
摘要: 华蓥山断裂带作为四川盆地内规模最大的断裂带,两侧地质构造存在较大差异,历史上该断裂带上频发5级左右地震,现今仍具一定活动性,扰动着盆地的地应力场。明确华蓥山断裂带的地壳应力状态可以提高对该地区活动变形、构造活动以及地震活动性的认识,并对后续华蓥山断裂带研究提供参考依据。在收集整理华蓥山断裂带南段8处钻孔测井成像(钻孔崩落与钻孔诱发张裂缝)数据基础上,结合中国现代地应力场和四川盆地东南缘的地震震源机制解数据对其地应力特征进行了综合分析。研究结果表明:华蓥山断裂带南段南部地区大多数钻孔的最大水平主应力为北西西—南东东向,与四川盆地区域应力场方向一致,仅1处钻孔的最大水平主应力呈北东东—南西西向;在南段中部地区钻孔的最大水平主应力均为北东东—南西西向,对比四川盆地区域应力场呈逆时针偏转。应力方向发生偏转主要是由华蓥山断裂带基底性质变化、构造应力和区域应力场的综合作用造成的。Abstract:
Objective The Huayingshan fault zone, the largest fault zone within Sichuan Basin, exhibits notable differences in geological structures on both sides. Historically, earthquakes with a magnitude of ≤5 have occurred frequently along this fault zone, which remains relatively active to this day, disturbing the crustal stress field of the basin. Clarifying the crustal stress state of the Huayingshan fault zone can enhance our understanding of its active deformation and its tectonic and seismic activities and serve as a reference for subsequent research regarding this fault zone. Currently, geostress studies in this area rely mainly on analyzing seismic data, whereas the investigation of borehole data remains relatively scarce. Methods We collected and collated imaging data regarding borehole collapse and borehole-induced tensile fractures from eight borehole logging sites in the southern segment of the Huayingshan fault zone; the geostress directions of these eight boreholes were determined by analyzing these data. Subsequently, a comprehensive analysis of the geostress characteristics was performed by combining the data regarding China’s modern stress field and the earthquake focal mechanism solutions in the southeastern margin of Sichuan Basin. Results The maximum horizontal principal stress in four boreholes located in the southern region of the southern segment of the Huayingshan fault zone was oriented in the NWW-SEE direction, which aligns with the regional stress field direction in Sichuan Basin; only one borehole in the southern region exhibited a maximum horizontal principal stress in the NEE—SWW direction, representing a counterclockwise deviation relative to the regional stress field of Sichuan Basin. Meanwhile, the maximum horizontal principal stress in all three boreholes in the central region of the southern segment of the Huayingshan fault zone was also oriented in the NEE—SWW direction, representing a counterclockwise deviation relative to the regional stress field of Sichuan Basin. Conclusion Through the comprehensive analysis of the above results and the tectonic features and basement properties of the study area, the following conclusions are drawn: (1) The deviations in stress direction in the southern segment of the fault zone are primarily caused by the combined effects of changes in the basement properties of the region, tectonic stress near the boreholes, and the regional stress field. (2) The geostress characteristics obtained in the present study, along with the focal mechanism solutions of earthquakes in the southern segment of the Huayingshan fault zone, indicate that the stress direction in the southeastern margin of Sichuan Basin is relatively divergent, resulting from the combined effects of complex local structures and the regional stress field in this region. Significance The present study aims to supplement the geostress data regarding the southern segment of the Huayingshan fault zone based on borehole data, analyze the current stress field state of the rock mass, and determine the direction of the maximum horizontal principal stress. These findings will provide supporting geostress data for subsequent research on the frequent seismic activities in this region. -
Key words:
- borehole image logs /
- in situ stress field /
- Huayingshan fault zone /
- Sichuan Basin
-

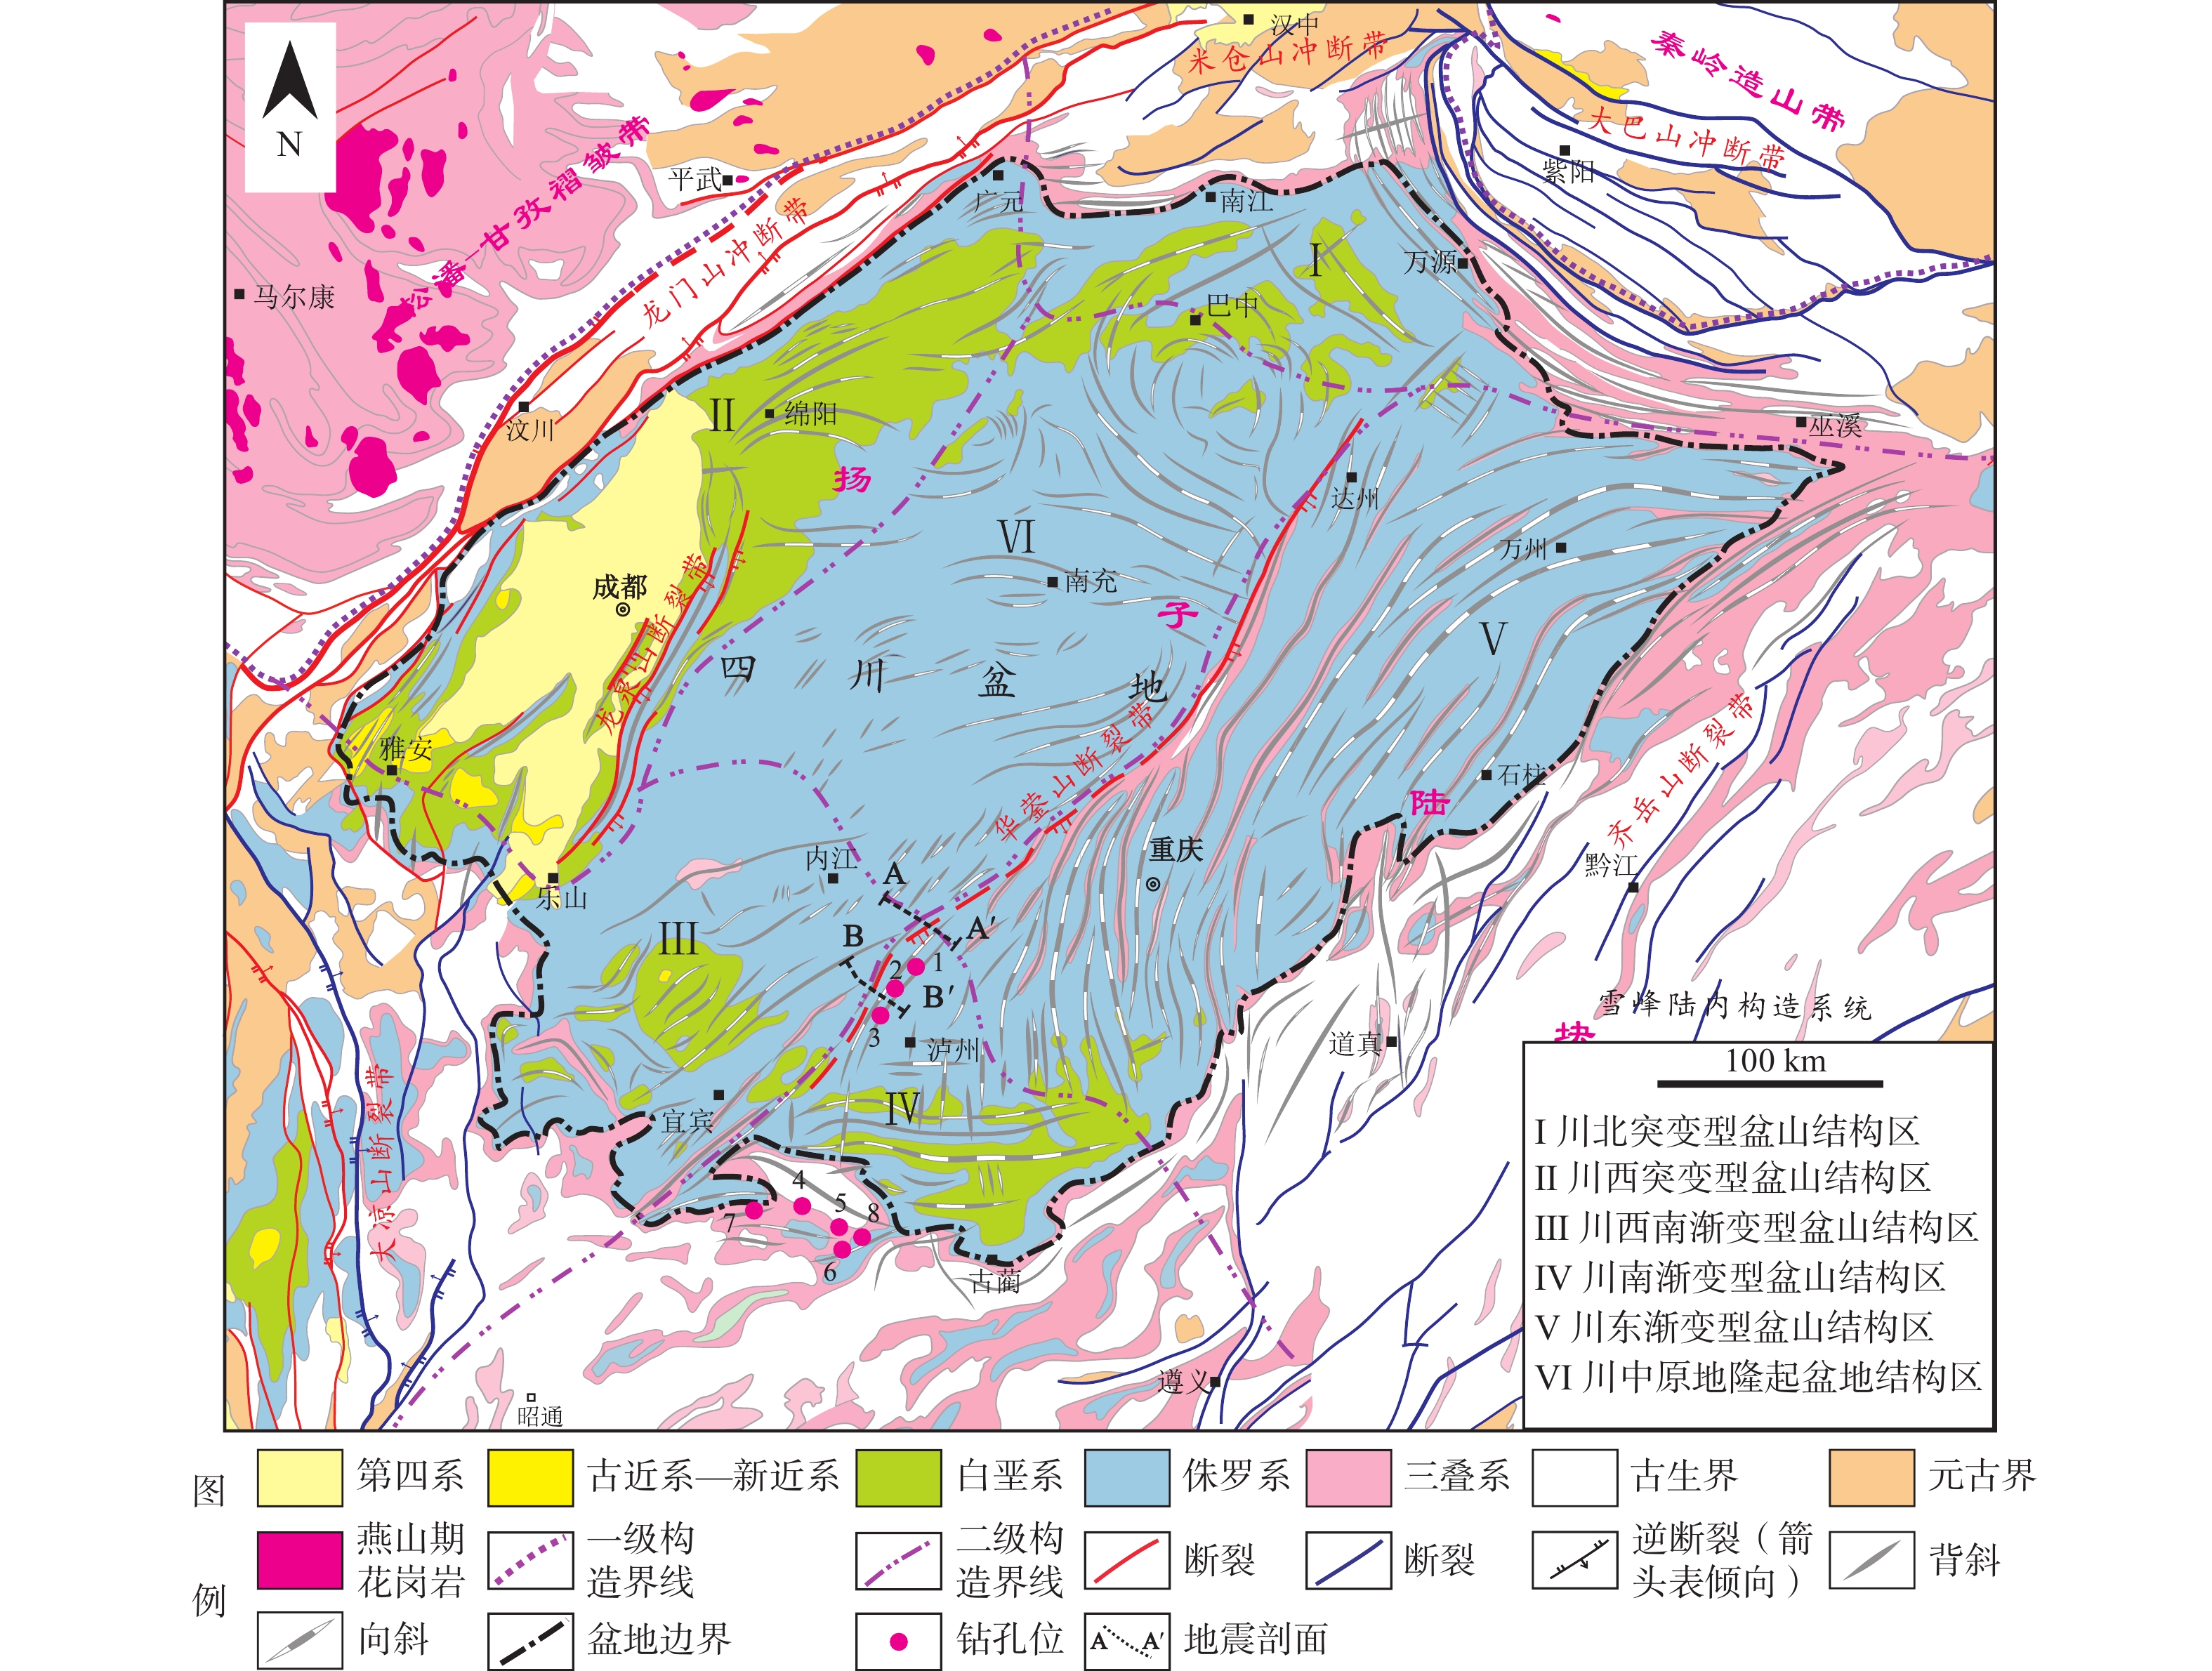
图 1 四川盆地及周缘地质构造与钻孔分布图
红色断裂表示晚更新世—全新世(距今10万~12万年)以来的活动断裂;蓝色表示第四纪活动过但晚更新世以来活动情况不清楚的断裂;1—钻孔L203H57-3;2—钻孔L203H79-4;3—钻孔L206;4—钻孔N203;5—钻孔N213;6—钻孔N215;7—钻孔N217;8—钻孔N224;下图同
Figure 1. Tectonics and borehole distribution in Sichuan Basin and its environs
The red color indicates active faults since the Late Pleistocene-Holocene (100,000 to 120,000 years ago); the blue color indicates faults that have been active in the Quaternary period but have not been well understood since the Late Pleistocene. 1—Borehole L203H57-3; 2—Borehole L203H79-4; 3—Borehole L206; 4—Borehole N205; 5—Borehole N213; 6—Borehole N215; 7—Borehole N217; 8—Borehole N224.
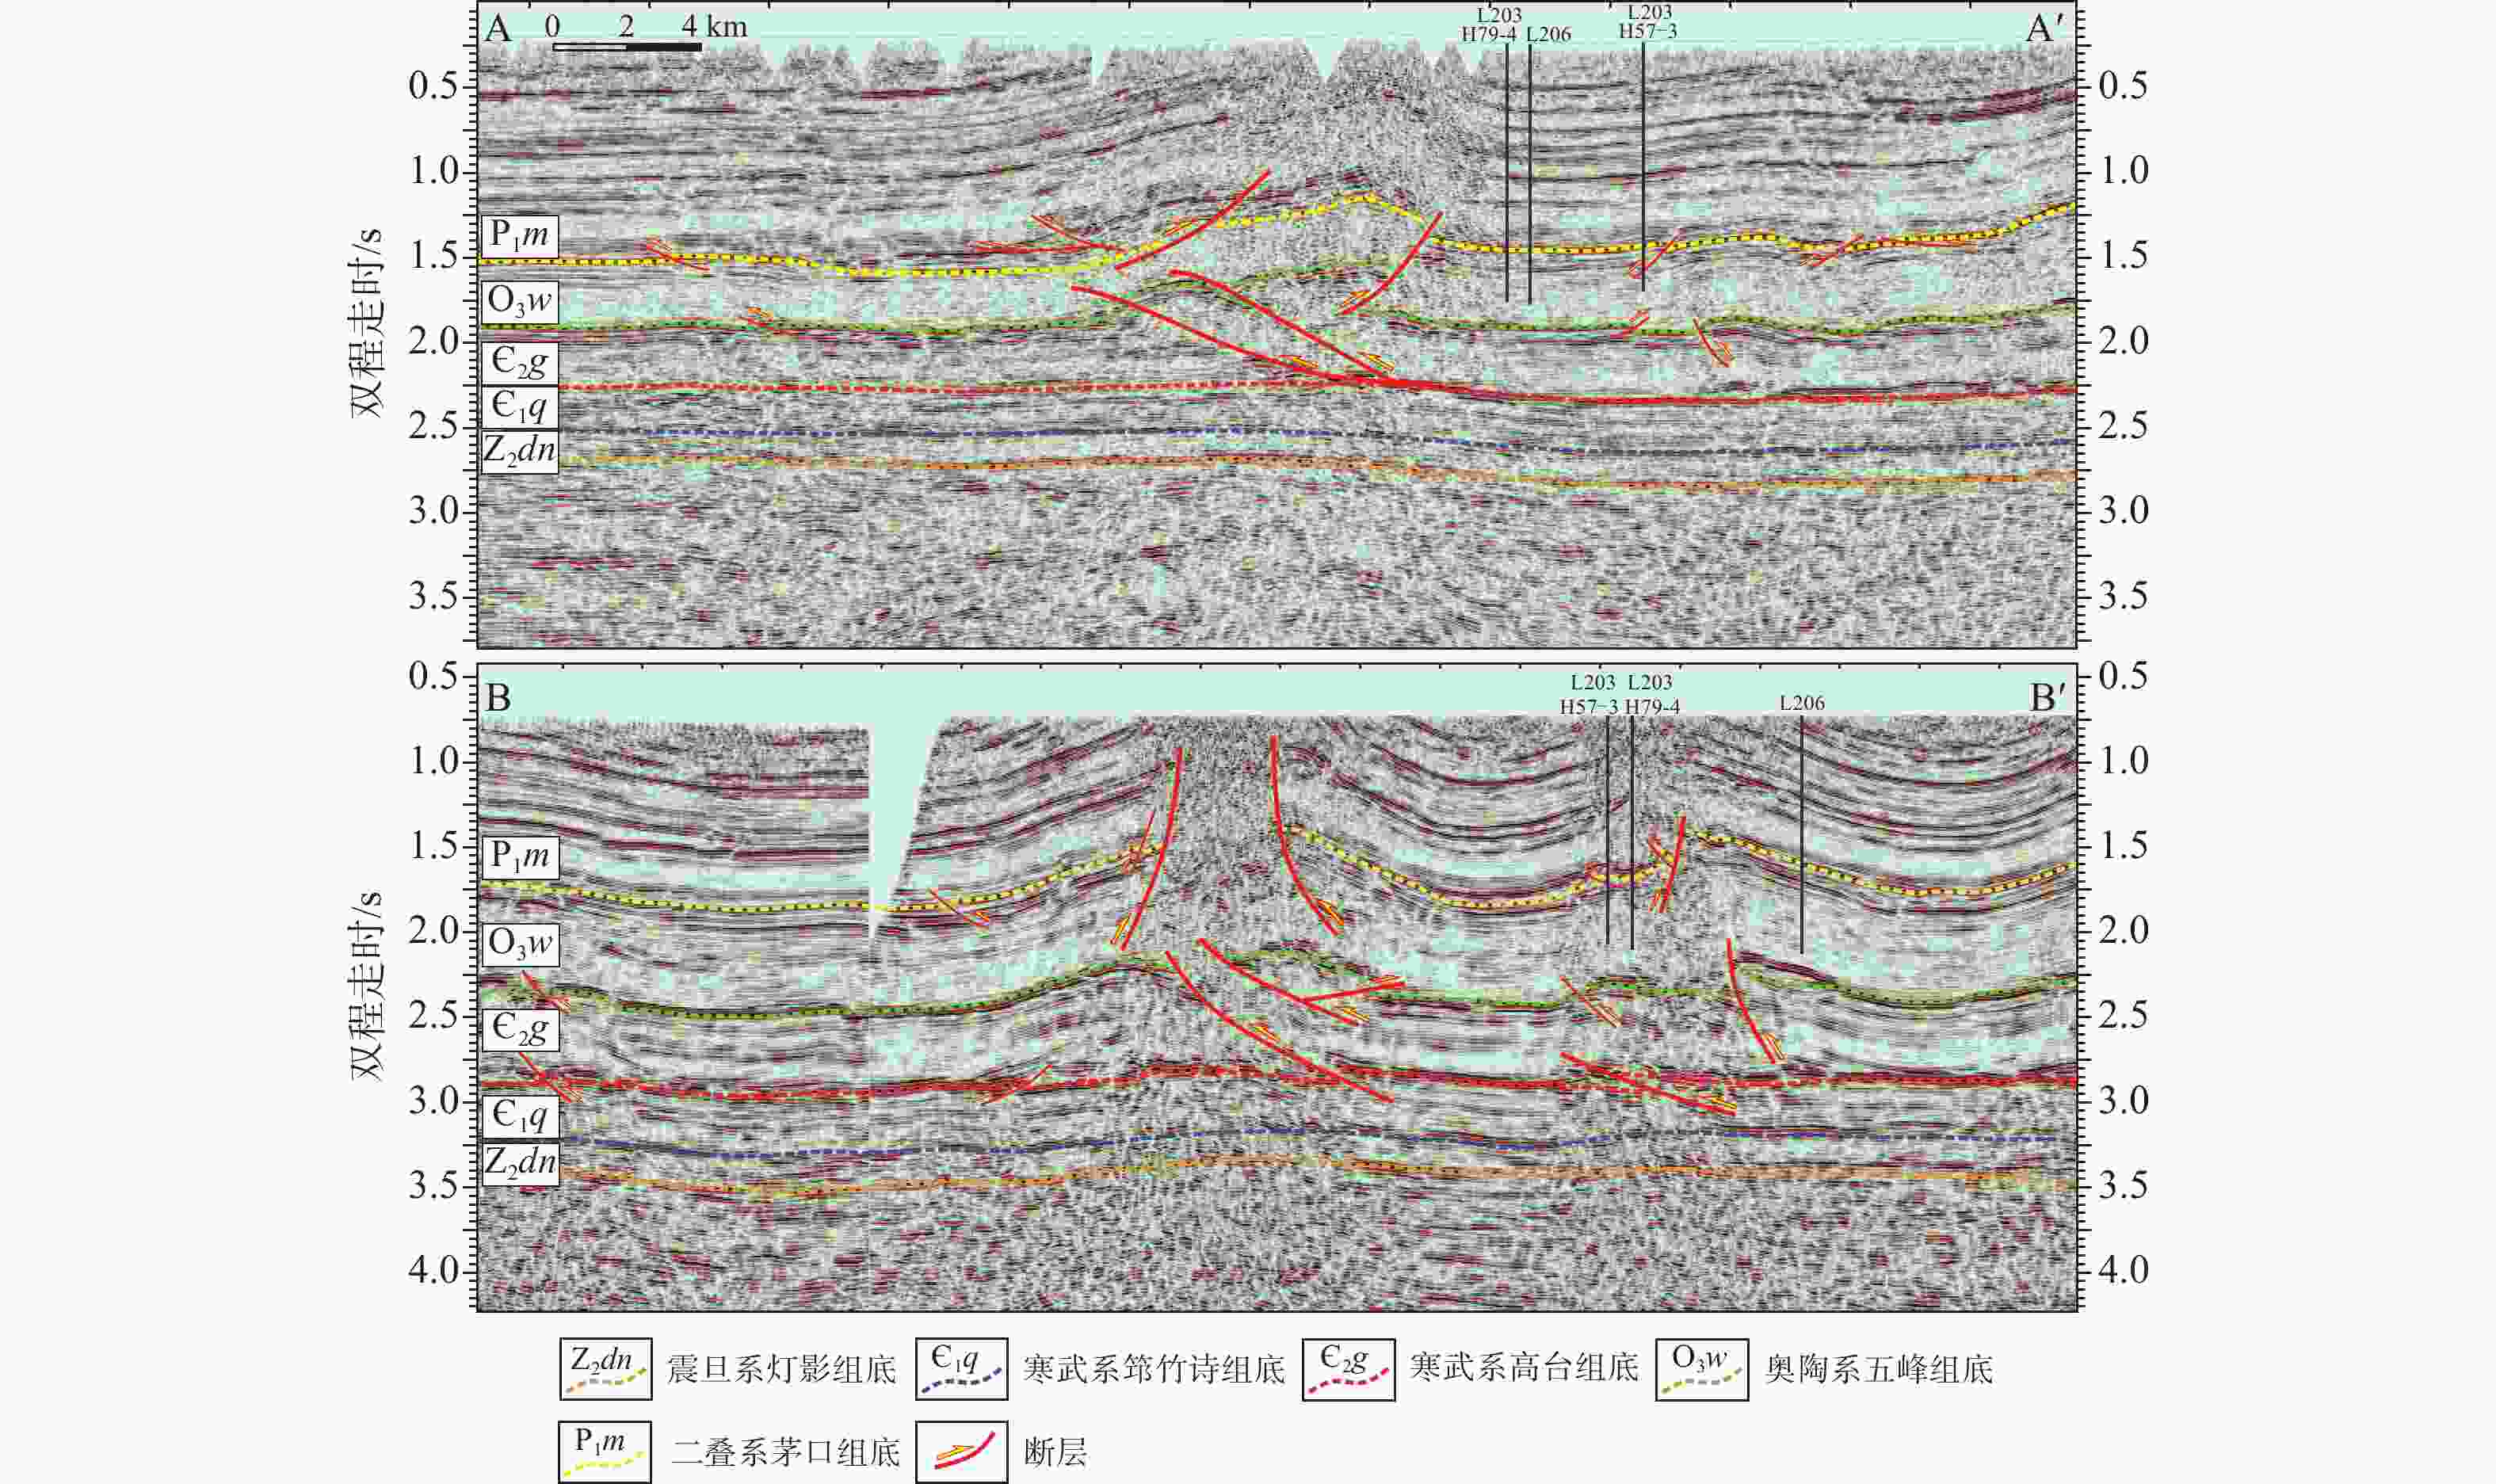
图 2 华蓥山断裂带南段AA′、BB′地震解释剖面(剖面位置见图1)
Figure 2. AA′, BB′ Seismic interpretation profile of the southern section of the Huayingshan fault zone (The position of the measuring line is shown in Fig. 1)
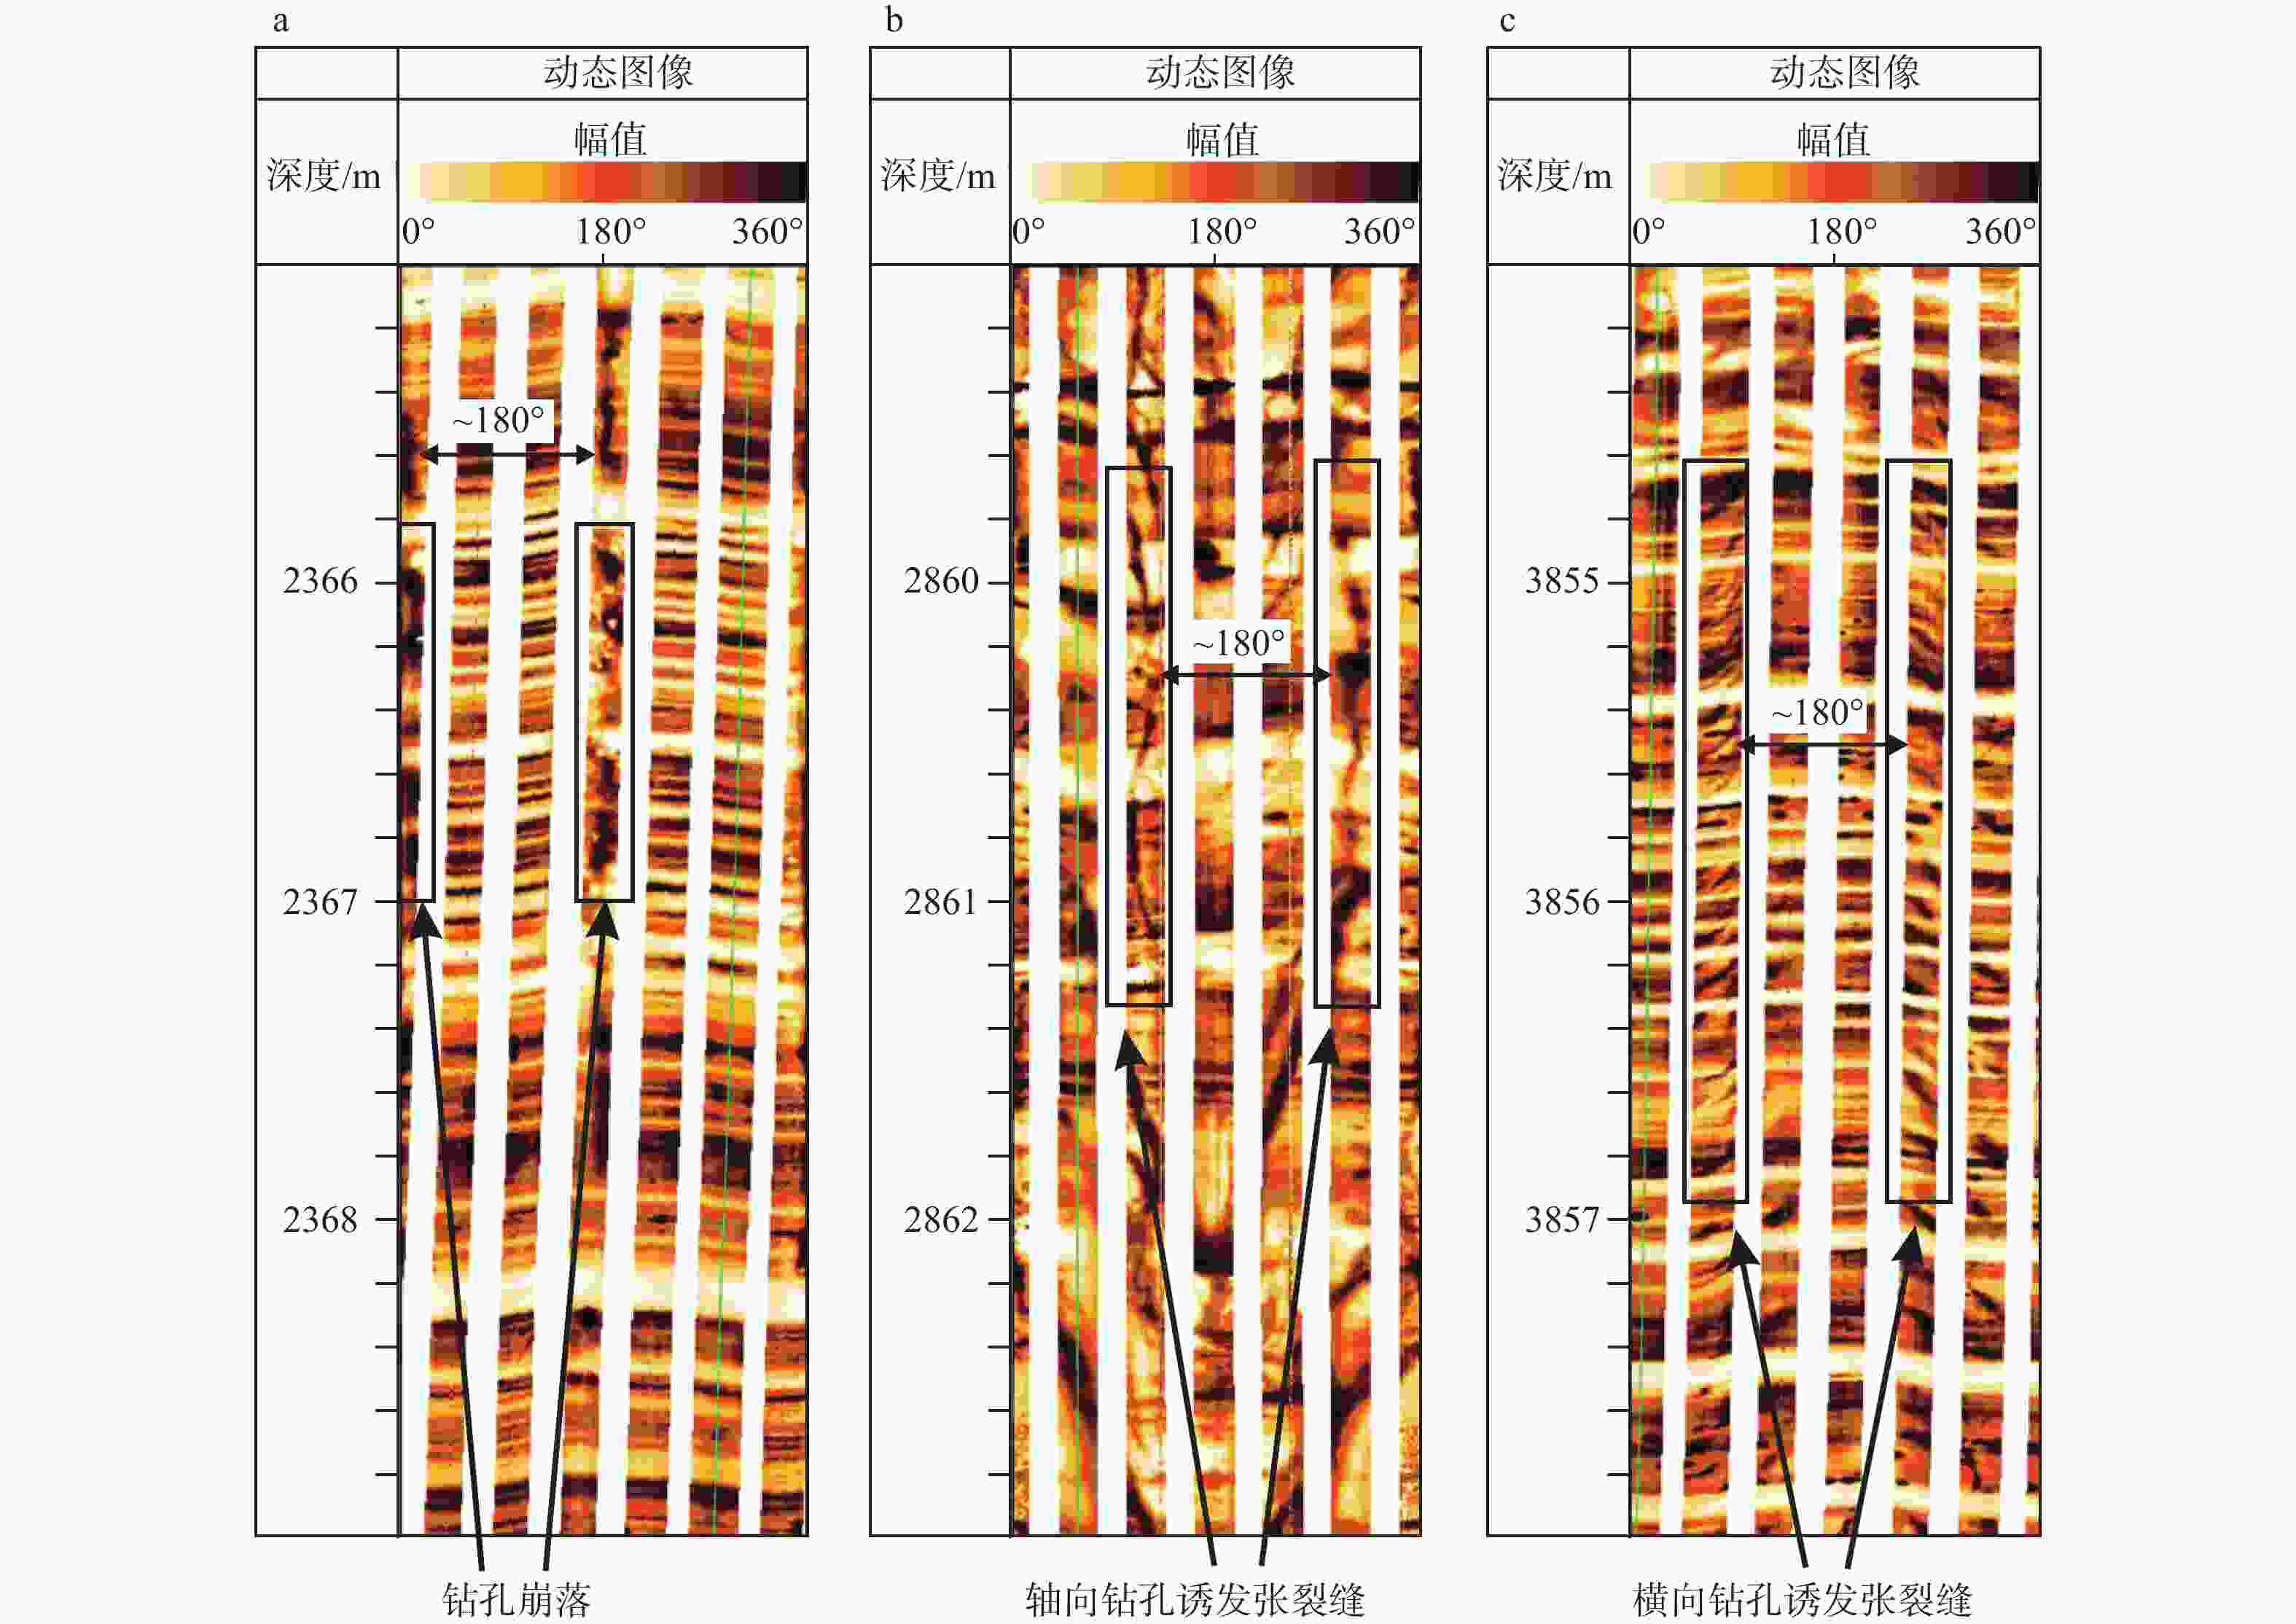
图 3 动态电阻率成像测井图
a—钻孔崩落;b—轴向(垂直)钻孔诱发张裂缝;c—横向钻孔诱发张裂缝
Figure 3. Dynamic resistivity imaging logging
(a) Borehole breakouts; (b) Axial (vertical) drilling-induced tensile fractures; (c) Transverse drilling-induced tensile fractures
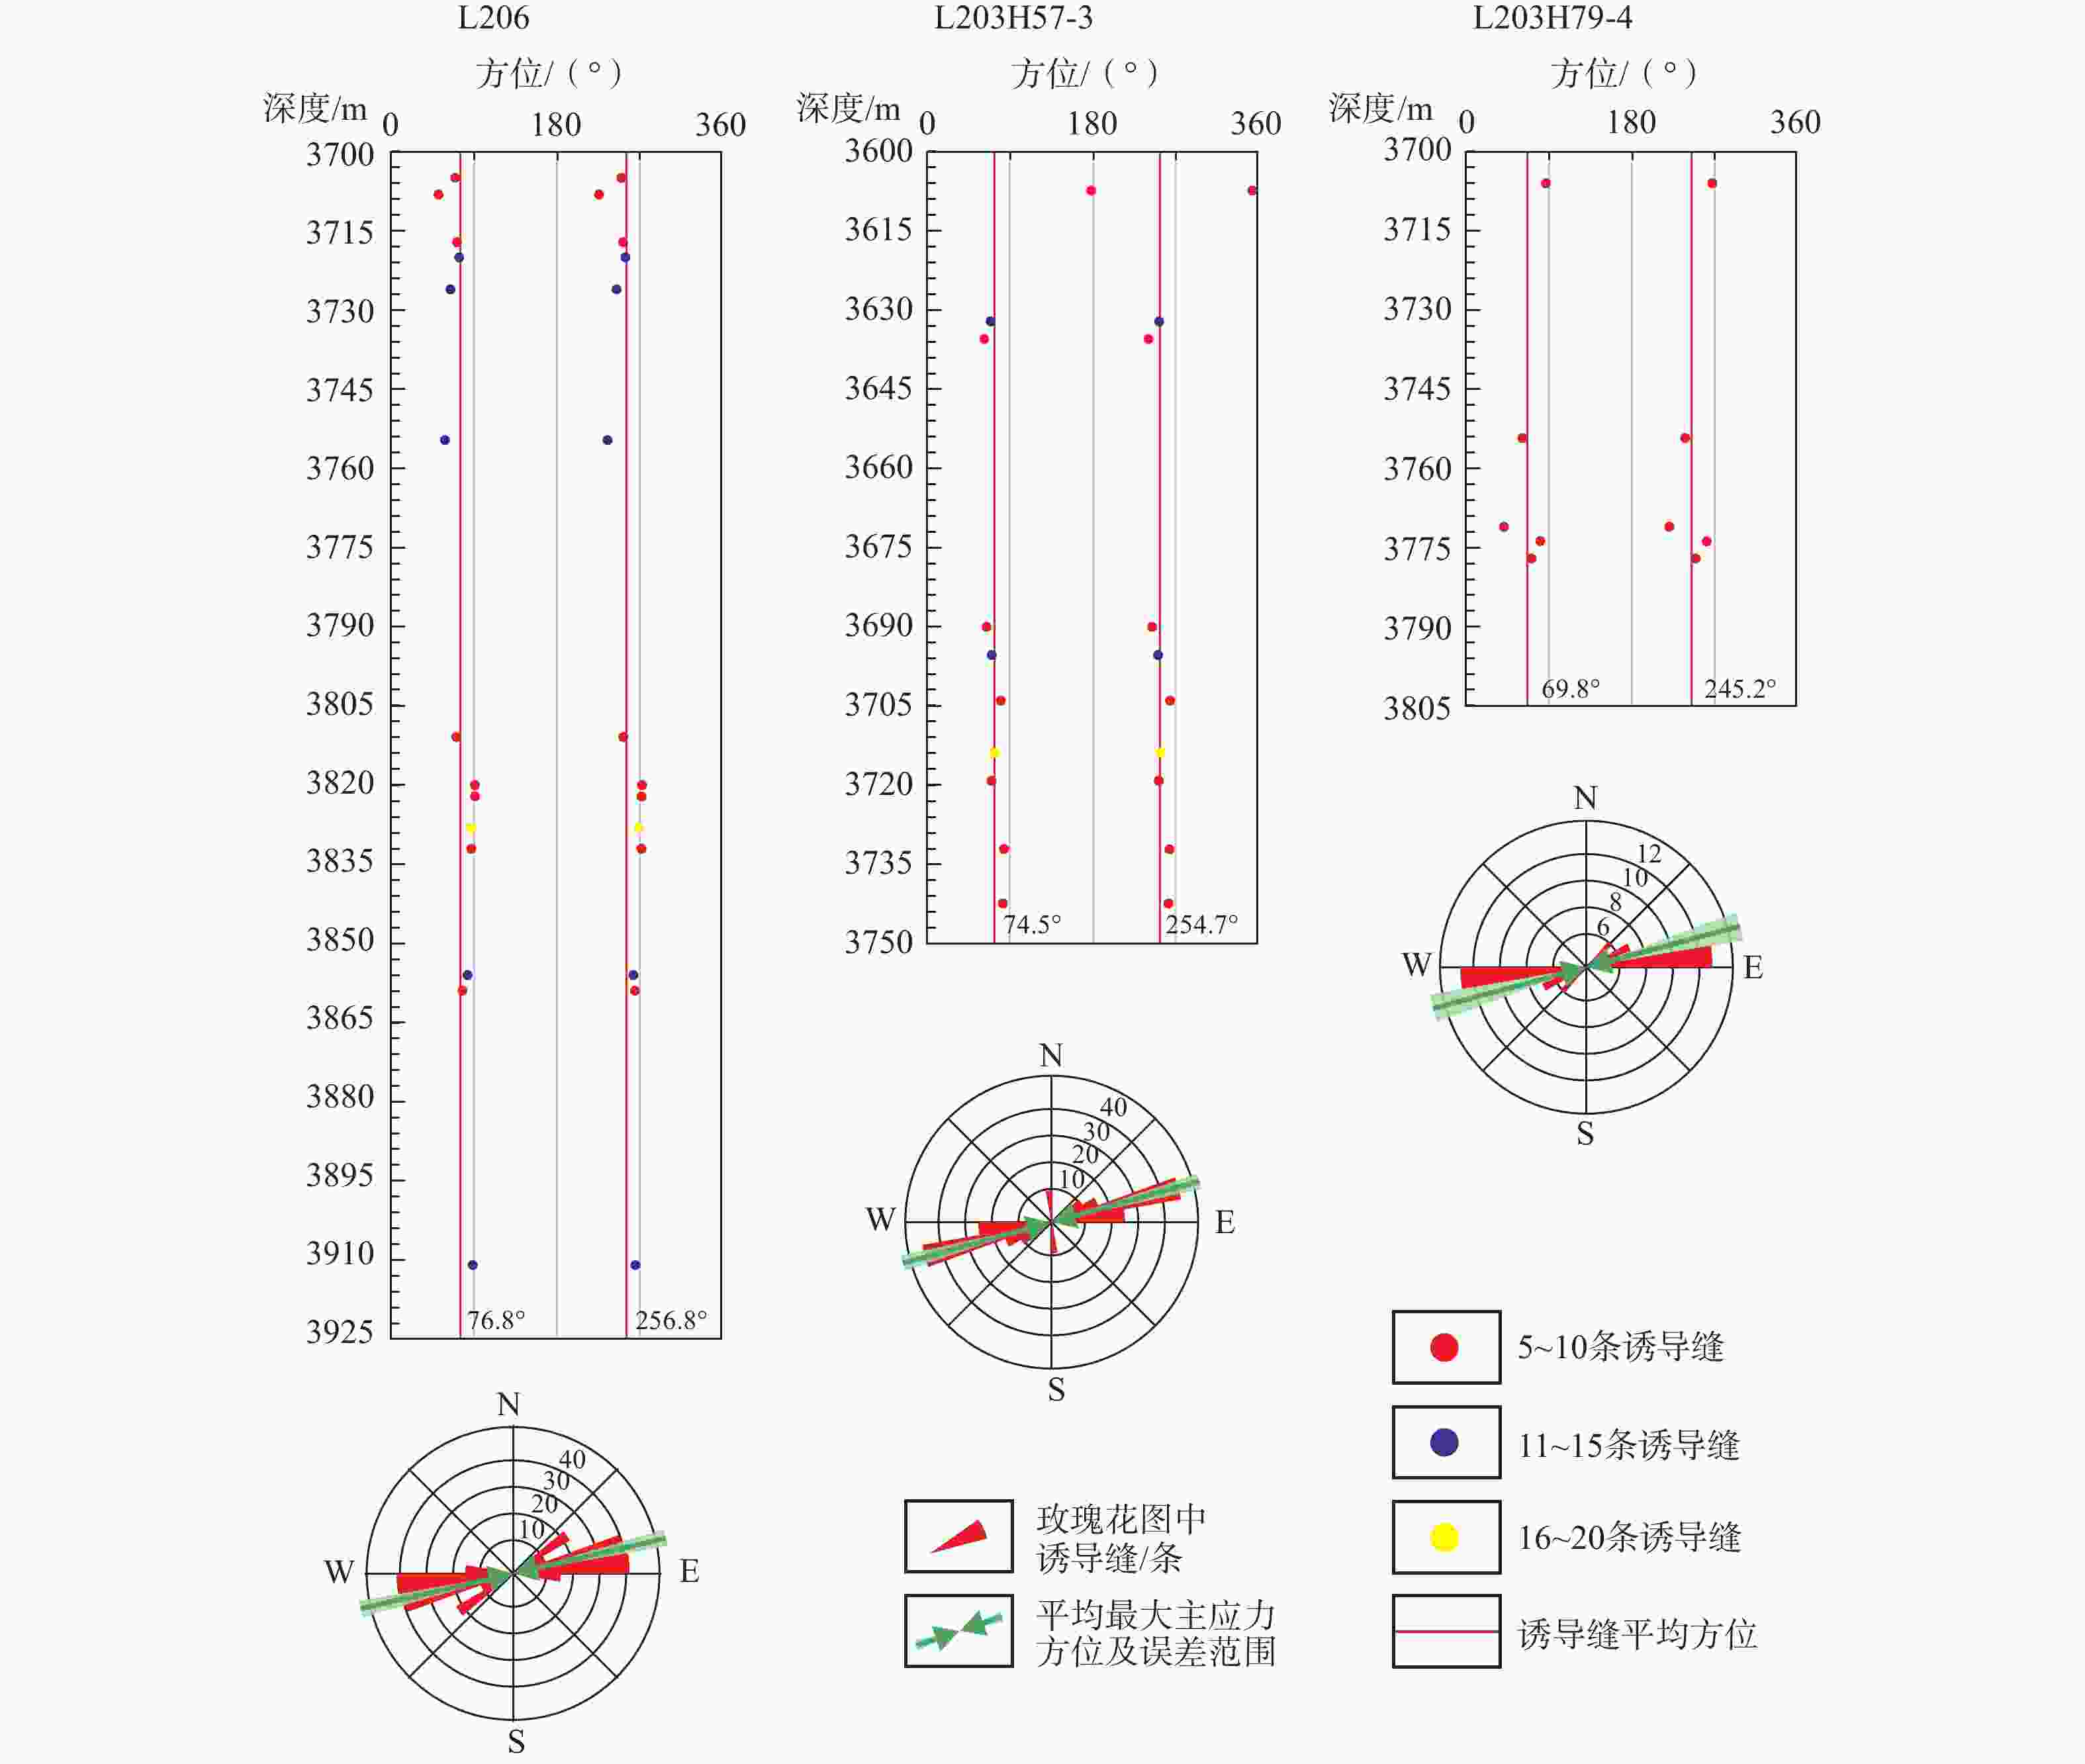
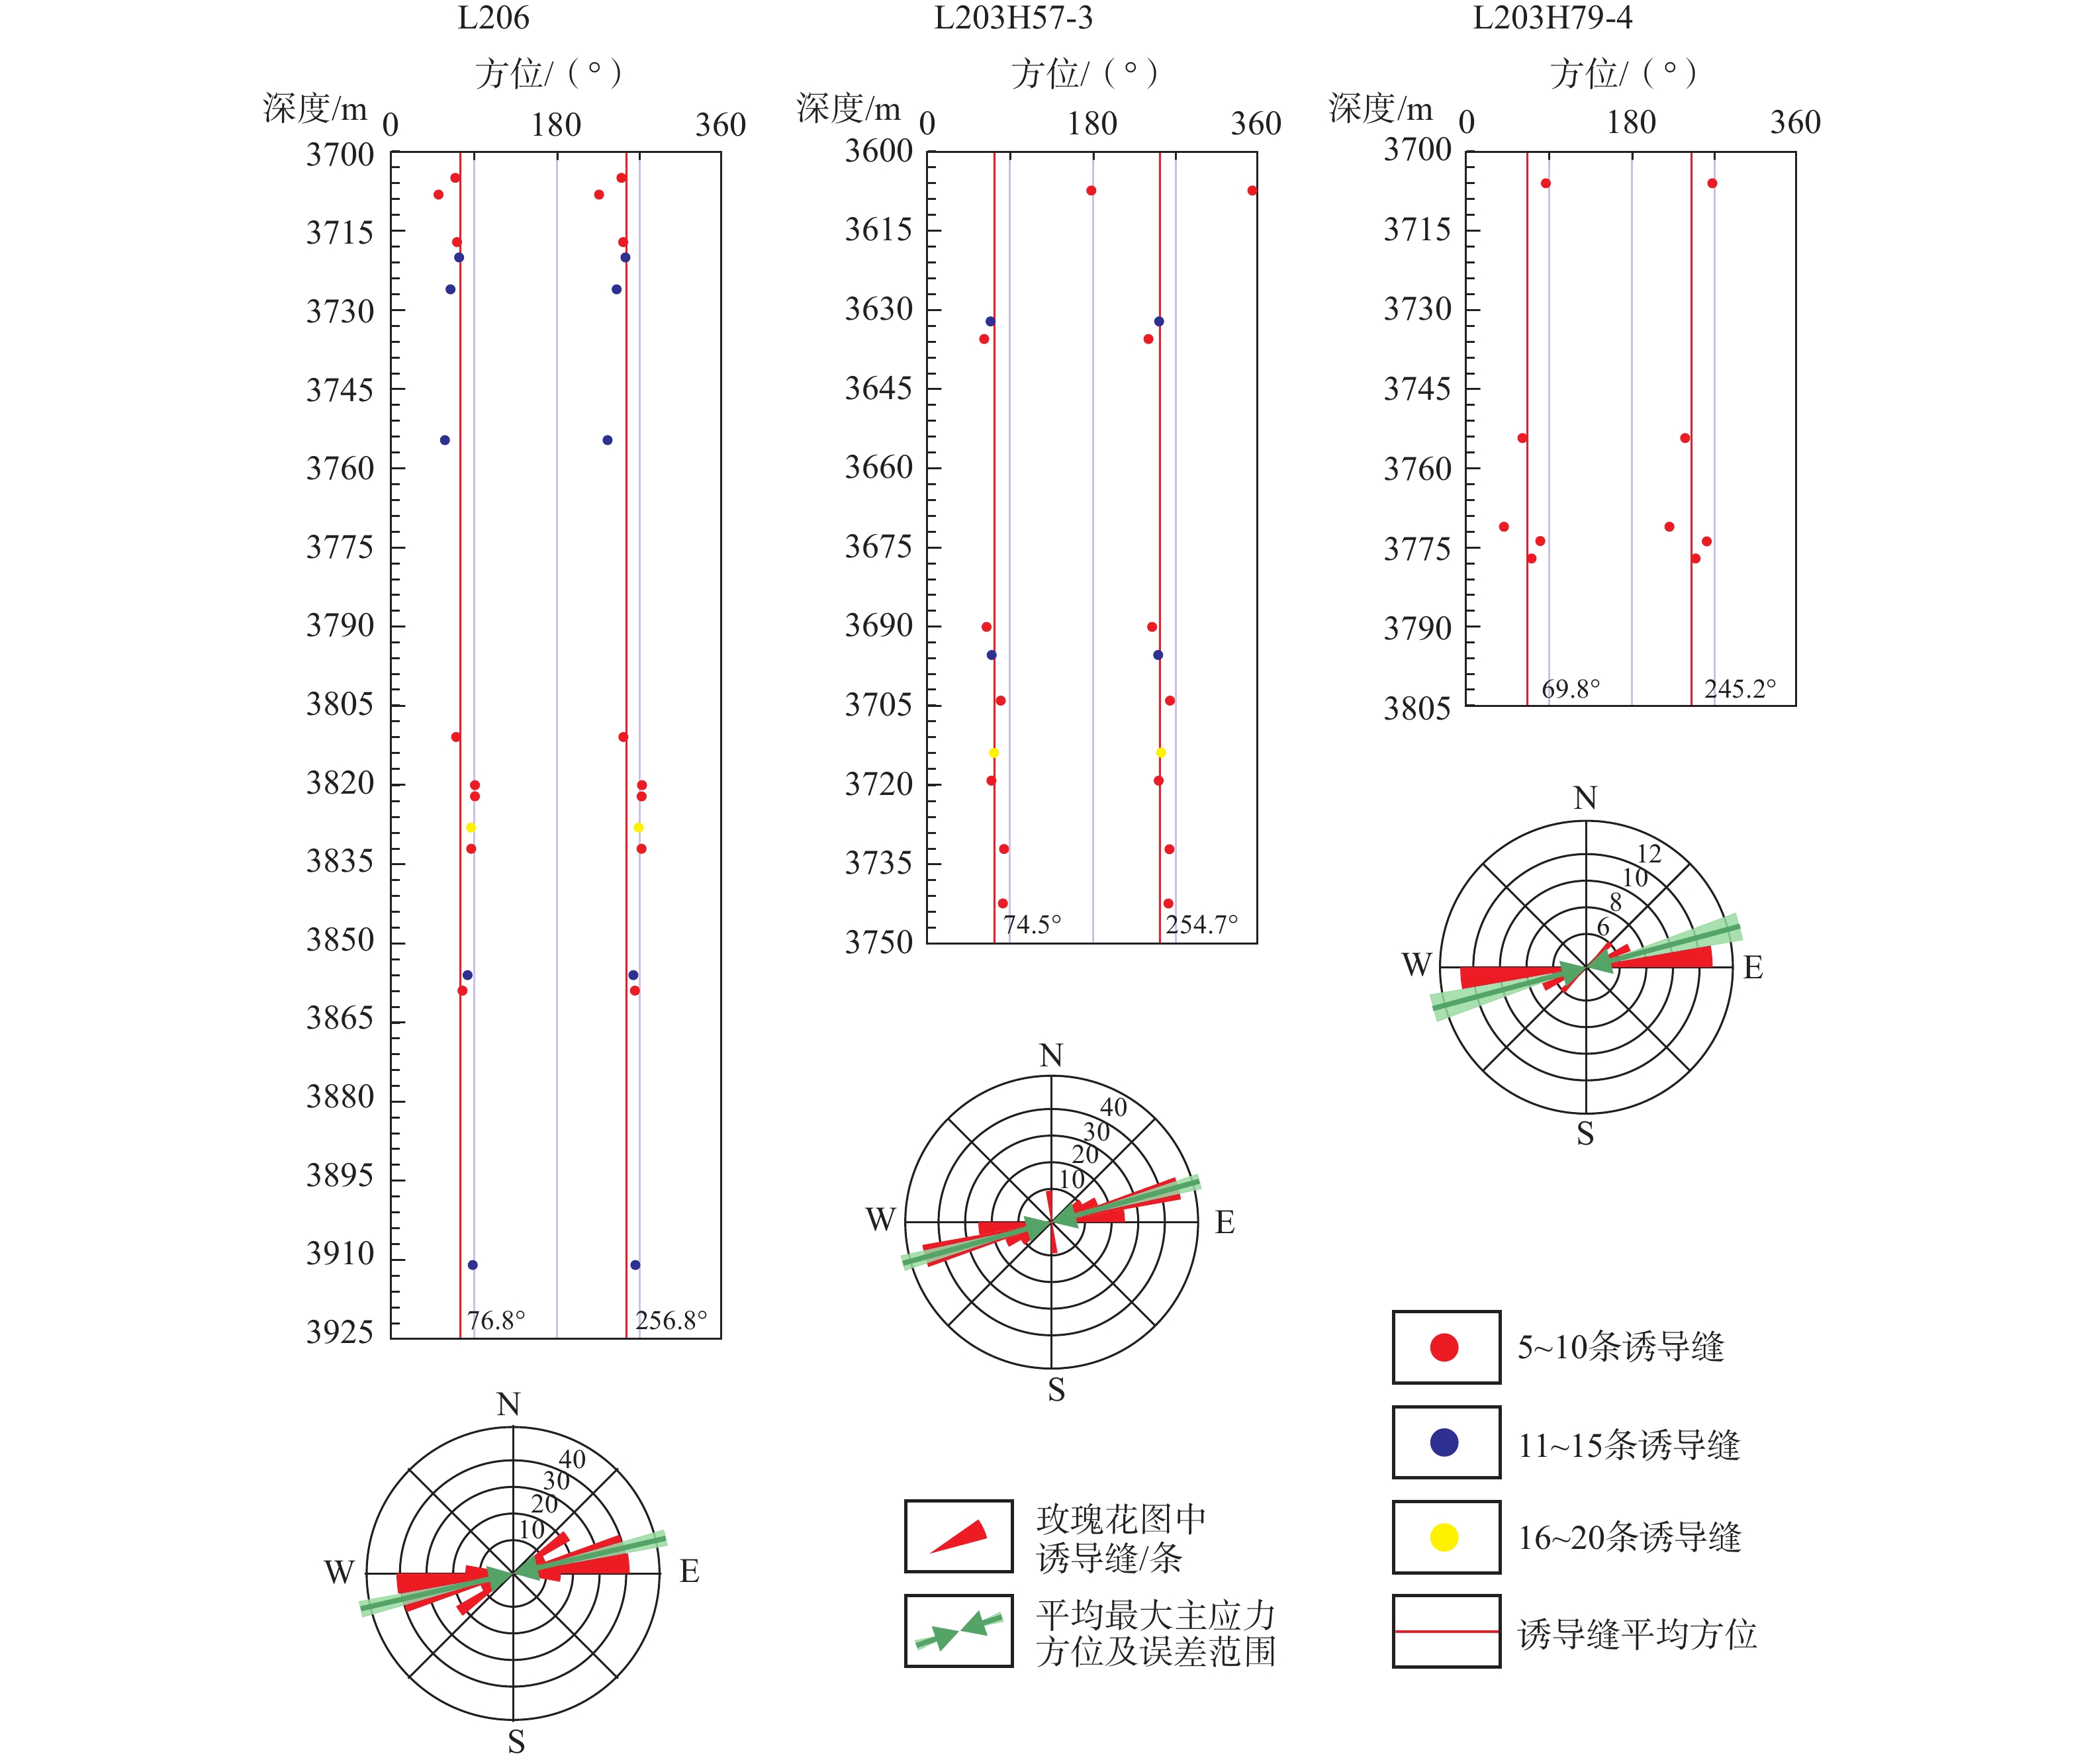
图 4 华蓥山断裂带南段中部地区钻孔的诱发张裂缝数量、方位与测量深度散点图
Figure 4. The number, orientation, and measurement depth of drilling-induced tensile fractures in boreholes drilled in the central area of the southern section of the Huayingshan fault zone
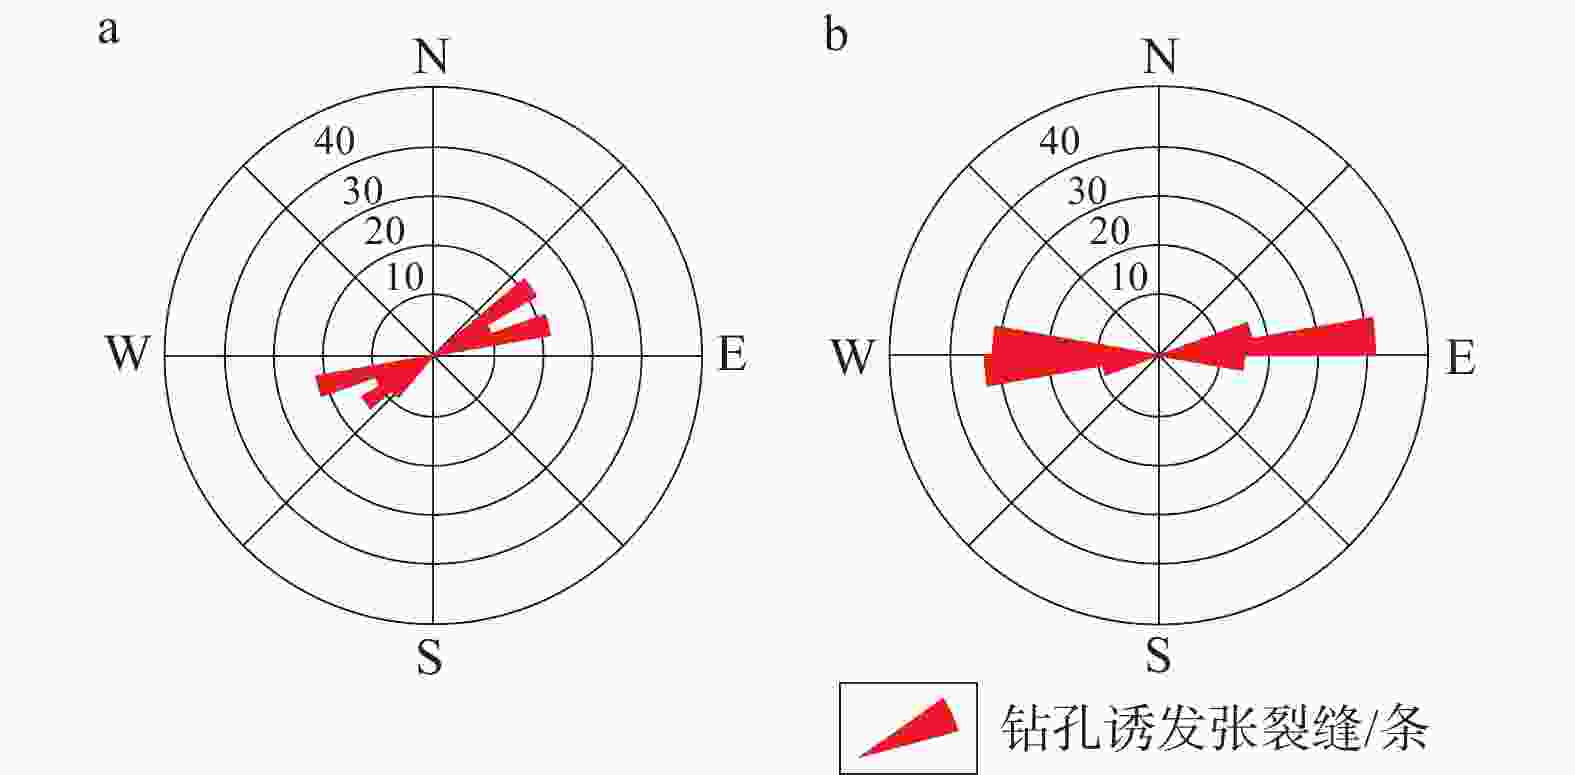
图 5 L206钻孔2个深度段的裂缝方位角玫瑰图
a—3700~3805 m深度段;b—3805~3925 m深度段
Figure 5. Rose diagram of the azimuth at two depths in borehole L206
(a)3700~3805 m depth; (b)3805~3925 m depth
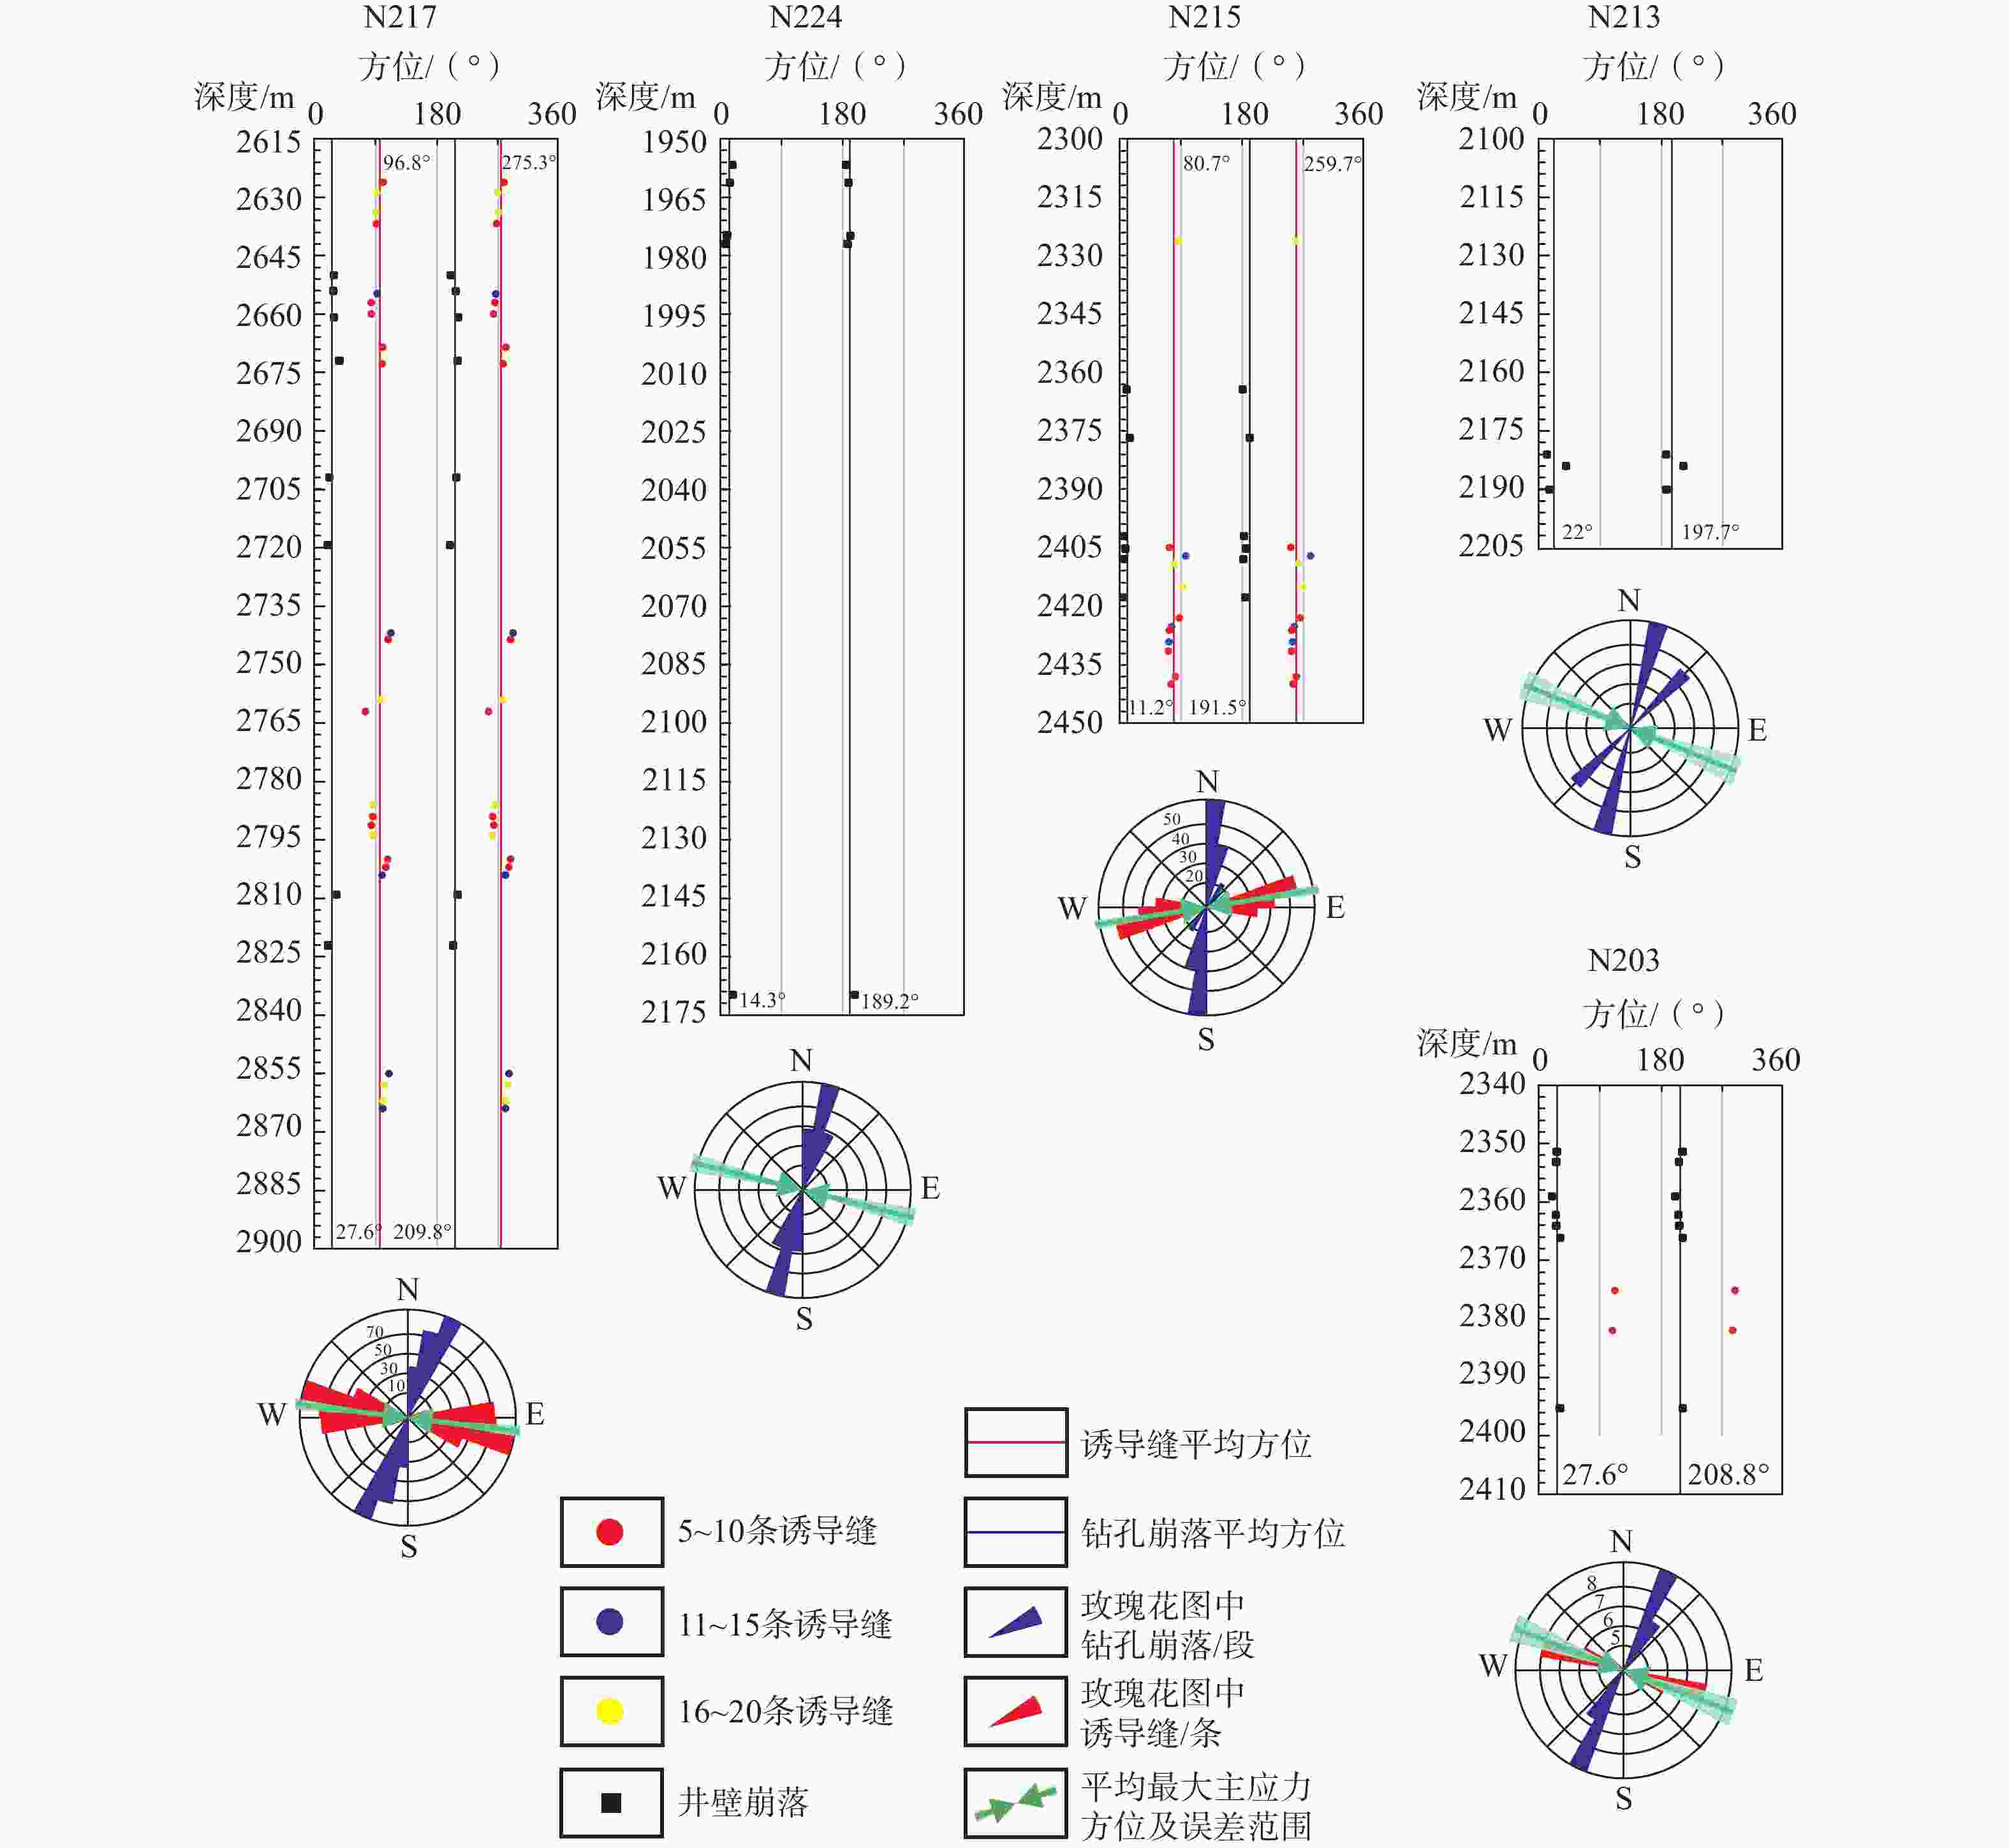
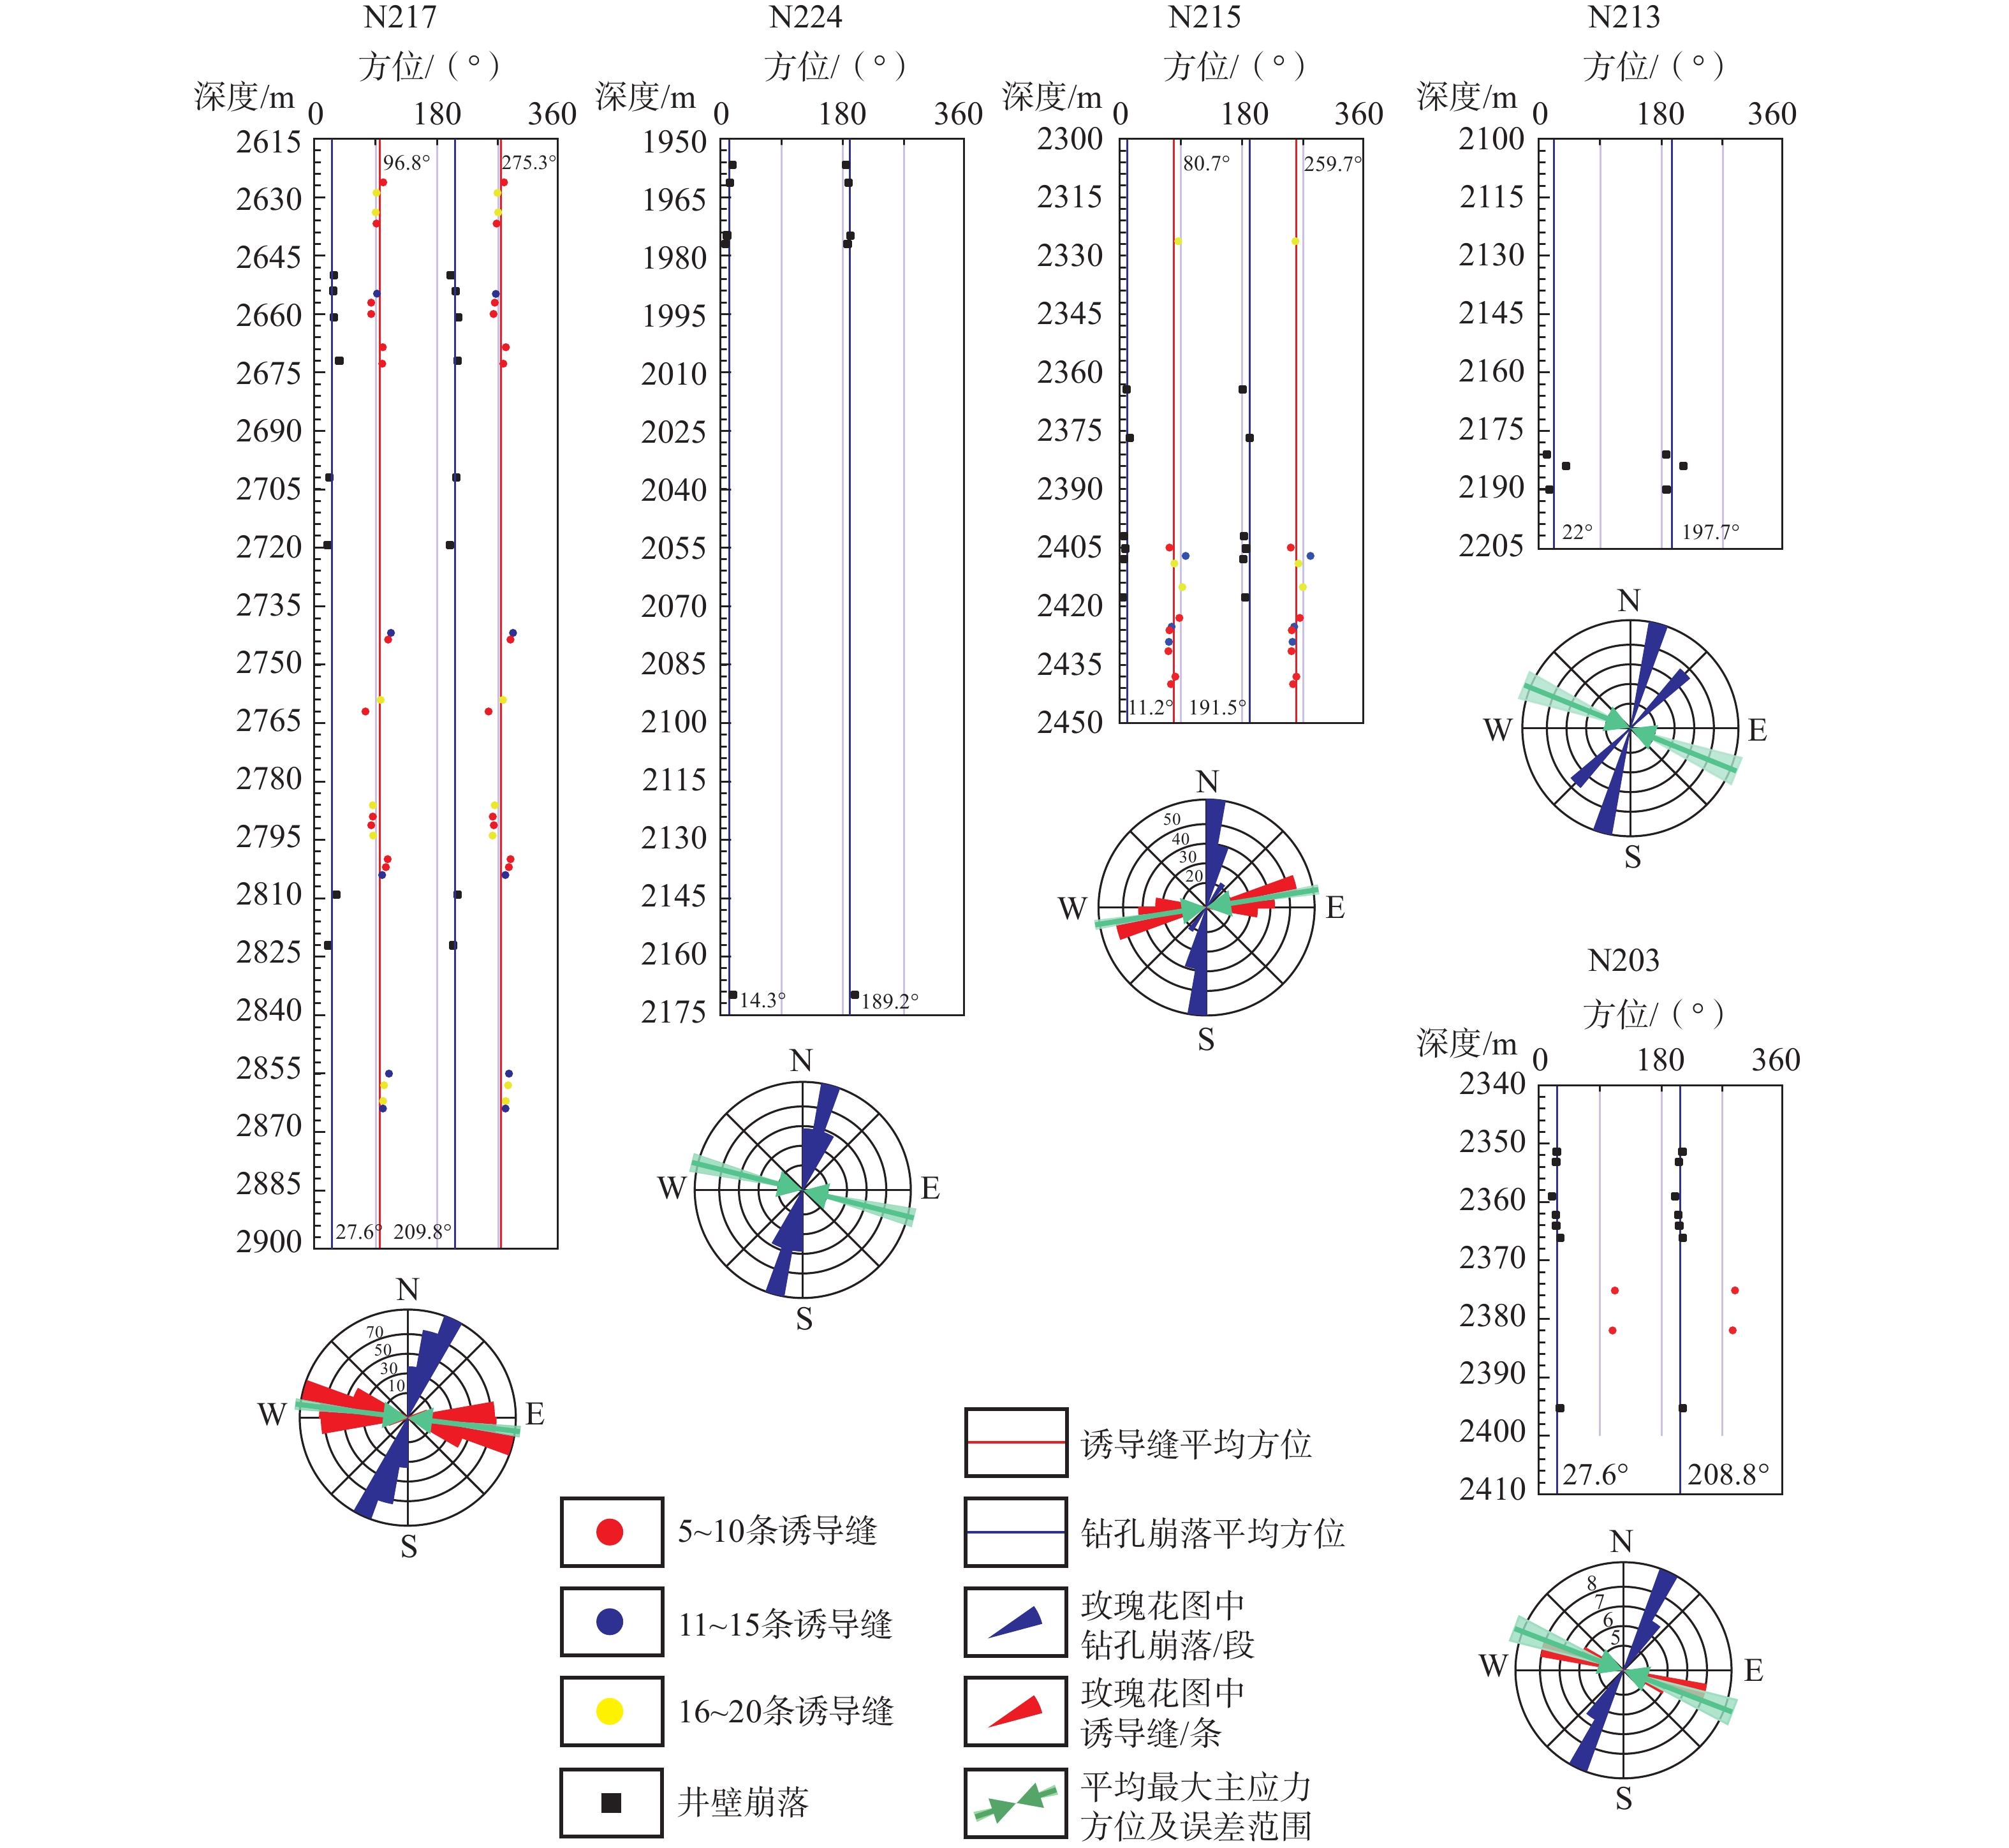
图 6 华蓥山断裂带南段南部钻孔的诱发张裂缝方位、钻孔崩落方位与测量深度散点图
Figure 6. The number, orientation, and measurement depth of drilling-induced tensile fractures in boreholes drilled in the southern area of the southern section of the Huayingshan fault zone
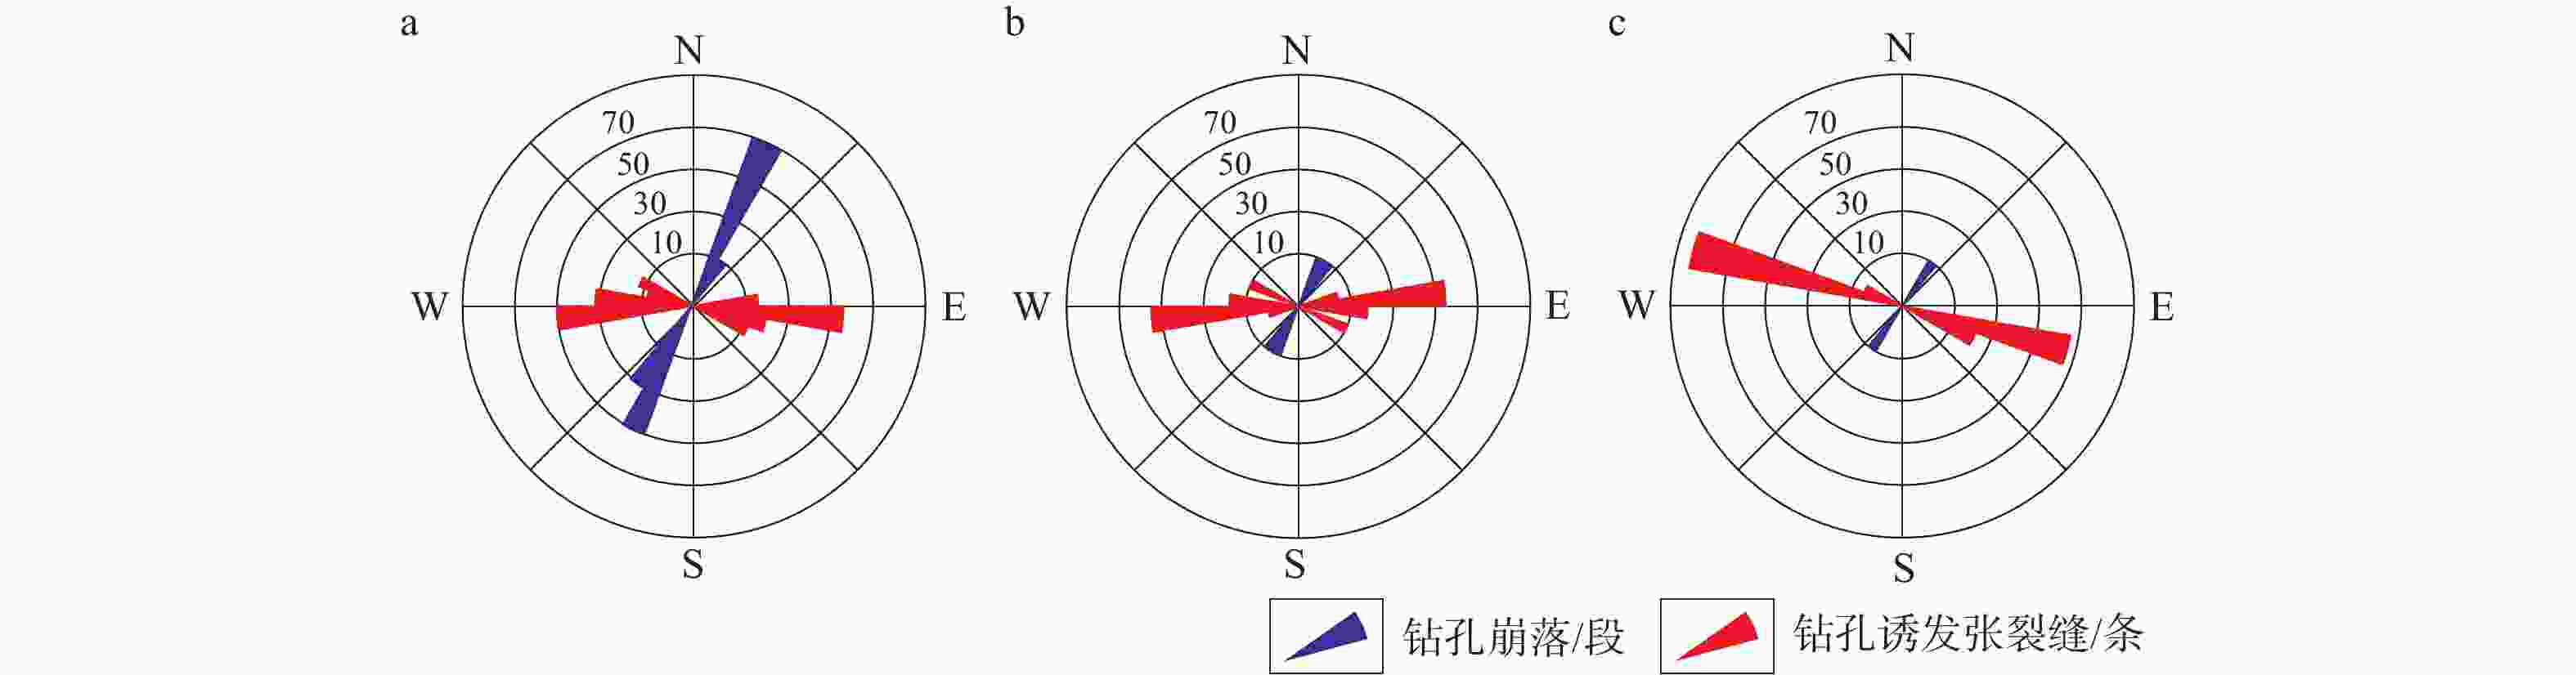
图 7 N217钻孔3个深度的裂缝方位角玫瑰图
a—2615~2705 m深度段;b—2705~2810 m深度段;c—2810~2900 m深度段
Figure 7. Rose diagram of the azimuth at three depths in borehole L217
(a)2615~2705 m depth; (b)2705~2810 m depth; (c)2810~2900 m depth
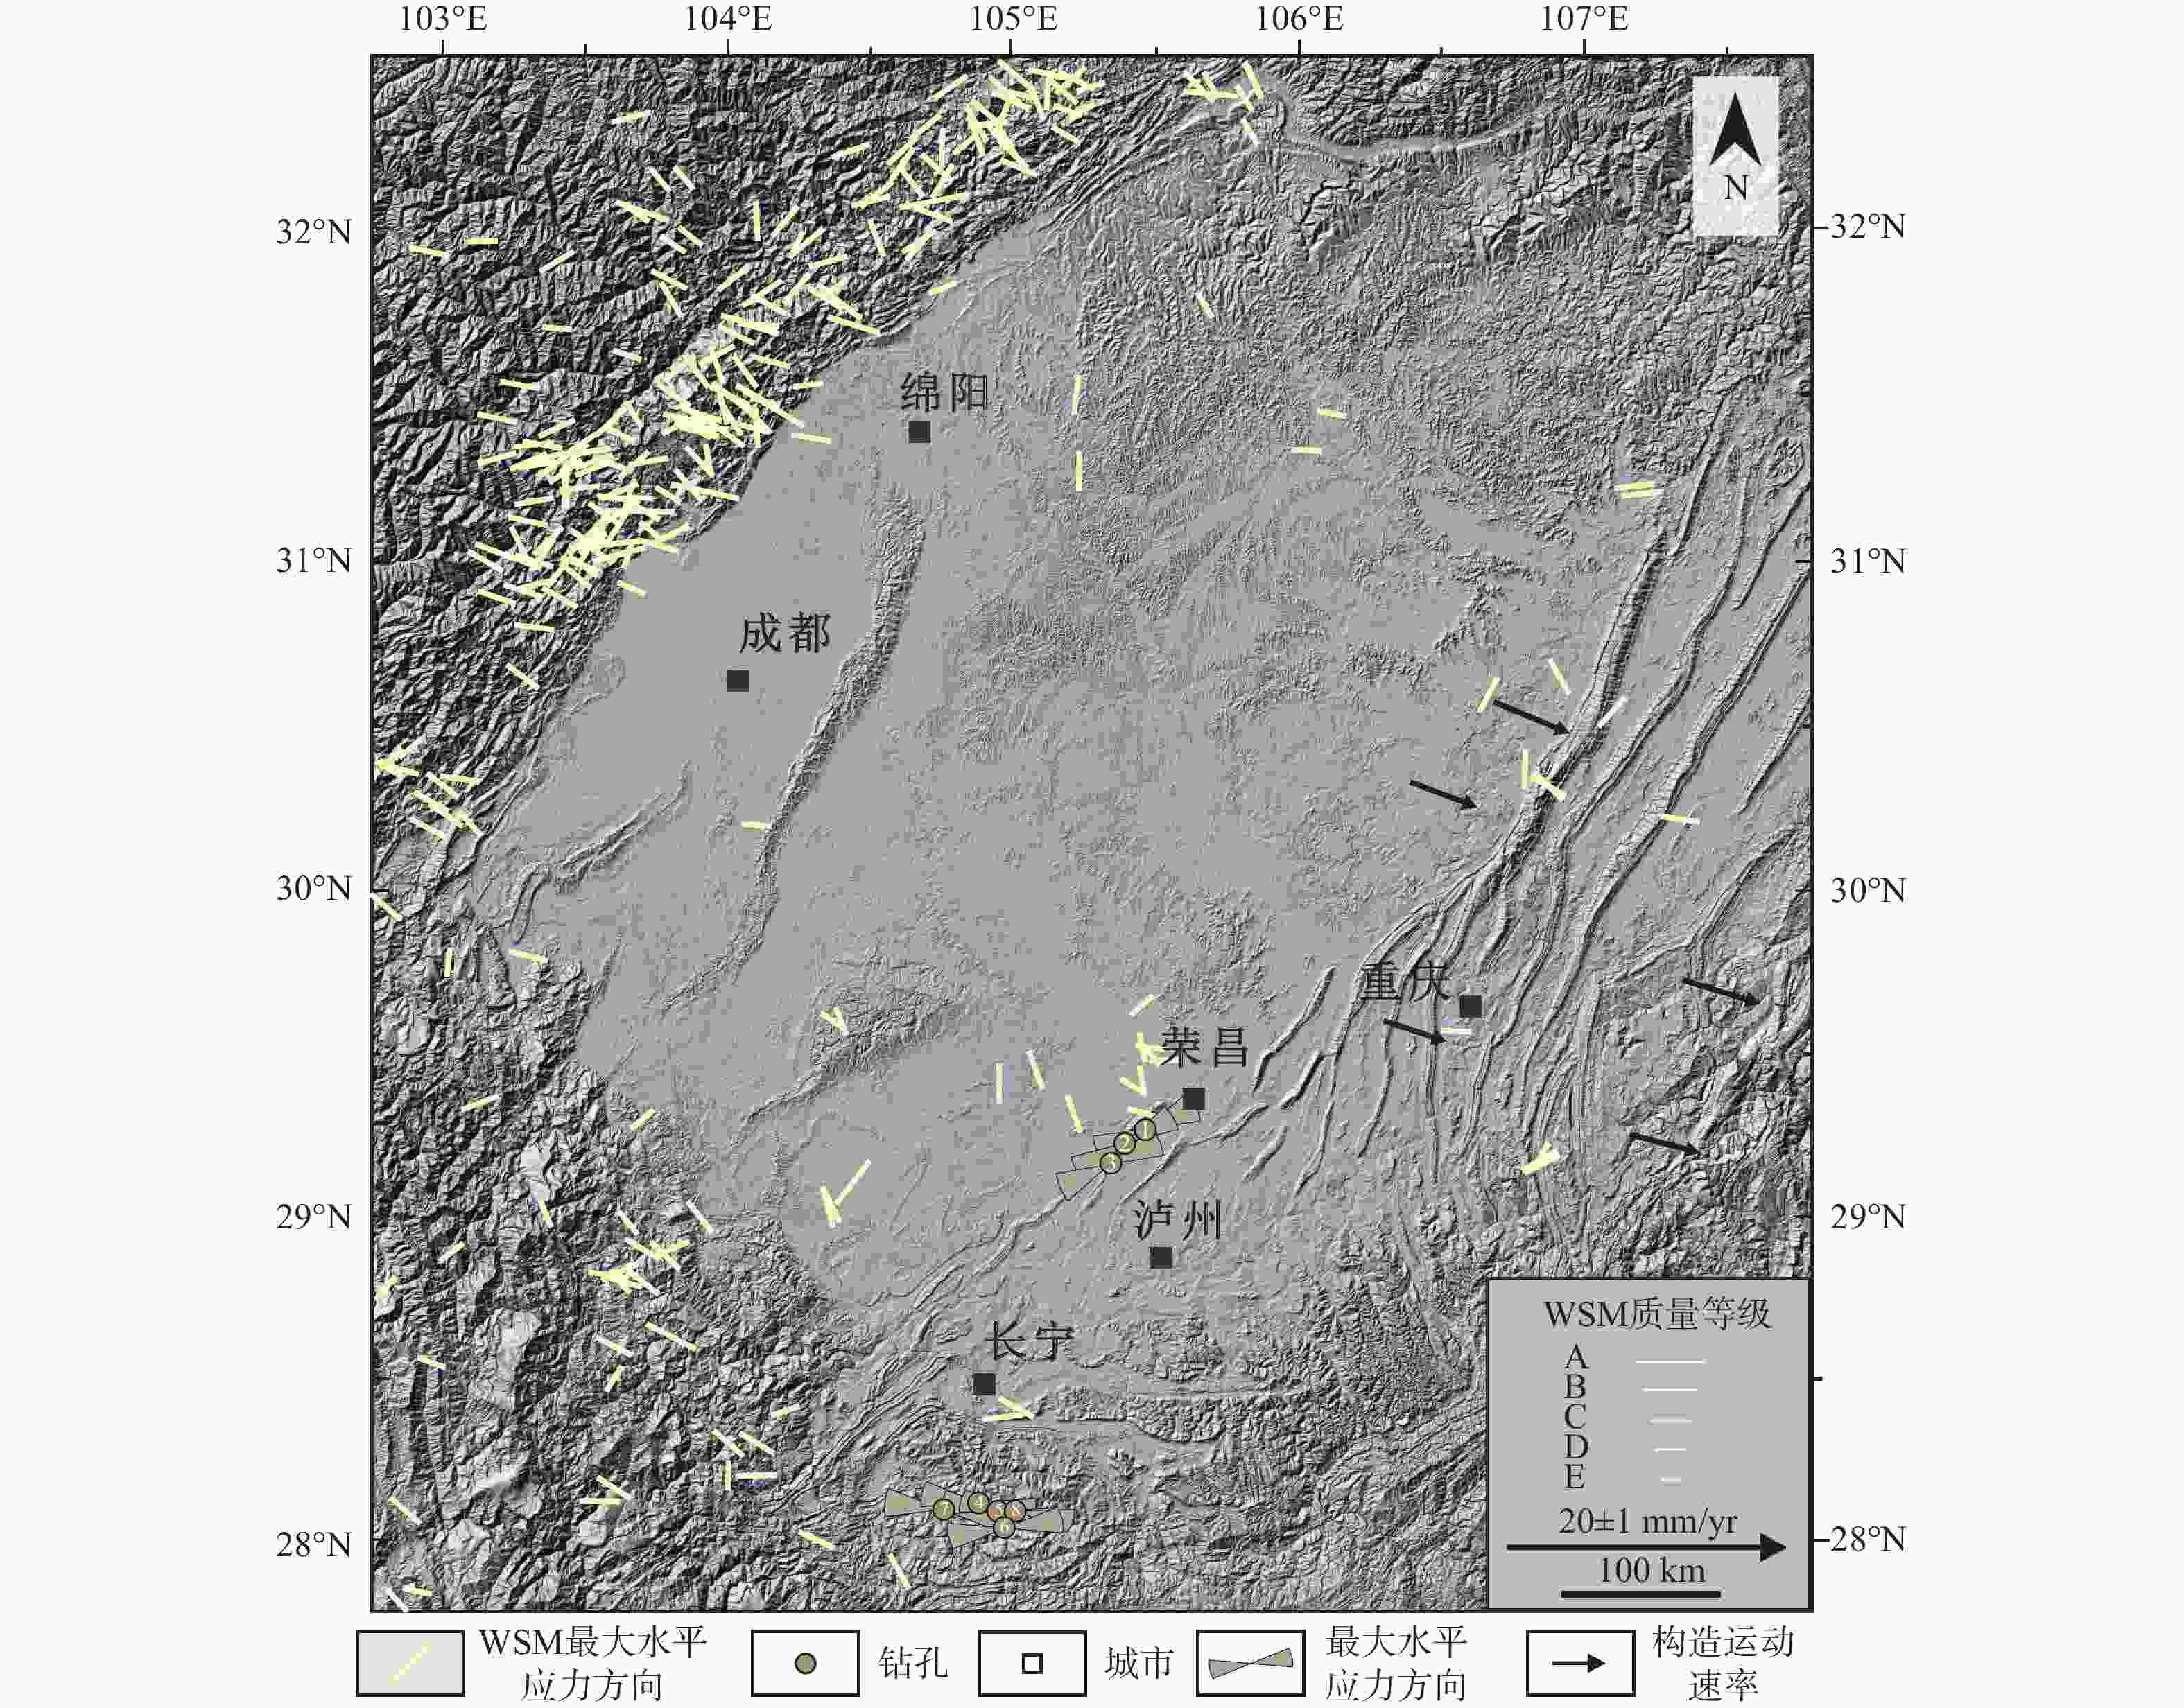
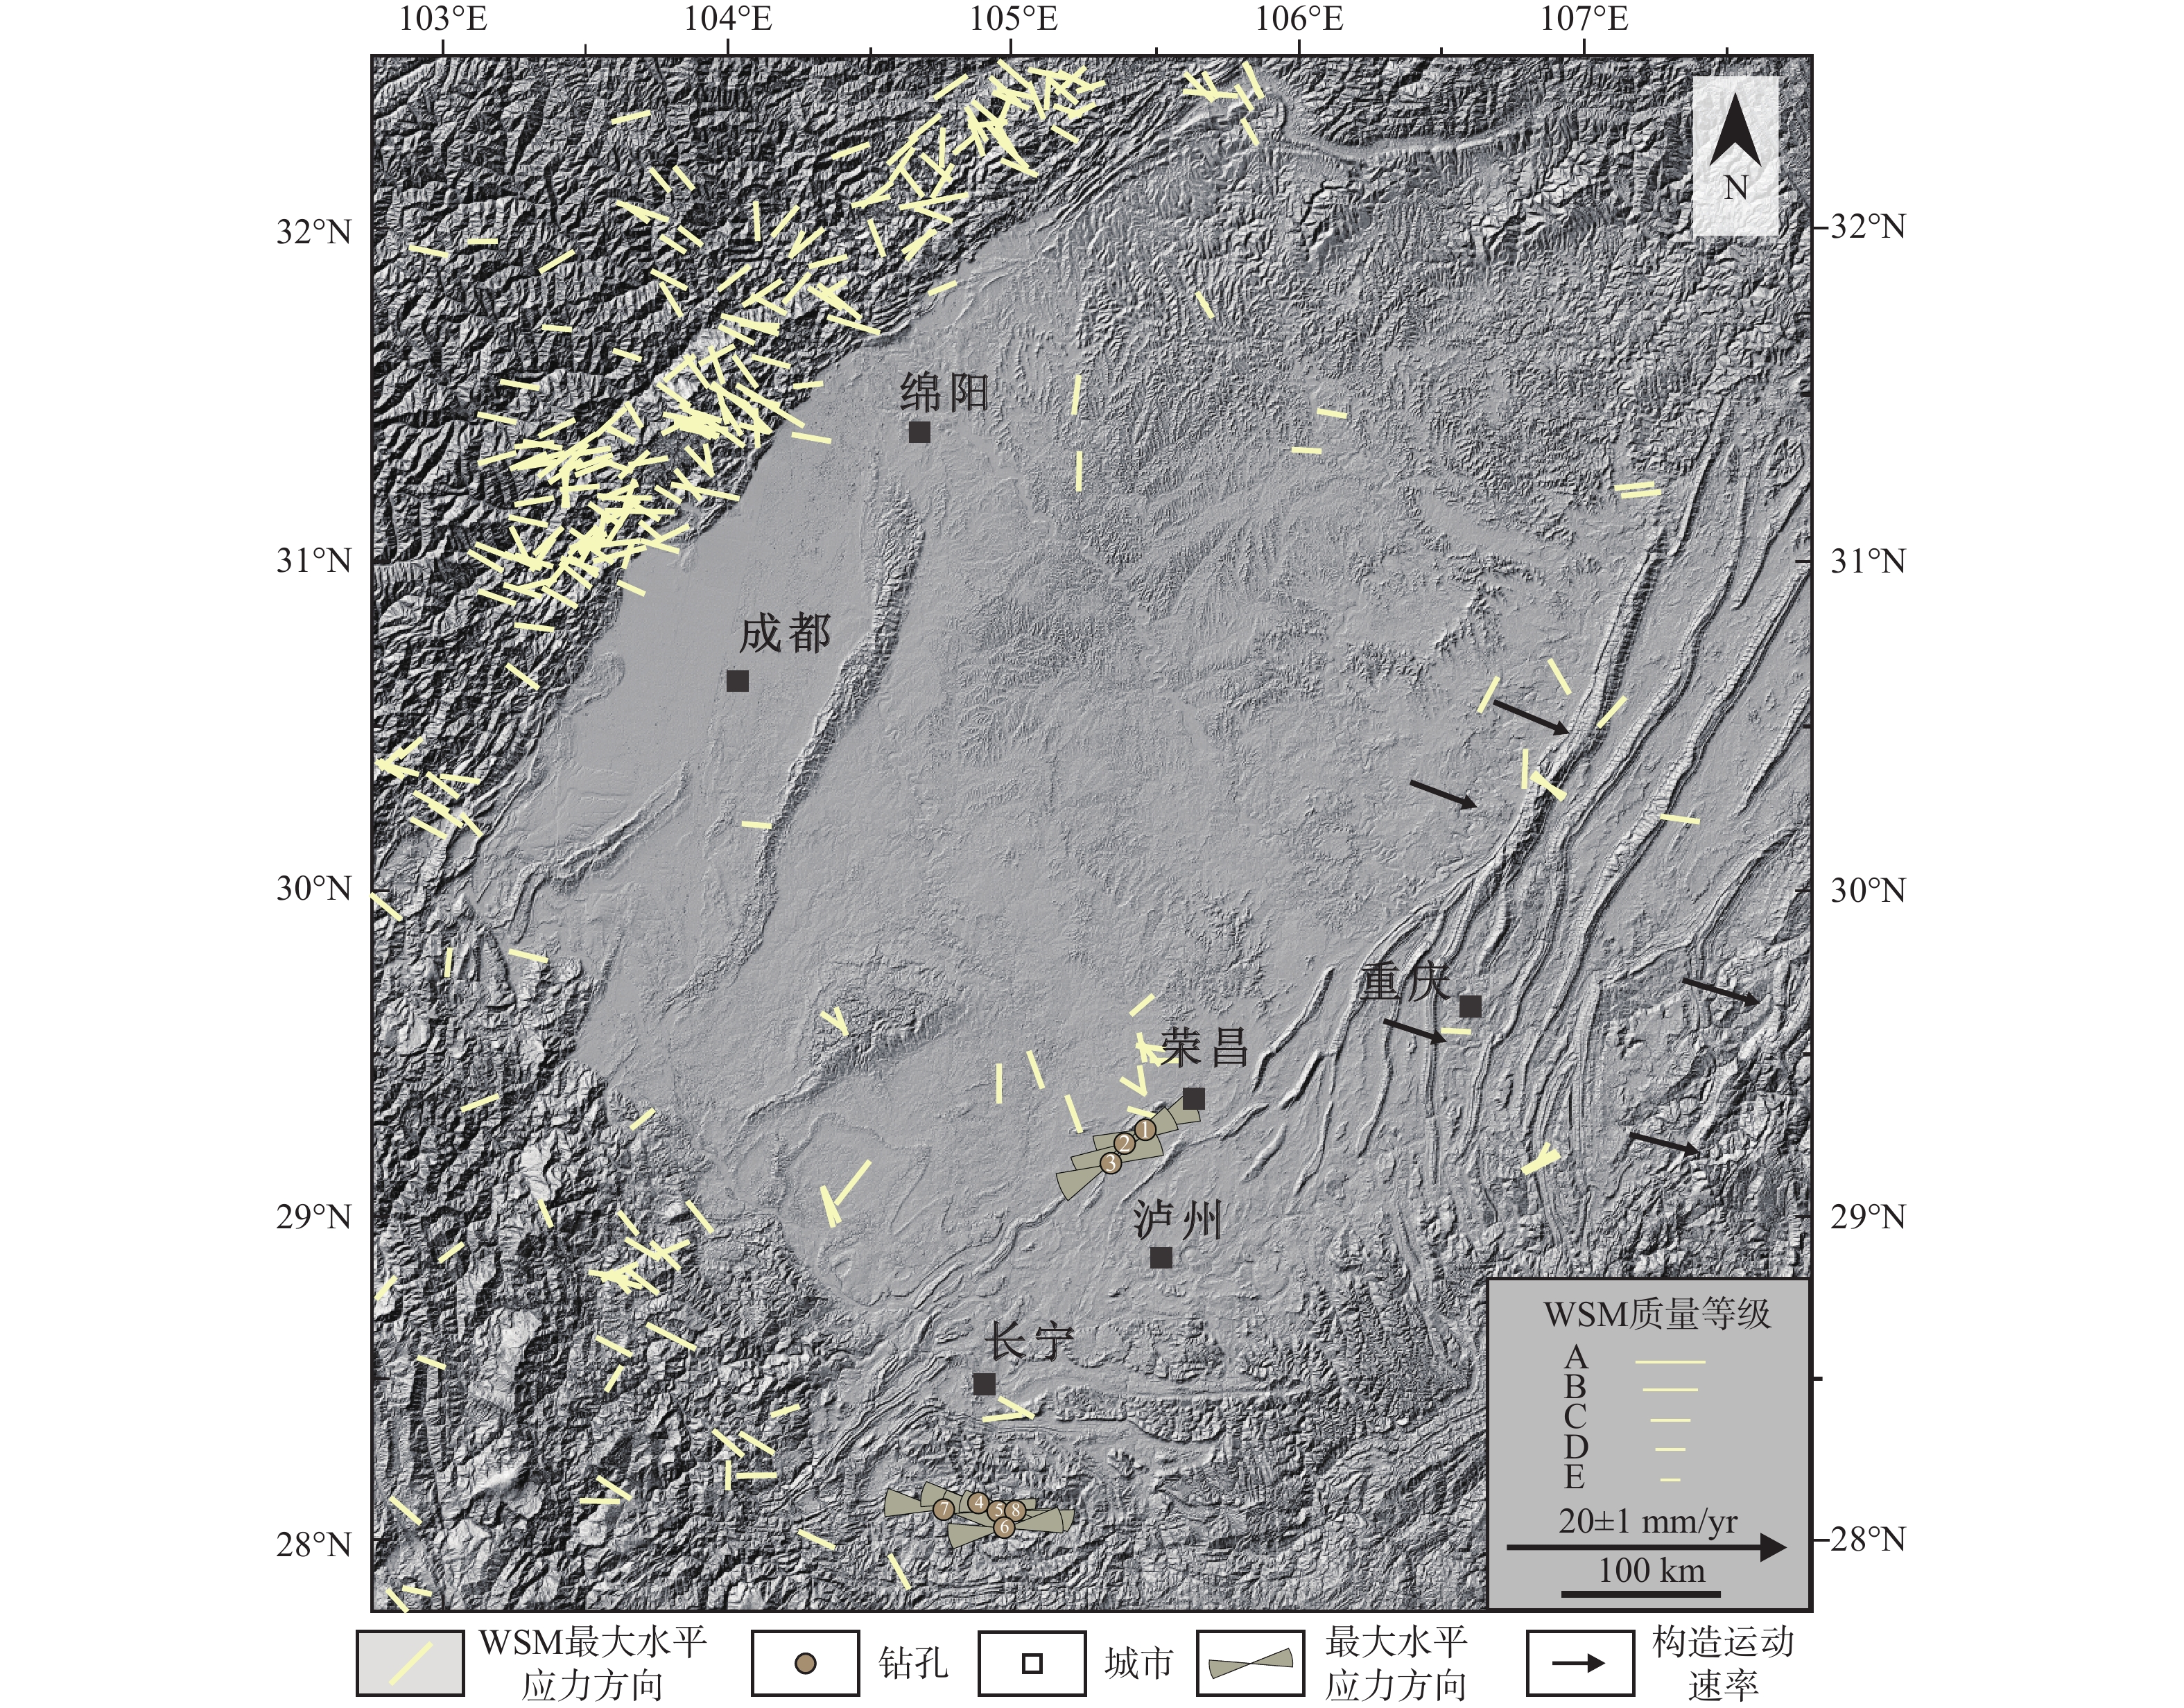
图 8 四川盆地及其邻近地区的地应力数据分布图(WSM最大水平主应力数据来自Heidbach et al.,2018;GPS数据来源于中国地震台网中心国家地震科学数据中心http://data.earthquake.cn)
Figure 8. Crustal stress data distribution in the Sichuan Basin (The WSM maximum horizontal principal stress data are from Heidbach et al., 2018; The GPS dataset is provided by the China Earthquake Networks Center, National Earthquake Data Center (http://data.earthquake.cn))
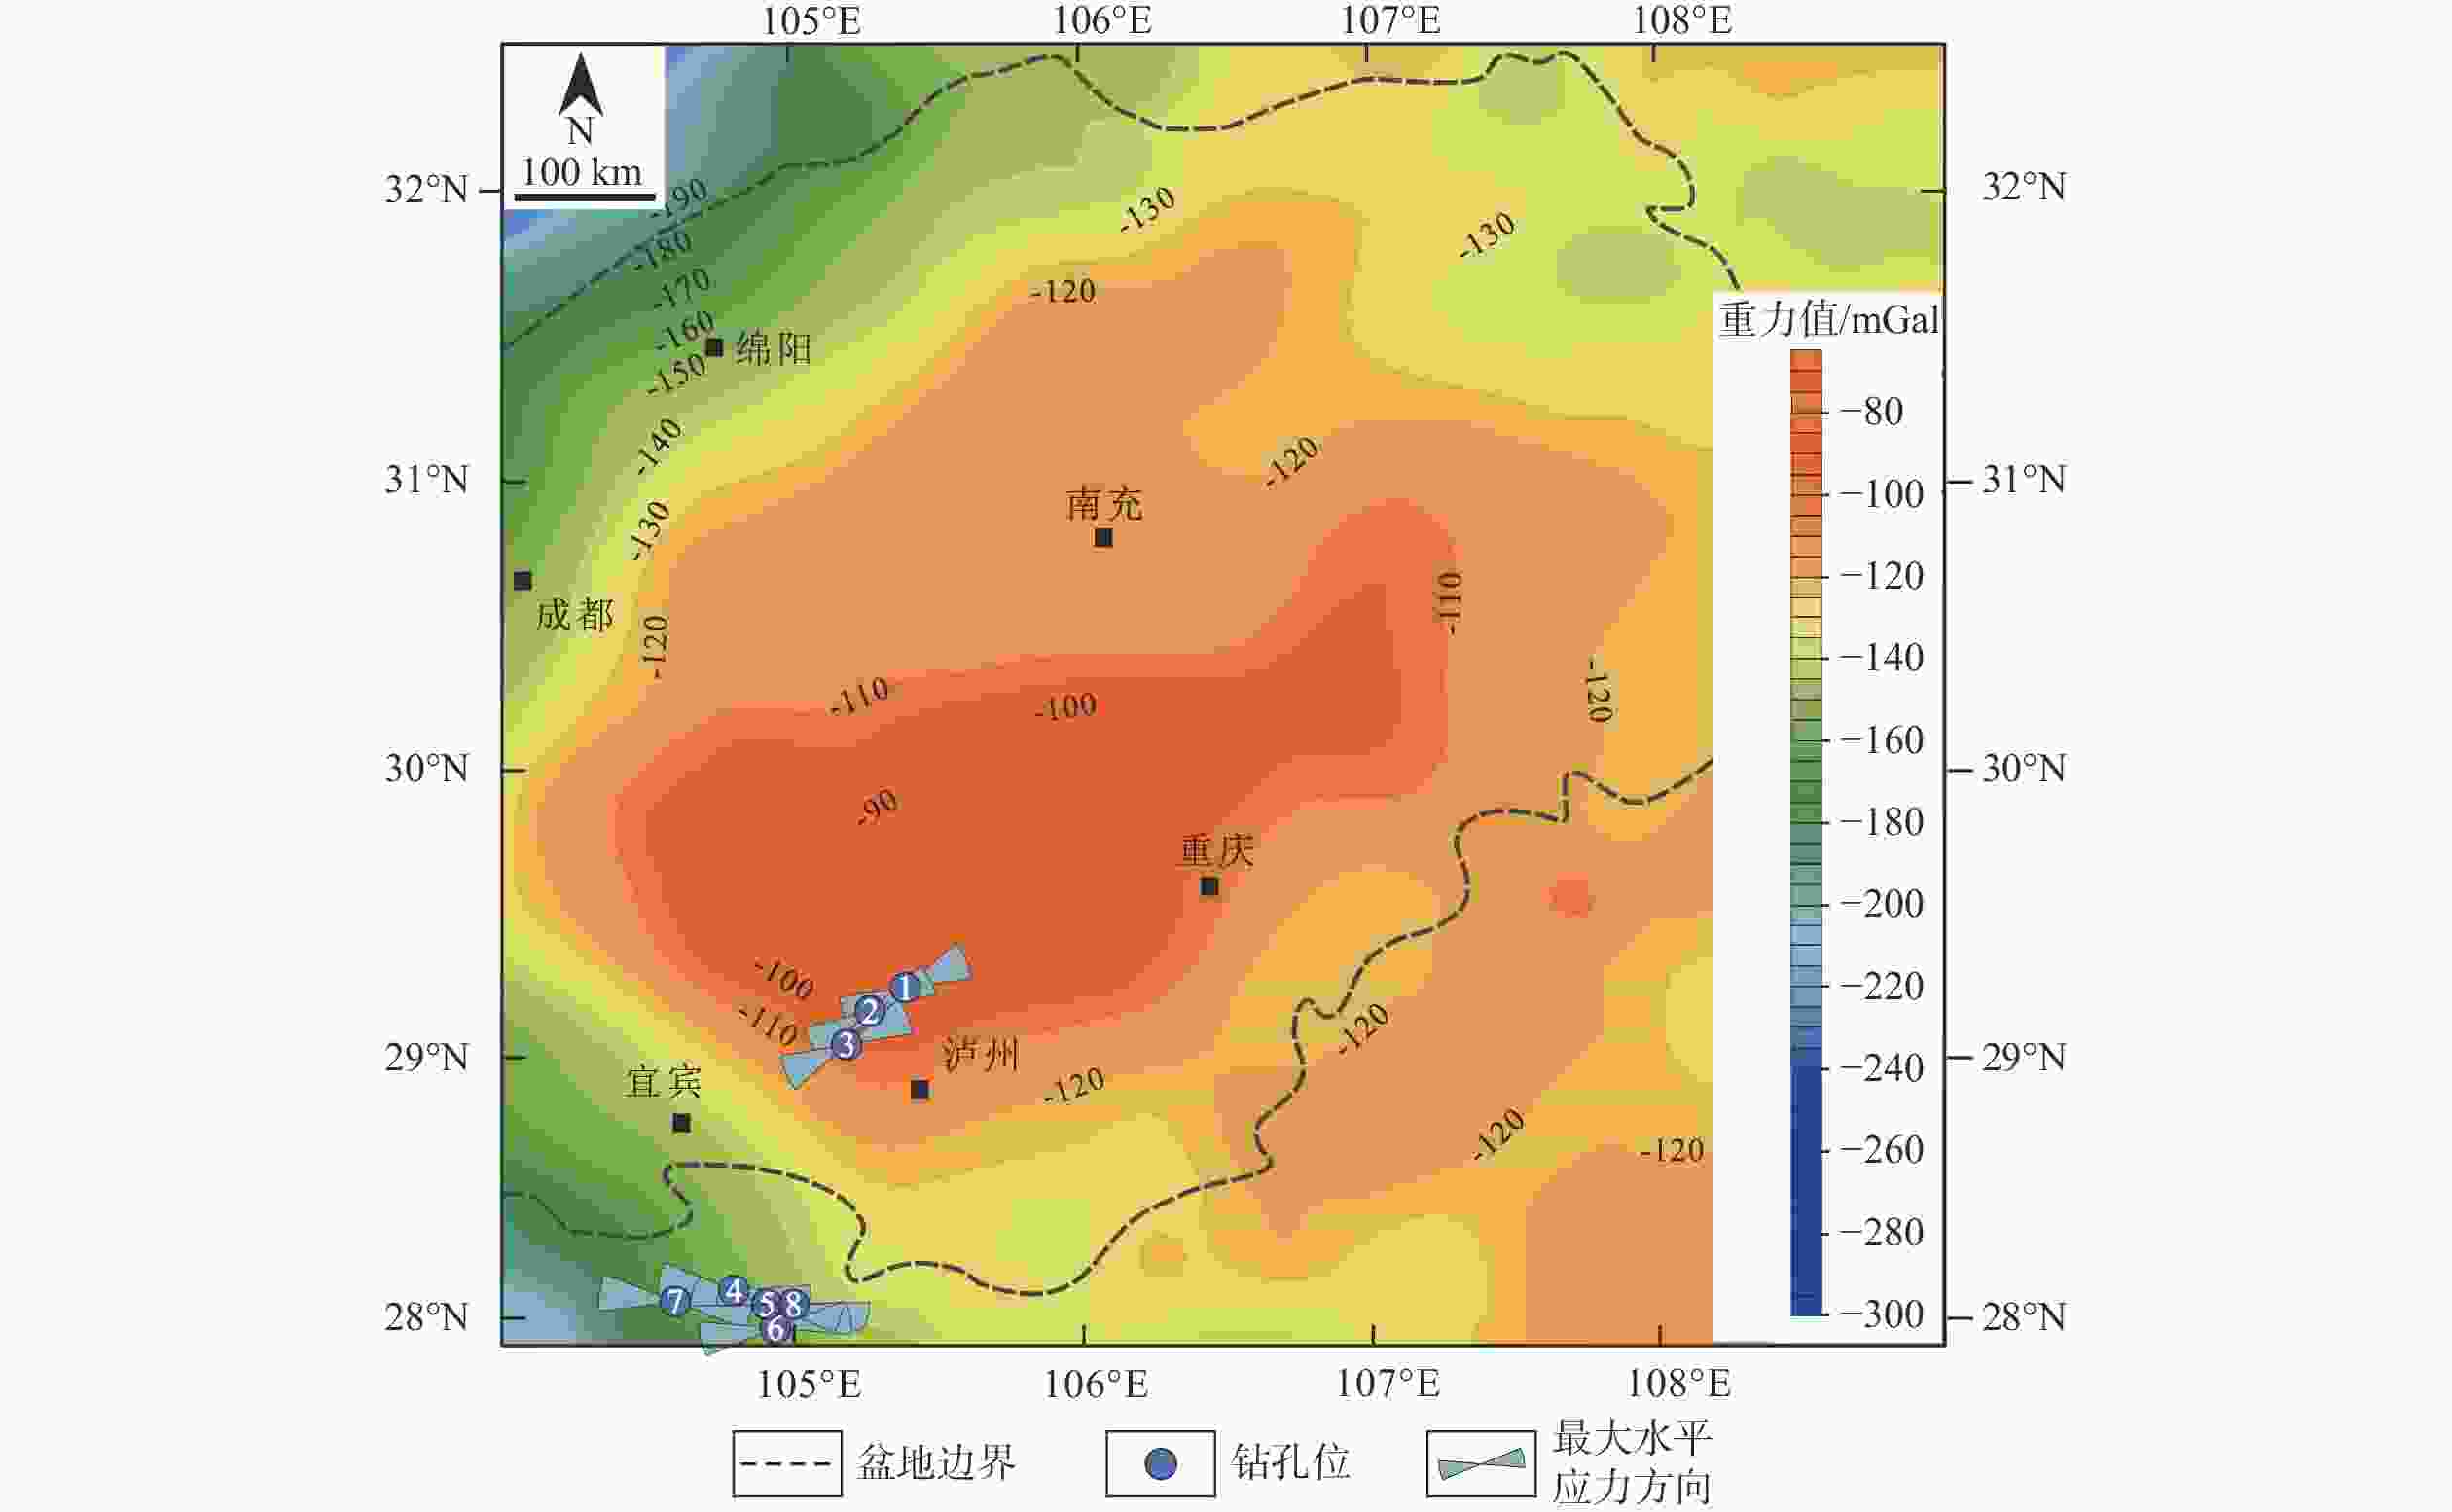
图 9 四川盆地重力异常图(据熊小松等,2015修改)
Figure 9. Gravity anomaly in the Sichuan Basin (modified from Xiong et al., 2015)
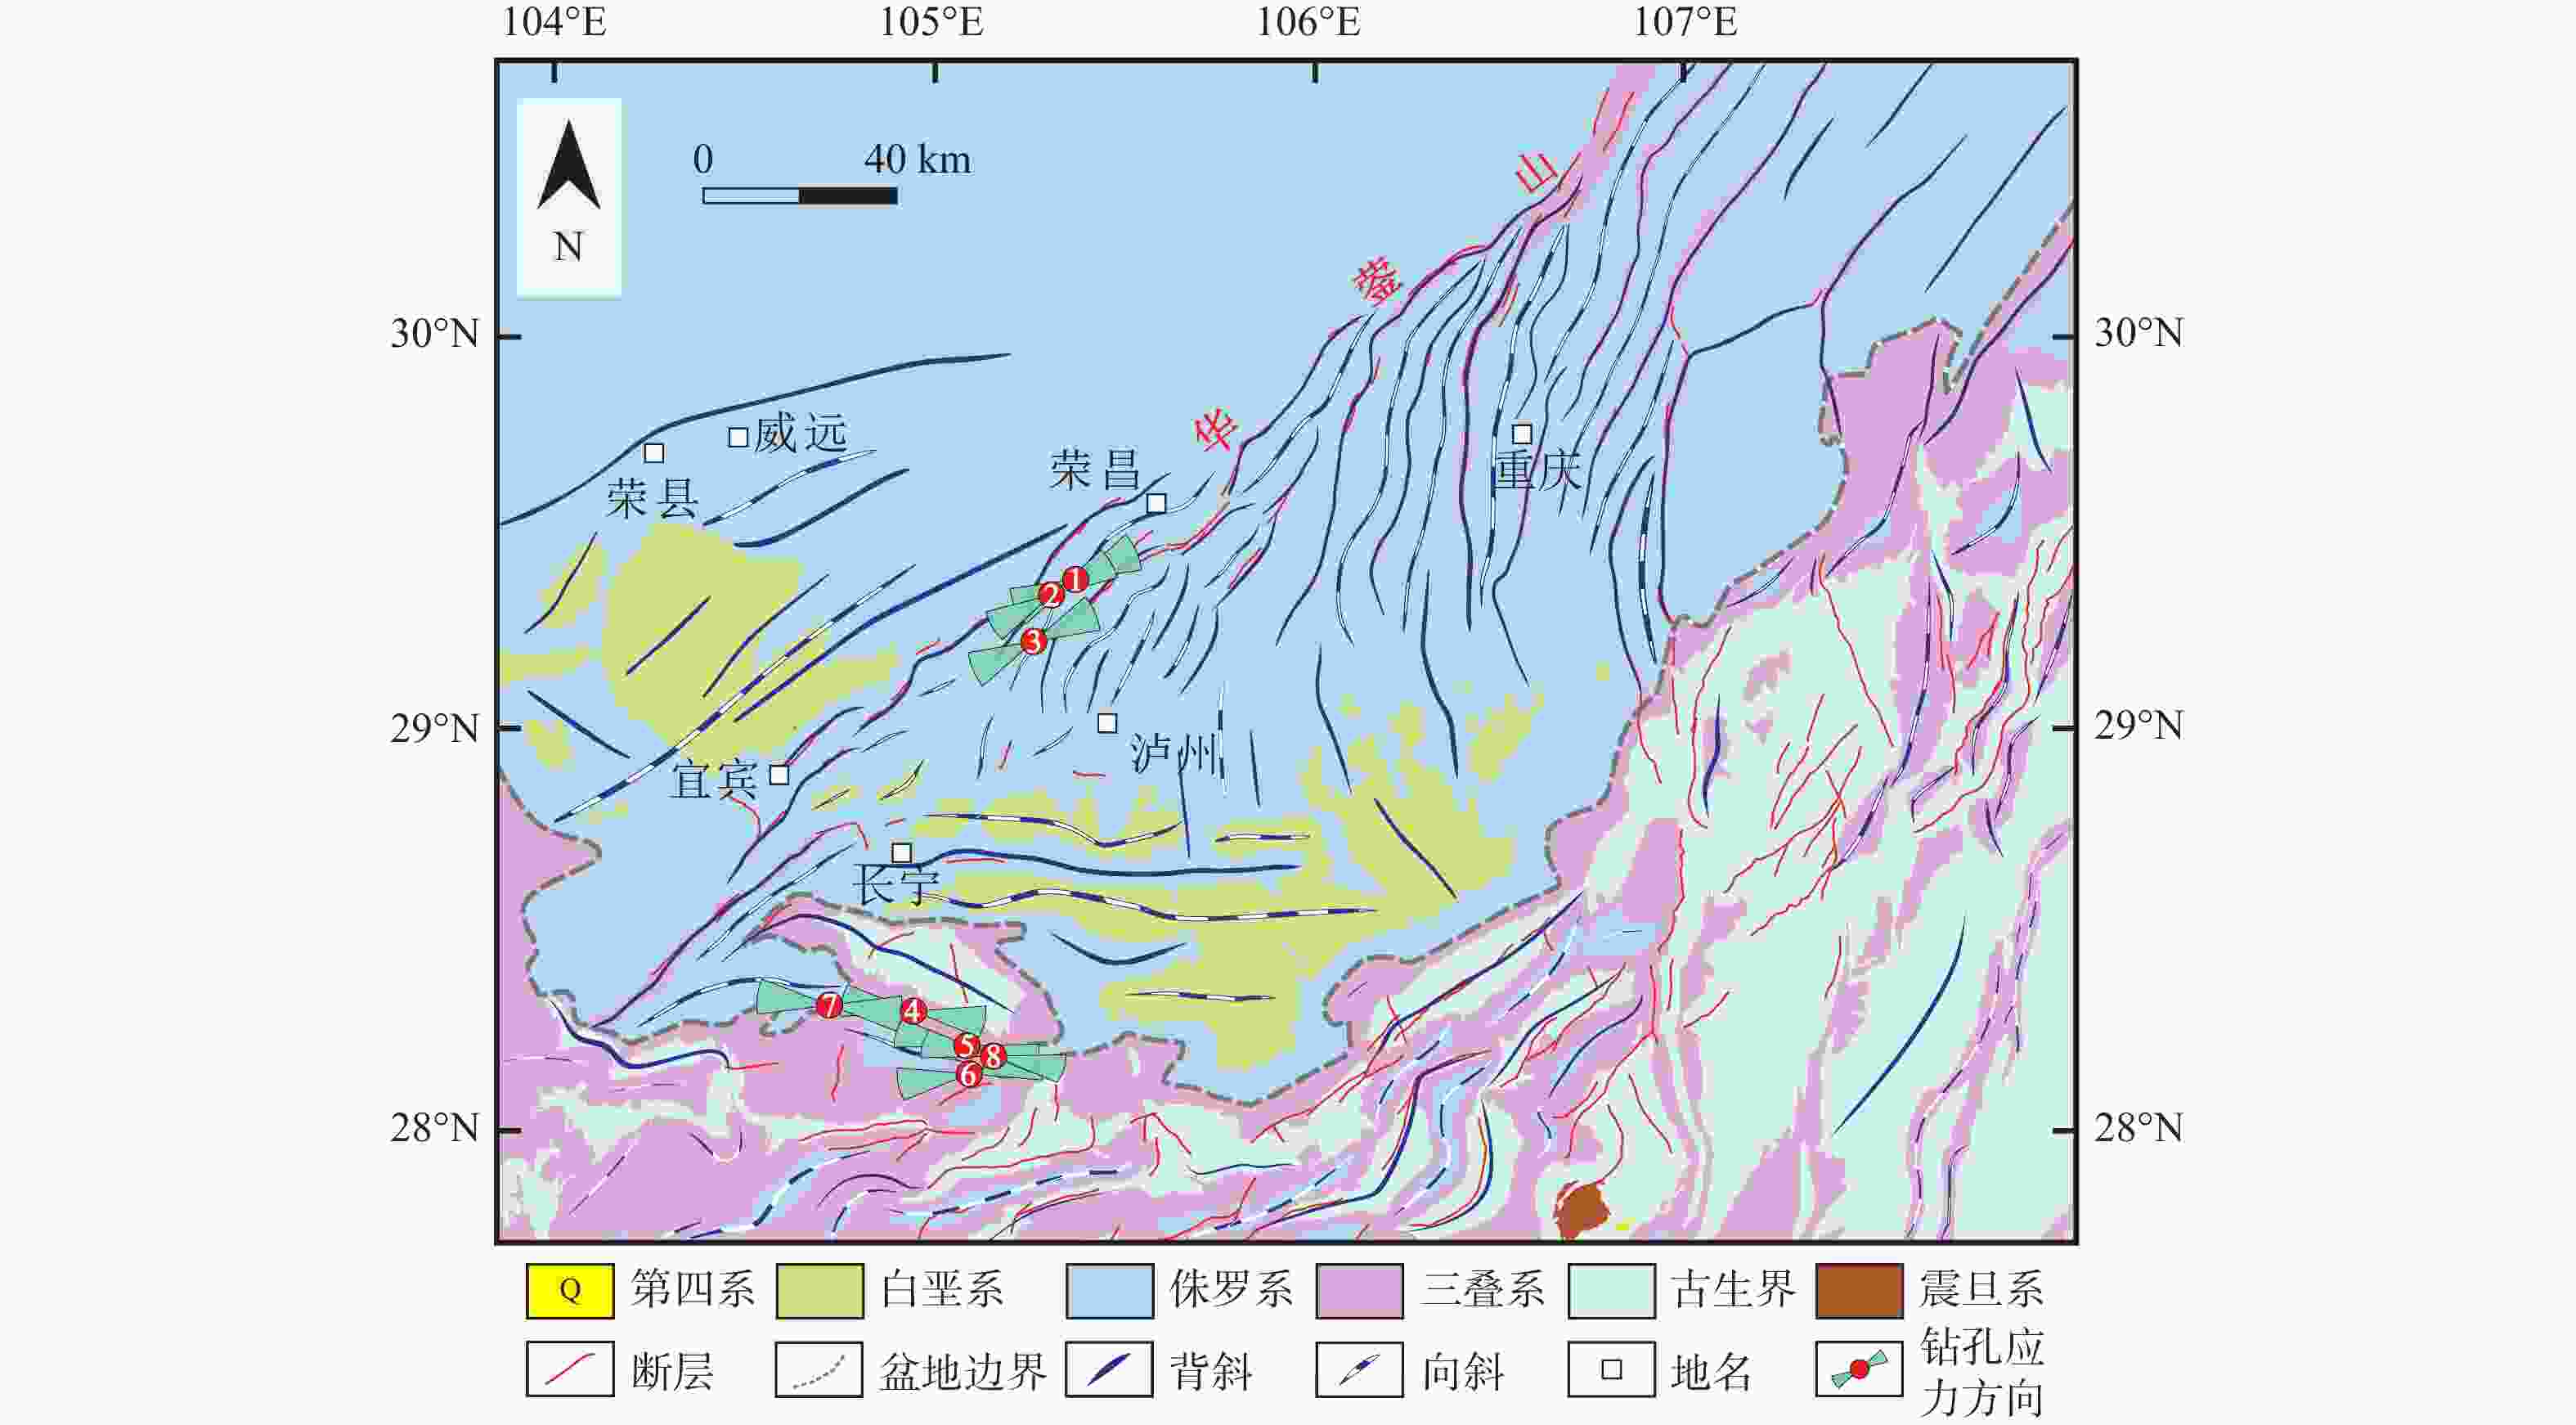
图 10 华蓥山断裂带南段东侧构造背景图
Figure 10. Tectonic background on the eastern side of the southern section of the Huayingshan fault zone
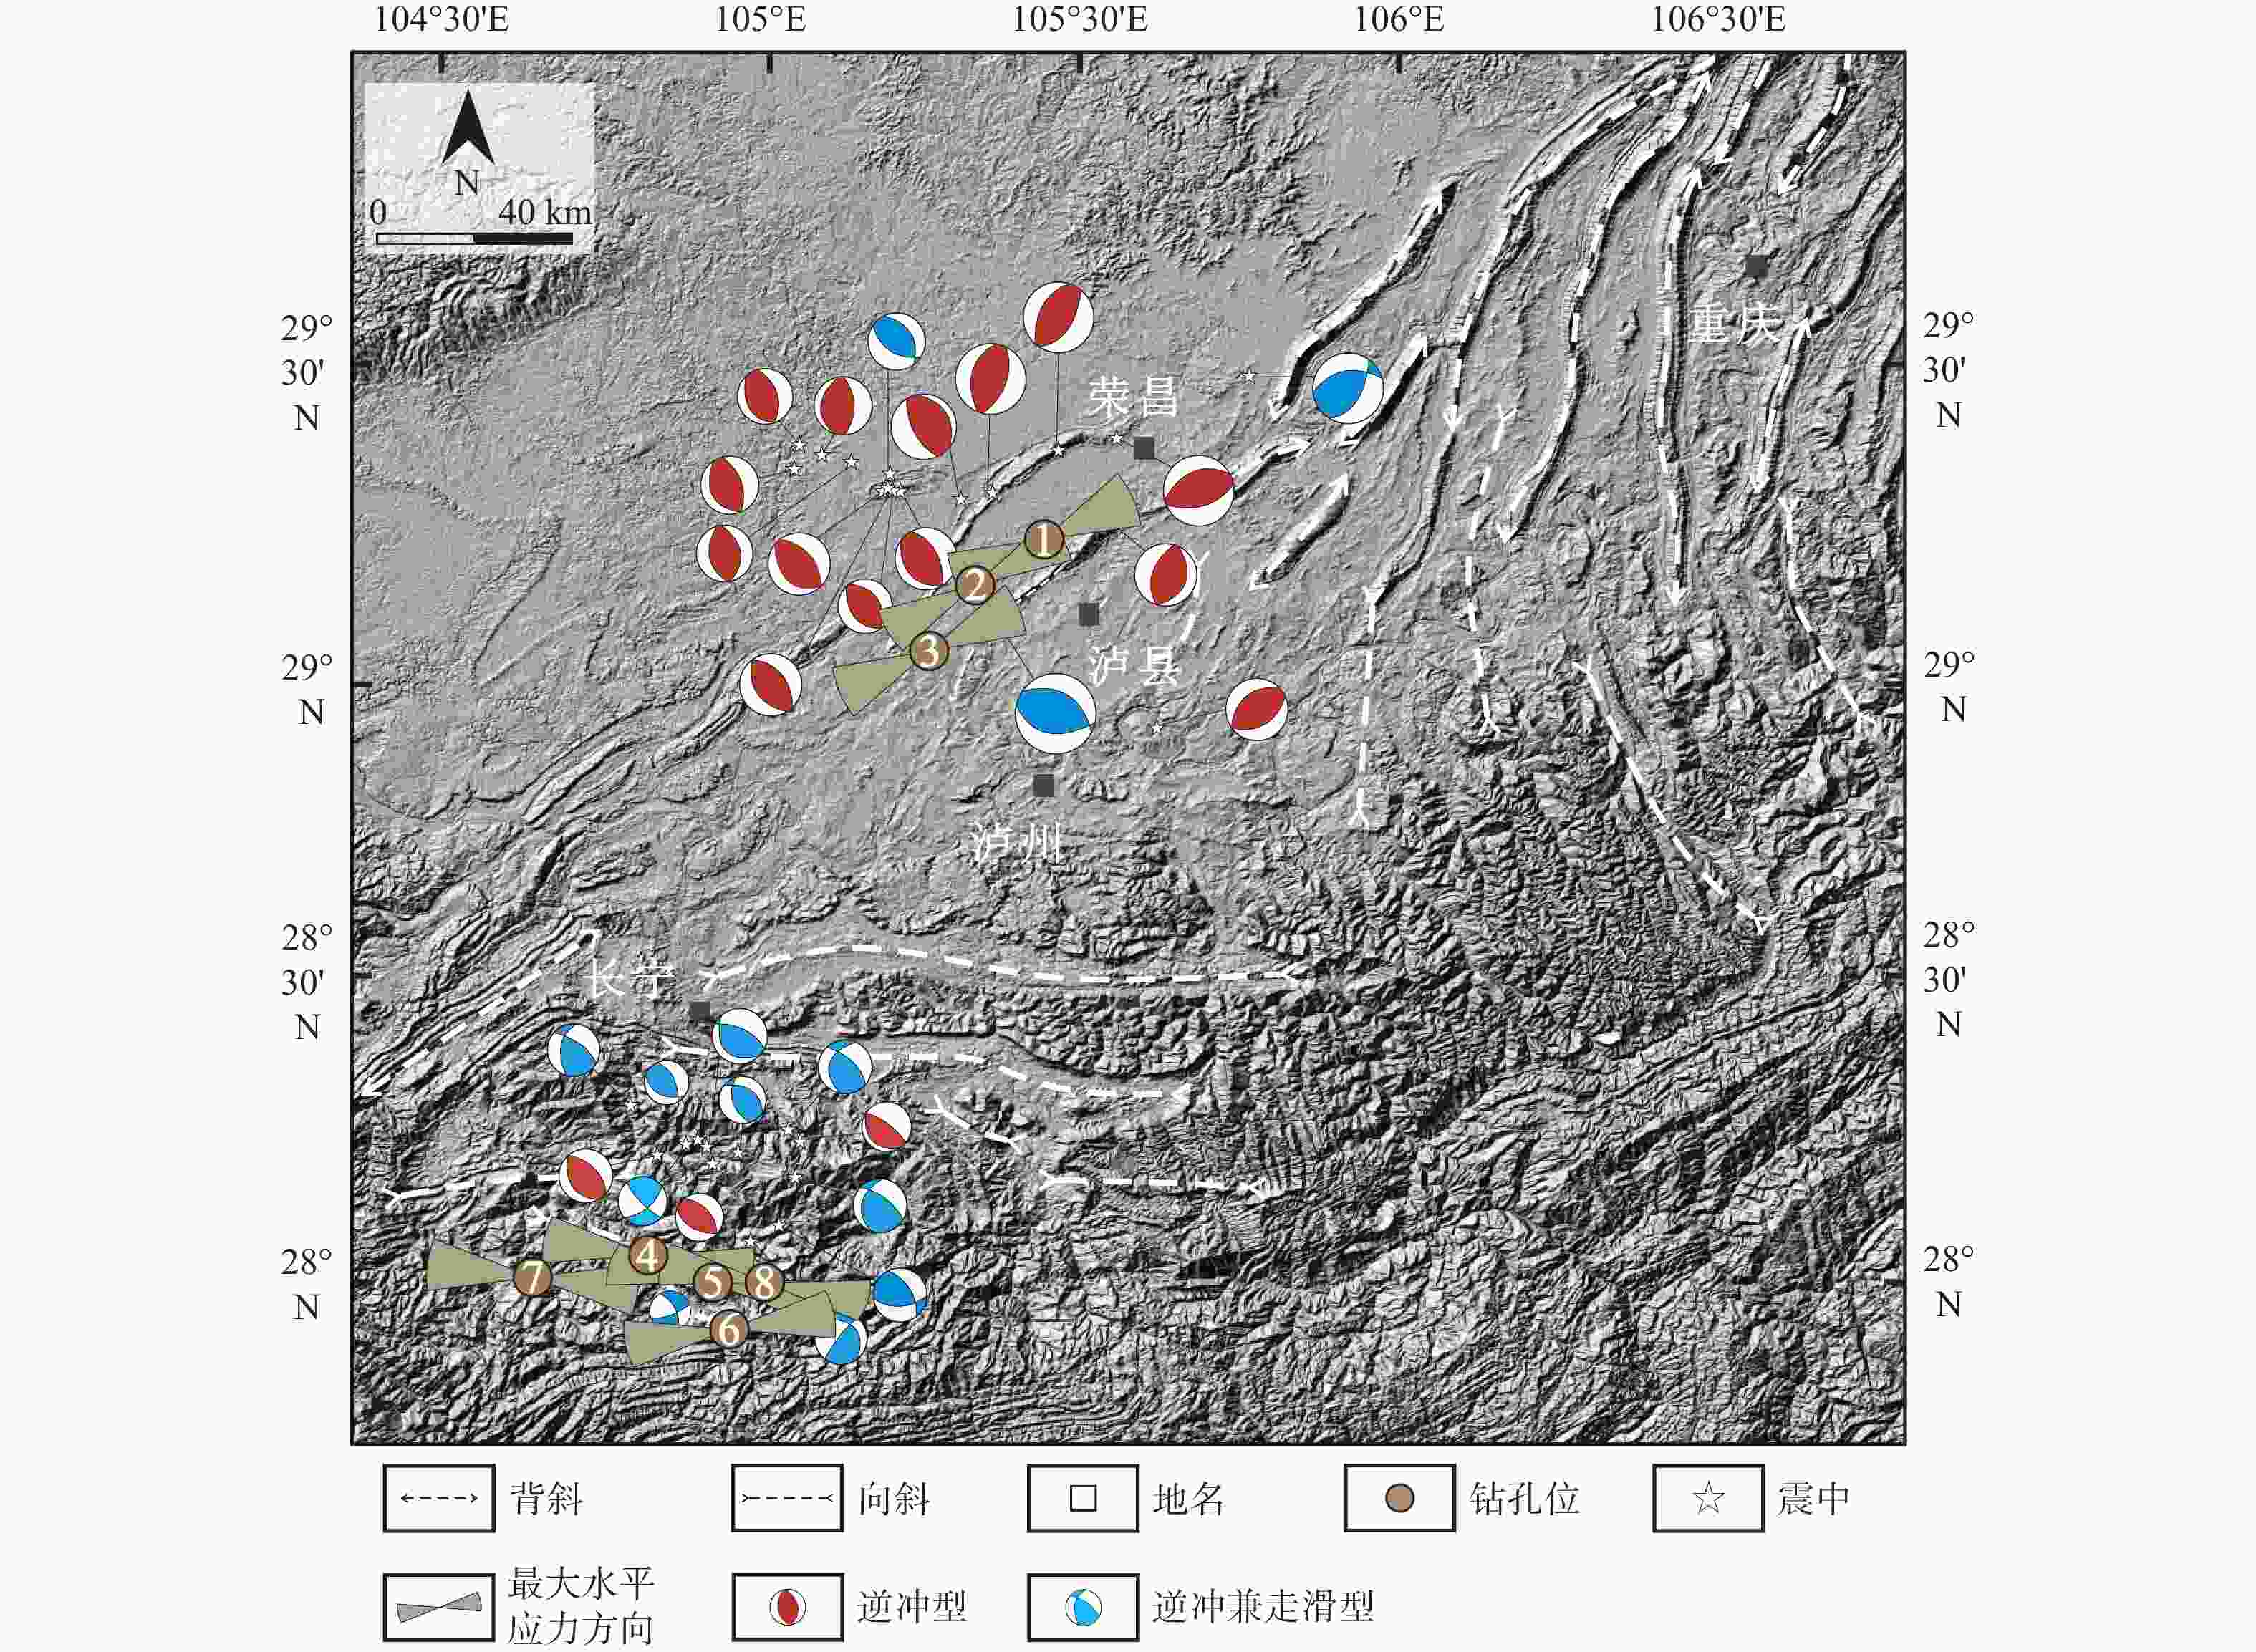
图 11 华蓥山南段浅缘地震的震源机制解(震源机制解数据来自易桂喜等, 2019;胡幸平等,2021;李翠平等,2022;李欣蔚等,2022)
Figure 11. Focal mechanism solution of the southern section of the Huayingshan fault zone (The focal mechanism data are from Yi et al., 2019; Hu et al., 2021; Li et al., 2022; Li et al., 2022)
表 1 四川盆地华蓥山断裂带南段中部地区钻孔测井成像数据分析的应力指标(质量等级以钻孔诱发张裂缝为评判标准)
Table 1. Stress index form analysis of image log data from the central part of the southern section of the Huayingshan fault zone in Sichuan Basin (The quality level was evaluated based on drilling-induced tensile fractures)
钻孔编号 总深度/m 选取段/m 诱发张裂缝/条 崩落/段 DITF优势方位 BO优势方位 平均最大主应力方向 解释质量等级 L203H57-3 3343.6~3777.2 3607.2~3743.8 108 — 70°~80°/250°~260° — 75°/255° B L203H79-4 3621.3~3879.9 3706.0~3778.8 32 — 80°~90°/260°~270° — 70°/250° C L206 3570.0~4085.0 3705.0~3912.0 127 — 80°~90°/260°~270° — 77°/257° B 注:平均方位角和质量排名是根据世界应力图(Heidbach et al., 2018)统计得出;世界应力图质量分级系统分为A级—E级,A级数据质量表明最大水平主应力(SH)方向的精确度在15°以内,B级表示其精确度在15°~20°,C级表示其精确度在20°~25°,D级表示其精确度在25°~40°,E级表示数据不完整、不可靠或精确度>40°;DITF—钻孔诱发张裂缝;BO—钻孔崩落 Notes: The average azimuth and quality ranking were calculated using the world stress map (Heidbach et al., 2018);The world stress map divides the data quality into A to E levels;Level A indicates an SHmax accuracy within 15°; Level B indicates an SHmax accuracy of 15°—20°; Level C indicates an SHmax accuracy of 20°—25°; Level D indicates an SHmax accuracy of 25°—40°; Level E indicates incomplete, unreliable, or accurate data of >40°. DITF—drilling-induced tensile fractures; BO—borehole breakouts.  下载: 导出CSV
表 2 四川盆地华蓥山断裂带南段南部地区钻孔测井成像数据分析的应力指标(质量等级以钻孔诱发张裂缝为评判标准)
Table 2. Stress index form analysis of image log data from the southern part of the southern section of the Huayingshan fault zone in Sichuan Basin (The quality level was evaluated based on the drilling-induced tensile fractures)
钻孔编号 总深度/m 选取段/m 诱发张裂缝/条 崩落/段 DITF优势方位 BO优势方位 平均最大主应力方向 解释质量等级 N203 2314.5~2428.2 2351.6~2398.0 14 7 100°~110°/280°~290° 20°~30°/200°~210° 111°/291° C N213 2155.3~2617.1 2119~2190 — 3 — 10°~20°/190°~200° 112°/292° D N215 2133.9~2546.1 2134.2~2420.0 130 13 70°~80°/250°~260° 0°~10°/180°~190° 81°/261° B N217 2618.9~2984.9 2626.6~2866.0 307 8 100°~110°/280°~290° 20°~30°/200°~210° 97°/277° A N224 1925~2335 1957~2189 — 5 — 10°~20°/190°~200° 104°/284° C 注:平均方位角和质量排名是根据世界应力图(Heidbach et al.,2018)统计得出;世界应力图质量分级系统分为A级—E级,A级数据质量表明最大水平主应力(SH)方向的精确度在15°以内,B级表示其精确度在15°~20°,C级表示其精确度在20°~25°,D级表示其精确度在25°~40°,E级表示数据不完整、不可靠或精确度>40°;DITF—钻孔诱发张裂缝;BO—钻孔崩落 Notes: The average azimuth and quality ranking were calculated using the world stress map (Heidbach et al., 2018); The world stress map divides the data quality into A to E levels. Level A indicates an SHmax accuracy within 15°; Level B indicates an SHmax accuracy of 15°—20°; Level C indicates an SHmax accuracy of 20°—25°; Level D indicates an SHmax accuracy of 25°—40°; Level E indicates incomplete, unreliable, or accurate data of >40°; DITF—drilling-induced tensile fractures; BO—borehole breakouts.
下载: 导出CSV
-
[1] ARTYUSHKOV E V, 1973. Stresses in the lithosphere caused by crustal thickness inhomogeneities[J]. Journal of Geophysical Research, 78(32): 7675-7708. doi: 10.1029/JB078i032p07675 [2] BASHMAGH N M, LIN W R, MURATA S, et al., 2022. Magnitudes and orientations of present-day in-situ stresses in the Kurdistan region of Iraq: Insights into combined strike-slip and reverse faulting stress regimes[J]. Journal of Asian Earth Sciences, 239: 105398. doi: 10.1016/j.jseaes.2022.105398 [3] BASSETT D, ARNULF A, HENRYS S, et al., 2022. Crustal structure of the Hikurangi margin from SHIRE seismic data and the relationship between forearc structure and shallow megathrust slip behavior[J]. Geophysical Research Letters, 49(2): e2021GL096960. doi: 10.1029/2021GL096960 [4] BEHBOUDI E, MCNAMARA D D, LOKMER I, et al., 2022. Spatial variation of shallow stress orientation along the Hikurangi subduction margin: insights from in-situ borehole image logging[J]. Journal of Geophysical Research, 127(5): e2021JB023641. doi: 10.1029/2021JB023641 [5] BELL J S, GOUGH D I, 1979. Northeast-southwest compressive stress in Alberta evidence from oil wells[J]. Earth and Planetary Science Letters, 45(2): 475-482. doi: 10.1016/0012-821X(79)90146-8 [6] BROOKE-BARNETT S, FLOTTMANN T, PAUL P K, et al., 2015. Influence of basement structures on in situ stresses over the Surat Basin, southeast Queensland[J]. Journal of Geophysical Research: Solid Earth, 120(7): 4946-4965. doi: 10.1002/2015JB011964 [7] BRUDY M, ZOBACK M D, 1999. Drilling-induced tensile wall-fractures: implications for determination of in-situ stress orientation and magnitude[J]. International Journal of Rock Mechanics and Mining Sciences, 36(2): 191-215. doi: 10.1016/S0148-9062(98)00182-X [8] CHATTERJEE S, MUKHERJEE S, 2023. Review on drilling-induced fractures in drill cores[J]. Marine and Petroleum Geology, 151: 106089. doi: 10.1016/j.marpetgeo.2022.106089 [9] CHEN N, WANG C H, CHEN P Z, et al., 2021. Re-analyzing the in-situ stress field in the right bank of the Baihetan hydroelectric power plant using the borehole breakout data[J]. Journal of Geomechanics, 27(3): 430-440. (in Chinese with English abstract [10] CHENG G X, JIANG B, LI M, et al., 2021. Structural evolution of southern Sichuan Basin (South China) and its control effects on tectonic fracture distribution in Longmaxi shale[J]. Journal of Structural Geology, 153: 104465. doi: 10.1016/j.jsg.2021.104465 [11] DENG B, LIU S G, LIU S, et al., 2009. Restoration of exhumation thickness and its significance in Sichuan Basin, China[J]. Journal of Chengdu University of Technology (Science & Technology Edition), 36(6): 675-686. (in Chinese with English abstract [12] DENG K L, 1992. Formation and evolution of Sichuan basin and domains for oil and gas exploration[J]. Atural Gas Industry, 12(5): 7-12. (in Chinese with English abstract [13] ELO S, PIRTTIJÄRVI M, 2013. The effect of lateral density variations on the state of stress in the uppermost crust in Finland[J]. International Journal of Rock Mechanics and Mining Sciences, 63: 131-137. doi: 10.1016/j.ijrmms.2013.08.005 [14] FENG M, AN M J, WU Z H, et al., 2019. Focal mechanisms of earthquakes in Chongqing and geodynamical implications[J]. Acta Geoscientica Sinica, 40(2): 319-328. (in Chinese with English abstract [15] GAN W J, ZHANG P Z, SHEN Z K, et al., 2007. Present-day crustal motion within the Tibetan Plateau inferred from GPS measurements[J]. Journal of Geophysical Research: Solid Earth, 112(B8): B08416. [16] GAO Y, SHI Y T, CHEN A G, 2018. Crustal seismic anisotropy and compressive stress in the eastern margin of the Tibetan Plateau and the influence of the Ms8.0 Wenchuan earthquake[J]. Chinese Science Bulletin, 63(19): 1934-1948. (in Chinese with English abstract doi: 10.1360/N972018-00317 [17] Griffin A G,2019. Subsurface SHMAX determined from a borehole image log, onshore southern East Coast Basin, New Zealand[J]. New Zealand Journal of Geology and Geophysics,62(2):273-290 [18] GU Z D, WANG X, NUNNS A, et al., 2021. Structural styles and evolution of a thin-skinned fold-and-thrust belt with multiple detachments in the eastern Sichuan Basin, South China[J]. Journal of Structural Geology, 142: 104191. doi: 10.1016/j.jsg.2020.104191 [19] GUAN S W, LIANG H, JIANG H, et al., 2022. Characteristics and evolution of the main strike-slip fault belts of the central Sichuan Basin, southwestern China, and associated structures[J]. Earth Science Frontiers, 29(6): 252-264. (in Chinese with English abstract [20] HE D F, LU R Q, HUANG H Y, et al., 2019. Tectonic and geological background of the earthquake hazards in Changning shale gas development zone, Sichuan Basin, SW China[J]. Petroleum Exploration and Development, 46(5): 993-1006. (in Chinese with English abstract). [21] HEIDBACH O, RAJABI M, CUI X F, et al., 2018. The World Stress Map database release 2016: crustal stress pattern across scales[J]. Tectonophysics, 744: 484-498. doi: 10.1016/j.tecto.2018.07.007 [22] HU X P, ZANG A, HEIDBACH O, et al., 2017. Crustal stress pattern in China and its adjacent areas[J]. Journal of Asian Earth Sciences, 149: 20-28. doi: 10.1016/j.jseaes.2017.07.005 [23] HU X P, CUI X F, ZHANG G W, et al., 2021. Analysis on the mechanical causes of the complex seismicity in Changning area, China[J]. Chinese Journal of Geophysics, 64(1): 1-17. (in Chinese with English abstract [24] HUANG H Y, HE D F, LI Y Q, et al., 2019. Determination and formation mechanism of the Luzhou paleo-uplift in thesoutheastern Sichuan Basin[J]. Earth Science Frontiers, 26(1): 102-120. (in Chinese with English abstract [25] KANG H P, JIANG T M, ZHANG X, et al., 2009. Research on in-situ stress field in Jincheng mining area and its application[J]. Chinese Journal of Rock Mechanics and Engineering, 28(1): 1-8. (in Chinese with English abstract [26] KAPETANIDIS V, KASSARAS I, 2019. Contemporary crustal stress of the Greek region deduced from earthquake focal mechanisms[J]. Journal of Geodynamics, 123: 55-82. doi: 10.1016/j.jog.2018.11.004 [27] KRUSZEWSKI M, MONTEGROSSI G, PARISIO F, et al., 2022. Borehole observation-based in situ stress state estimation of the Los Humeros geothermal field (Mexico)[J]. Geomechanics for Energy and the Environment, 32: 100392. doi: 10.1016/j.gete.2022.100392 [28] LI C P, TANG M Y, GUO W Y, et al., 2022. A preliminary study on 3D velocity structure of Rongchang and its adjacent area[J]. Seismology and Geology, 44(1): 205-219. (in Chinese with English abstract [29] LI J, LIU C, LIU H M, et al., 2021. Distribution and influencing factors of in-situ stress in complex fault tectonic region[J]. Journal of China University of Mining & Technology, 50(1): 123-137. (in Chinese with English abstract [30] LI P W, CUI J W, WANG L J, et al., 2005. The determination of in-situ stress from wellbore breakouts in the main borehole of the Chinese Continental Scientific Drilling[J]. Acta Petrologica Sinica, 21(2): 421-426. (in Chinese with English abstract [31] LI X W, ZHANG G W, XIE Z J, et al., 2022. Seismogenic mechanism of the 2021 M6.0 Luxian earthquake and seismicity spatio-temporal characteristics around the source region[J]. Chinese Journal of Geophysics, 65(11): 4284-4298. (in Chinese with English abstract [32] LI Z Q, RAN L H, CHEN G S, et al., 2002. Genetic geologic model and gas-bearing analysis of high and steep structures in East Sichuan[J]. Journal of Chengdu University of Technology, 29(6): 605-609. (in Chinese with English abstract [33] LIN H, KANG W H, OH J, et al., 2020. Numerical simulation on borehole breakout and borehole size effect using discrete element method[J]. International Journal of Mining Science and Technology, 30(5): 623-633. doi: 10.1016/j.ijmst.2020.05.019 [34] LIU H M, XIE Z J, LI H, et al. , 2022. Source properties and characteristics of tectonic stress field before the September 16, 2021, Luxian MS6.0 earthquake in the Sichuan Basin[J]. Journal of Geodesy and Geodynamics, 42(11): 1138-1142, 1155. (in Chinese with English abstract [35] LIU Z C, LYU X R, LI Y K, et al., 2016. Mechanism of faults acting on in-situ stress field direction[J]. Oil & Gas Geology, 37(3): 387-393. (in Chinese with English abstract [36] LJUNGGREN C, CHANG Y T, JANSON T, et al., 2003. An overview of rock stress measurement methods[J]. International Journal of Rock Mechanics and Mining Sciences, 40(7-8): 975-989. doi: 10.1016/j.ijrmms.2003.07.003 [37] MANDAL P, 1999. Intraplate stress distribution induced by topography and crustal density heterogeneities beneath the south Indian shield, India[J]. Tectonophysics, 302(1-2): 159-172. doi: 10.1016/S0040-1951(98)00282-0 [38] MATIAS C, JOHN B, JOSE C, et al., 2021. Crustal folds alter local stress fields as demonstrated by magma sheet - Fold interactions in the Central Andes[J]. Earth and Planetary Science Letters, 570: 117080. doi: 10.1016/j.jpgl.2021.117080 [39] MEI L F, LIU Z Q, TANG J G, et al., 2010. Mesozoic intra-continental progressive deformation in western Hunan-Hubei-Eastern Sichuan Provinces of China: evidence from apatite fission track and balanced cross-section[J]. Earth Science-Journal of China University of Geosciences, 35(2): 161-174. (in Chinese with English abstract doi: 10.3799/dqkx.2010.017 [40] NELSON E J, MEYER J J, HILLIS R R, et al., 2005. Transverse drilling-induced tensile fractures in the West Tuna area, Gippsland Basin, Australia: implications for the in situ stress regime[J]. International Journal of Rock Mechanics and Mining Sciences, 42(3): 361-371. doi: 10.1016/j.ijrmms.2004.12.001 [41] NIAN T, WANG G W, XIAO C W, et al., 2016. The in situ stress determination from borehole image logs in the Kuqa Depression[J]. Journal of Natural Gas Science and Engineering, 34: 1077-1084. doi: 10.1016/j.jngse.2016.08.005 [42] NOURI A, RAHIMI B, VAVRYČUK V, et al., 2023. Spatially varying crustal stress along the Zagros seismic belt inferred from earthquake focal mechanisms[J]. Tectonophysics, 846: 229653. doi: 10.1016/j.tecto.2022.229653 [43] OLIVA S J, EBINGER C J, RIVALTA E, et al., 2022. State of stress and stress rotations: quantifying the role of surface topography and subsurface density contrasts in magmatic rift zones (Eastern Rift, Africa)[J]. Earth and Planetary Science Letters, 584: 117478. doi: 10.1016/j.jpgl.2022.117478 [44] QIN Z P, LIU S G, DENG B, et al., 2013. Multiphase structural features and evolution of Southeast Sichuan tectonic belt in China[J]. Journal of Chengdu University of Technology (Science & Technology Edition), 40(6): 703-711. (in Chinese with English abstract [45] RAJABI M, TINGAY M, KING R, et al., 2017. Present-day stress orientation in the Clarence-Moreton Basin of New South Wales, Australia: a new high density dataset reveals local stress rotations[J]. Basin Research, 29(S1): 622-640. doi: 10.1111/bre.12175 [46] SONG H B, LUO Z L, 1995. The study of the basement and deep geological structures of Sichuan basin, China[J]. Earth Science Frontiers, 2(3-4): 231-237. (in Chinese with English abstract [47] STRICKER K, SCHIMSCHAL S, MÜLLER B, et al., 2023. Importance of drilling-related processes on the origin of borehole breakouts-Insights from LWD observations[J]. Geomechanics for Energy and the Environment, 34: 100463. doi: 10.1016/j.gete.2023.100463 [48] TAN C X, SUN W F, SUN Y, et al.,2006. A consideration on in-situ crustal stress measuring and its underground engineering application[J]. Acta Geologica Sinica,80(10):1627-1632. (in Chinese with English abstract [49] TANG S L, YAN D P, WANG C L, et al.,2011. Deformational Process from Thick-skinned to Thin-skinned Thrust in Xuefeng Mountain, South China: Evidence from Sangzhi-Anhua Tectonic Section[J]. Geoscience,25(1):22-30. (in Chinese with English abstract [50] TREŠL J, 1992. Stress field in the lithosphere caused by terrain topography and crustal density inhomogeneities[J]. Physics of the Earth and Planetary Interiors, 69(3-4): 294-298. doi: 10.1016/0031-9201(92)90148-O [51] WANG C H, 2014. Brief review and outlook of main estimate and measurement methods for in-situ stresses in rock mass[J]. Geological Review, 60(5): 971-996. (in Chinese with English abstract [52] WANG X, JIANG W L, ZHANG J F, et al., 2022. Gravity anomaly and fine crustal structure in the middle segment of the Tan-Lu fault zone, eastern Chinese mainland[J]. Journal of Asian Earth Sciences, 224: 105027. doi: 10.1016/j.jseaes.2021.105027 [53] WANG X L, MA S L, LIE X L, 2011. Monitoring of injection-induced seismicity at Rongchang, Chongqing[J]. Seismology and Geology, 33(1): 151-156. (in Chinese with English abstract [54] WANG Z J, WANG H C, DONG D, et al. , 2018. Review of geophysical results of Huayingshan fault zone[J]. Earthquake Research in Sichuan(3): 6-12. (in Chinese with English abstract [55] WU X H, 2017. Application to in-situ stress evaluation based on cross-dipole logging data in southeast Sichuan block[D]. Qingdao: China University of Petroleum. (in Chinese with English abstract [56] XIE F R, CUI X F, ZHAO J T, et al., 2004. Regional division of the recent tectonic stress field in China and adjacent areas[J]. Chinese Journal of Geophysics, 47(4): 654-662. (in Chinese with English abstract [57] XIONG X S, GAO R, ZHANG J S, et al., 2015. Differences of structure in mid-lower crust between the eastern and western blocks of the Sichuan basin[J]. Chinese Journal of Geophysics, 58(7): 2413-2423. (in Chinese with English abstract [58] XU S R, XU J H, 1986. The new results of seismic exploration in Huayingshan fault zone[J]. Acta Petrolei Sinica, 7(3): 39-48. (in Chinese with English abstract [59] YANG X, LI Y H, GE Z X, et al., 2022. Upper crustal anisotropy in the Southeastern Sichuan Basin, China from shear-wave splitting measurements[J]. Tectonophysics, 837: 229431. doi: 10.1016/j.tecto.2022.229431 [60] YI G X, LONG F, LIANG M J, et al., 2019. Focal mechanism solutions and seismogenic structure of the 17 June 2019 Ms6.0 Sichuan Changning earthquake sequence[J]. Chinese Journal of Geophysics, 62(09): 3432-3447. (in Chinese with English abstract [61] YI G X, ZHAO M, LONG F, et al., 2020. Geometry and tectonic deformation of seismogenic structures in the Rongxian-Weiyuan-Zizhong region, Sichuan Basin: insights from focalmechanism solutions[J]. Chinese Journal of Geophysics, 63(09): 3275-3291. (in Chinese with English abstract [62] YU J S, TAN K, ZHANG C H, et al., 2019. Present-day crustal movement of the Chinese mainland based on Global Navigation Satellite System data from 1998 to 2018[J]. Advances in Space Research, 63(2): 840-856. doi: 10.1016/j.asr.2018.10.001 [63] ZHANG A, STEPHANSSON O, 2010. Crustal stress models[M]//ZANG A, STEPHANSSON O. Stress field of the earth’s crust. Dordrecht: Springer. [64] ZHANG Y Q, DONG S W, LI J H, et al., 2011. Mesozoic multi-directional compressional tectonics and formation-reformation of Sichuan basin[J]. Geology in China, 38(2): 233-250. (in Chinese with English abstract [65] ZHANG Y Q, 2020. Seismogenic structures of the south Sichuan basin seismic zone and its neotectonic setting[J]. Acta Geologica Sinica, 94(11): 3161-3177. (in Chinese with English abstract). [66] ZHAO B, GAO Y, HUANG Z B, et al., 2013. Double difference relocation, focal mechanism and stress inversion of Lushan MS7.0 earthquake sequence[J]. Chinese Journal of Geophysics, 56(10): 3385-3395. (in Chinese with English abstract [67] ZHAO C J, 1984. On the characteristics, types and mechanism of vertical structural variations in Sichuan basin[J]. Acta Petrolei Sinica, 5(2): 11-21. (in Chinese with English abstract [68] ZHU H C, TAO Z Y, 1994. A preliminary analysis on ground stress vs and topography morphology[J]. Water Resources and Hydropower Engineering(1): 29-34. (in Chinese with English abstract [69] ZHU H, HE C, 2014. Focal mechanism changing character of earthquake sequence induced by water injection: a case study of Changning Sequence, Sichuan Province[J]. Earth Science-Journal of China University of Geosciences, 39(12): 1776-1782. (in Chinese with English abstract doi: 10.3799/dqkx.2014.161 [70] ZOBACK M D, BARTON C A, BRUDY M, et al., 2003. Determination of stress orientation and magnitude in deep wells[J]. International Journal of Rock Mechanics and Mining Sciences, 40(7-8): 1049-1076. doi: 10.1016/j.ijrmms.2003.07.001 [71] 陈念,王成虎,陈平志,等,2021. 利用钻孔崩落数据再认识白鹤滩右岸地应力场特征[J]. 地质力学学报,27(3):430-440. doi: 10.12090/j.issn.1006-6616.2021.27.03.039 [72] 邓宾,刘树根,刘顺,等,2009. 四川盆地地表剥蚀量恢复及其意义[J]. 成都理工大学学报(自然科学版),36(6):675-686. doi: 10.3969/j.issn.1671-9727.2009.06.013 [73] 邓康龄,1992. 四川盆地形成演化与油气勘探领域[J]. 天然气工业,12(5):7-12. [74] 冯梅,安美建,吴中海,等,2019. 重庆地区地震震源机制解及动力环境分析[J]. 地球学报,40(2):319-328. doi: 10.3975/cagsb.2018.070201 [75] 高原,石玉涛,陈安国,2018. 青藏高原东缘地震各向异性、应力及汶川地震影响[J]. 科学通报,63(19):1934-1948. [76] 管树巍,梁瀚,姜华,等,2022. 四川盆地中部主干走滑断裂带及伴生构造特征与演化[J]. 地学前缘,29(6):252-264. [77] 何登发,鲁人齐,黄涵宇,等,2019. 长宁页岩气开发区地震的构造地质背景[J]. 石油勘探与开发,46(5):993-1006. doi: 10.11698/PED.2019.05.19 [78] 胡幸平,崔效锋,张广伟,等,2021. 长宁地区复杂地震活动的力学成因分析[J]. 地球物理学报,64(1):1-17. doi: 10.6038/cjg2021O0232 [79] 黄涵宇,何登发,李英强,等,2019. 四川盆地东南部泸州古隆起的厘定及其成因机制[J]. 地学前缘,26(1):102-120. [80] 康红普,姜铁明,张晓,等,2009. 晋城矿区地应力场研究及应用[J]. 岩石力学与工程学报,28(1):1-8. doi: 10.3321/j.issn:1000-6915.2009.01.001 [81] 李翠平,唐茂云,郭卫英,等,2022. 荣昌及周边三维速度结构初步研究[J]. 地震地质,44(1):205-219. doi: 10.3969/j.issn.0253-4967.2022.01.013 [82] 李静,刘晨,刘惠民,等,2021. 复杂断层构造区地应力分布规律及其影响因素[J]. 中国矿业大学学报,50(1):123-137. [83] 李朋武,崔军文,王连捷,等,2005. 中国大陆科学钻探主孔钻孔崩落与现场应力状态的确定[J]. 岩石学报,21(2):421-426. doi: 10.3321/j.issn:1000-0569.2005.02.016 [84] 李欣蔚,张广伟,谢卓娟,等,2022. 2021年四川泸县M6.0地震发震机理及地震活动时空演化特征[J]. 地球物理学报,65(11):4284-4298. doi: 10.6038/cjg2022Q0045 [85] 李忠权,冉隆辉,陈更生,等,2002. 川东高陡构造成因地质模式与含气性分析[J]. 成都理工学院学报,29(6):605-609. [86] 刘慧敏,谢祖军,李赫,等,2022. 2021年四川泸县MS6.0地震震源性质及震前区域应力场特征[J]. 大地测量与地球动力学,42(11):1138-1142,1155. [87] 刘中春,吕心瑞,李玉坤,等,2016. 断层对地应力场方向的影响机理[J]. 石油与天然气地质,37(3):387-393. doi: 10.11743/ogg20160311 [88] 梅廉夫,刘昭茜,汤济广,等,2010. 湘鄂西-川东中生代陆内递进扩展变形:来自裂变径迹和平衡剖面的证据[J]. 地球科学-中国地质大学学报,35(2):161-174. [89] 覃作鹏,刘树根,邓宾,等,2013. 川东南构造带中新生代多期构造特征及演化[J]. 成都理工大学学报(自然科学版),40(6):703-711. [90] 宋鸿彪,罗志立,1995. 四川盆地基底及深部地质结构研究的进展[J]. 地学前缘,2(3-4):231-237. [91] 谭成轩,孙炜锋,孙叶,等,2006. 地应力测量及其地下工程应用的思考[J]. 地质学报,80(10):1627-1632. doi: 10.3321/j.issn:0001-5717.2006.10.018 [92] 汤双立,颜丹平,汪昌亮,等,2011. 华南雪峰山薄皮-厚皮构造转换过程:来自桑植—安化剖面的证据[J]. 现代地质,25(01):22-30. doi: 10.3969/j.issn.1000-8527.2011.01.003 [93] 王成虎,2014. 地应力主要测试和估算方法回顾与展望[J]. 地质论评,60(5):971-996. [94] 王小龙,马胜利,雷兴林,等,2011. 重庆荣昌地区注水诱发地震加密观测[J]. 地震地质,33(1):151-156. doi: 10.3969/j.issn.0253-4967.2011.01.015 [95] 王赞军,王宏超,董娣,等,2018. 华蓥山断裂带的物探成果综述[J]. 四川地震(3):6-12. [96] 武小何,2017. 正交偶极测井资料在川东南区块地应力评价中的应用研究[D]. 青岛:中国石油大学(华东). [97] 谢富仁,崔效锋,赵建涛,等,2004. 中国大陆及邻区现代构造应力场分区[J]. 地球物理学报,47(4):654-662. doi: 10.3321/j.issn:0001-5733.2004.04.016 [98] 熊小松,高锐,张季生,等,2015. 四川盆地东西陆块中下地壳结构存在差异[J]. 地球物理学报,58(7):2413-2423. doi: 10.6038/cjg20150718 [99] 徐世荣,徐锦华,1986. 华蓥山断裂带地震勘探新成果[J]. 石油学报,7(3):39-48. doi: 10.7623/syxb198603006 [100] 易桂喜,龙锋,梁明剑,等,2019. 2019年6月17日四川长宁M_S6.0地震序列震源机制解与发震构造分析[J]. 地球物理学报,62(09):3432-3447. [101] 易桂喜,赵敏,龙锋,等,2020. 四川盆地荣县—威远—资中地区发震构造几何结构与构造变形特征:基于震源机制解的认识和启示[J]. 地球物理学报,63(09):3275-3291. [102] 张岳桥,董树文,李建华,等,2011. 中生代多向挤压构造作用与四川盆地的形成和改造[J]. 中国地质,38(2):233-250. doi: 10.3969/j.issn.1000-3657.2011.02.001 [103] 张岳桥,2020. 四川盆地南部地震区发震构造及其新构造背景[J]. 地质学报,94(11):3161-3177. doi: 10.3969/j.issn.0001-5717.2020.11.001 [104] 赵博,高原,黄志斌,等,2013. 四川芦山MS7.0地震余震序列双差定位、震源机制及应力场反演[J]. 地球物理学报,56(10):3385-3395. doi: 10.6038/cjg20131014 [105] 赵从俊,1984. 四川盆地构造垂向变异特征类型及其机理探讨[J]. 石油学报,5(2):11-21. doi: 10.7623/syxb198402003 [106] 朱航,何畅,2014. 注水诱发地震序列的震源机制变化特征:以四川长宁序列为例[J]. 地球科学-中国地质大学学报,39(12):1776-1782. [107] 朱焕春,陶振宇,1994. 地形地貌与地应力分布的初步分析[J]. 水利水电技术(1):29-34. -

 下载:
下载:


计量
- 文章访问数: 1928
- HTML全文浏览量: 385
- PDF下载量: 154
- 被引次数: 0
