

Debris flow hazard analysis before and after improvement of Hanjia gully control engineering at the source area of the Fujiang River
-
摘要: 为了降低涪江源区左岸韩家沟泥石流的危害,文章采用遥感解译、野外调查、FLO-2D数值模拟等手段,查清了韩家沟泥石流特征及其防治现状,认为现有防治工程不能满足防灾需求,并据此提出改进的防治工程,对不同降雨频率下防治工程改进前后的泥石流危险性进行了研究,并分析改进防治工程的有效性。结果表明:韩家沟位于“8·8”九寨沟地震扰动区,震后泥石流物源丰富,导致每逢强降雨时泥石流频发。在10年一遇降雨频率下,丰河村及平松路均处于低危险区,现有防治工程可有效防治泥石流灾害;在50年一遇降雨频率下,丰河村处于泥石流高危险区,泥石流冲出排导槽,冲毁平松路,现有防治工程不能满足要求。采用多级拦挡坝、排导槽截弯取直等改进的防治工程后,可有效预防泥石流对沟口下方承灾体的损害,泥石流堆积方量减少50.2%,堆积面积减少86%,高危险区均位于排导槽内,治理效果显著。Abstract:
Objective Debris flow from the Hanjia gully develops on the left bank of the source area of the Fujiang River, Fenghe Village, Xiaohe Town, Songpan County, China. In recent years, debris flows have occurred frequently, and the largest debris flow occurred in August 2022, which seriously threatened the lives and properties of villagers in the Hanjia gully. Existing prevention and control engineering methods have decreased in effectiveness or even become ineffective. Currently, researchers have set a variety of extreme rainfall conditions and used FLO-2D to analyze the hazards of debris flow, based on which the governance effect of debris flow prevention and control engineering can be evaluated. However, there are few reports on how to improve the prevention and control engineering and evaluate the effect of the improved prevention and control engineering when the existing prevention and control engineering is ineffective. Methods To reduce damage to the Hanjia gully, the characteristics as well as prevention and control status of the debris flow in/from this gully were determined using remote sensing interpretation, field investigation, and FLO-2D numerical simulation; subsequently, improved prevention and control engineering was proposed. The hazard of debris flow before and after the improvements in prevention and control engineering under different rainfall frequencies were studied to analyze the effectiveness of the improved prevention and control engineering. Results The results show that the Hanjia gully is located in the "8.8" Jiuzhaigou earthquake disturbance area, the static reserves of post-earthquake landslides and collapses are about 49.79 × 10⁴ m3, and the debris flow sources are abundant, which leads to frequent debris flow during heavy rainfall. The high-hazard area is concentrated in the No. 1 retaining dam, and Fenghe Village and Pingsong Highway are in the low-hazard area under a rainfall event occurring every 10 years, and the existing prevention and control engineering can effectively prevent the debris flow disaster. Under a rainfall event occurring once in 50 years, Fenghe Village is in the high-hazard area of debris flow. The debris flow rushes out of the drainage channel and destroys the Pingsong Highway. The maximum mud depth in the accumulation area increases from 1.41 m to 3.14 m, the maximum velocity increases from 2.4 m/s to 3.65 m/s, and the accumulation area increases from 0.28 × 10⁴ m2 to 5.41 × 10⁴ m2. However, the existing prevention and control engineering methods cannot meet these requirements. After adopting improved prevention and control engineering, such as multistage retaining dams and cutting and straightening of drainage channels, the flow velocity of the debris flow in front of the two additional retaining dams becomes lower than that before the improvement, and the depth of mud in front of the additional retaining dams becomes higher than that before the improvement. The maximum velocity of the debris flow within 100 m of Dam No. 3 decreases by 29%, and the maximum mud depth increases by 413%. The maximum flow velocity in the first 100 m of Dam No. 2 decreases by 21%, the maximum mud depth increases by 175%, the maximum mud depth in the accumulation area is 3.9 m, and the maximum flow velocity is 3.4 m/s. The accumulation volume of debris flows is reduced by 50.2%, and the accumulation area is reduced by 86%. Conclusion Improved prevention and control engineering can effectively reduce the solid mass of debris flows and guide debris flow to discharge along drainage channels. The high-hazard area of the debris flow is concentrated in the drainage channel, and the control effect of the debris flow is remarkable. Significance The research results provide a scientific method for evaluating the effectiveness of debris-flow control engineering improvements and offer technical support for local debris-flow early warning systems. -
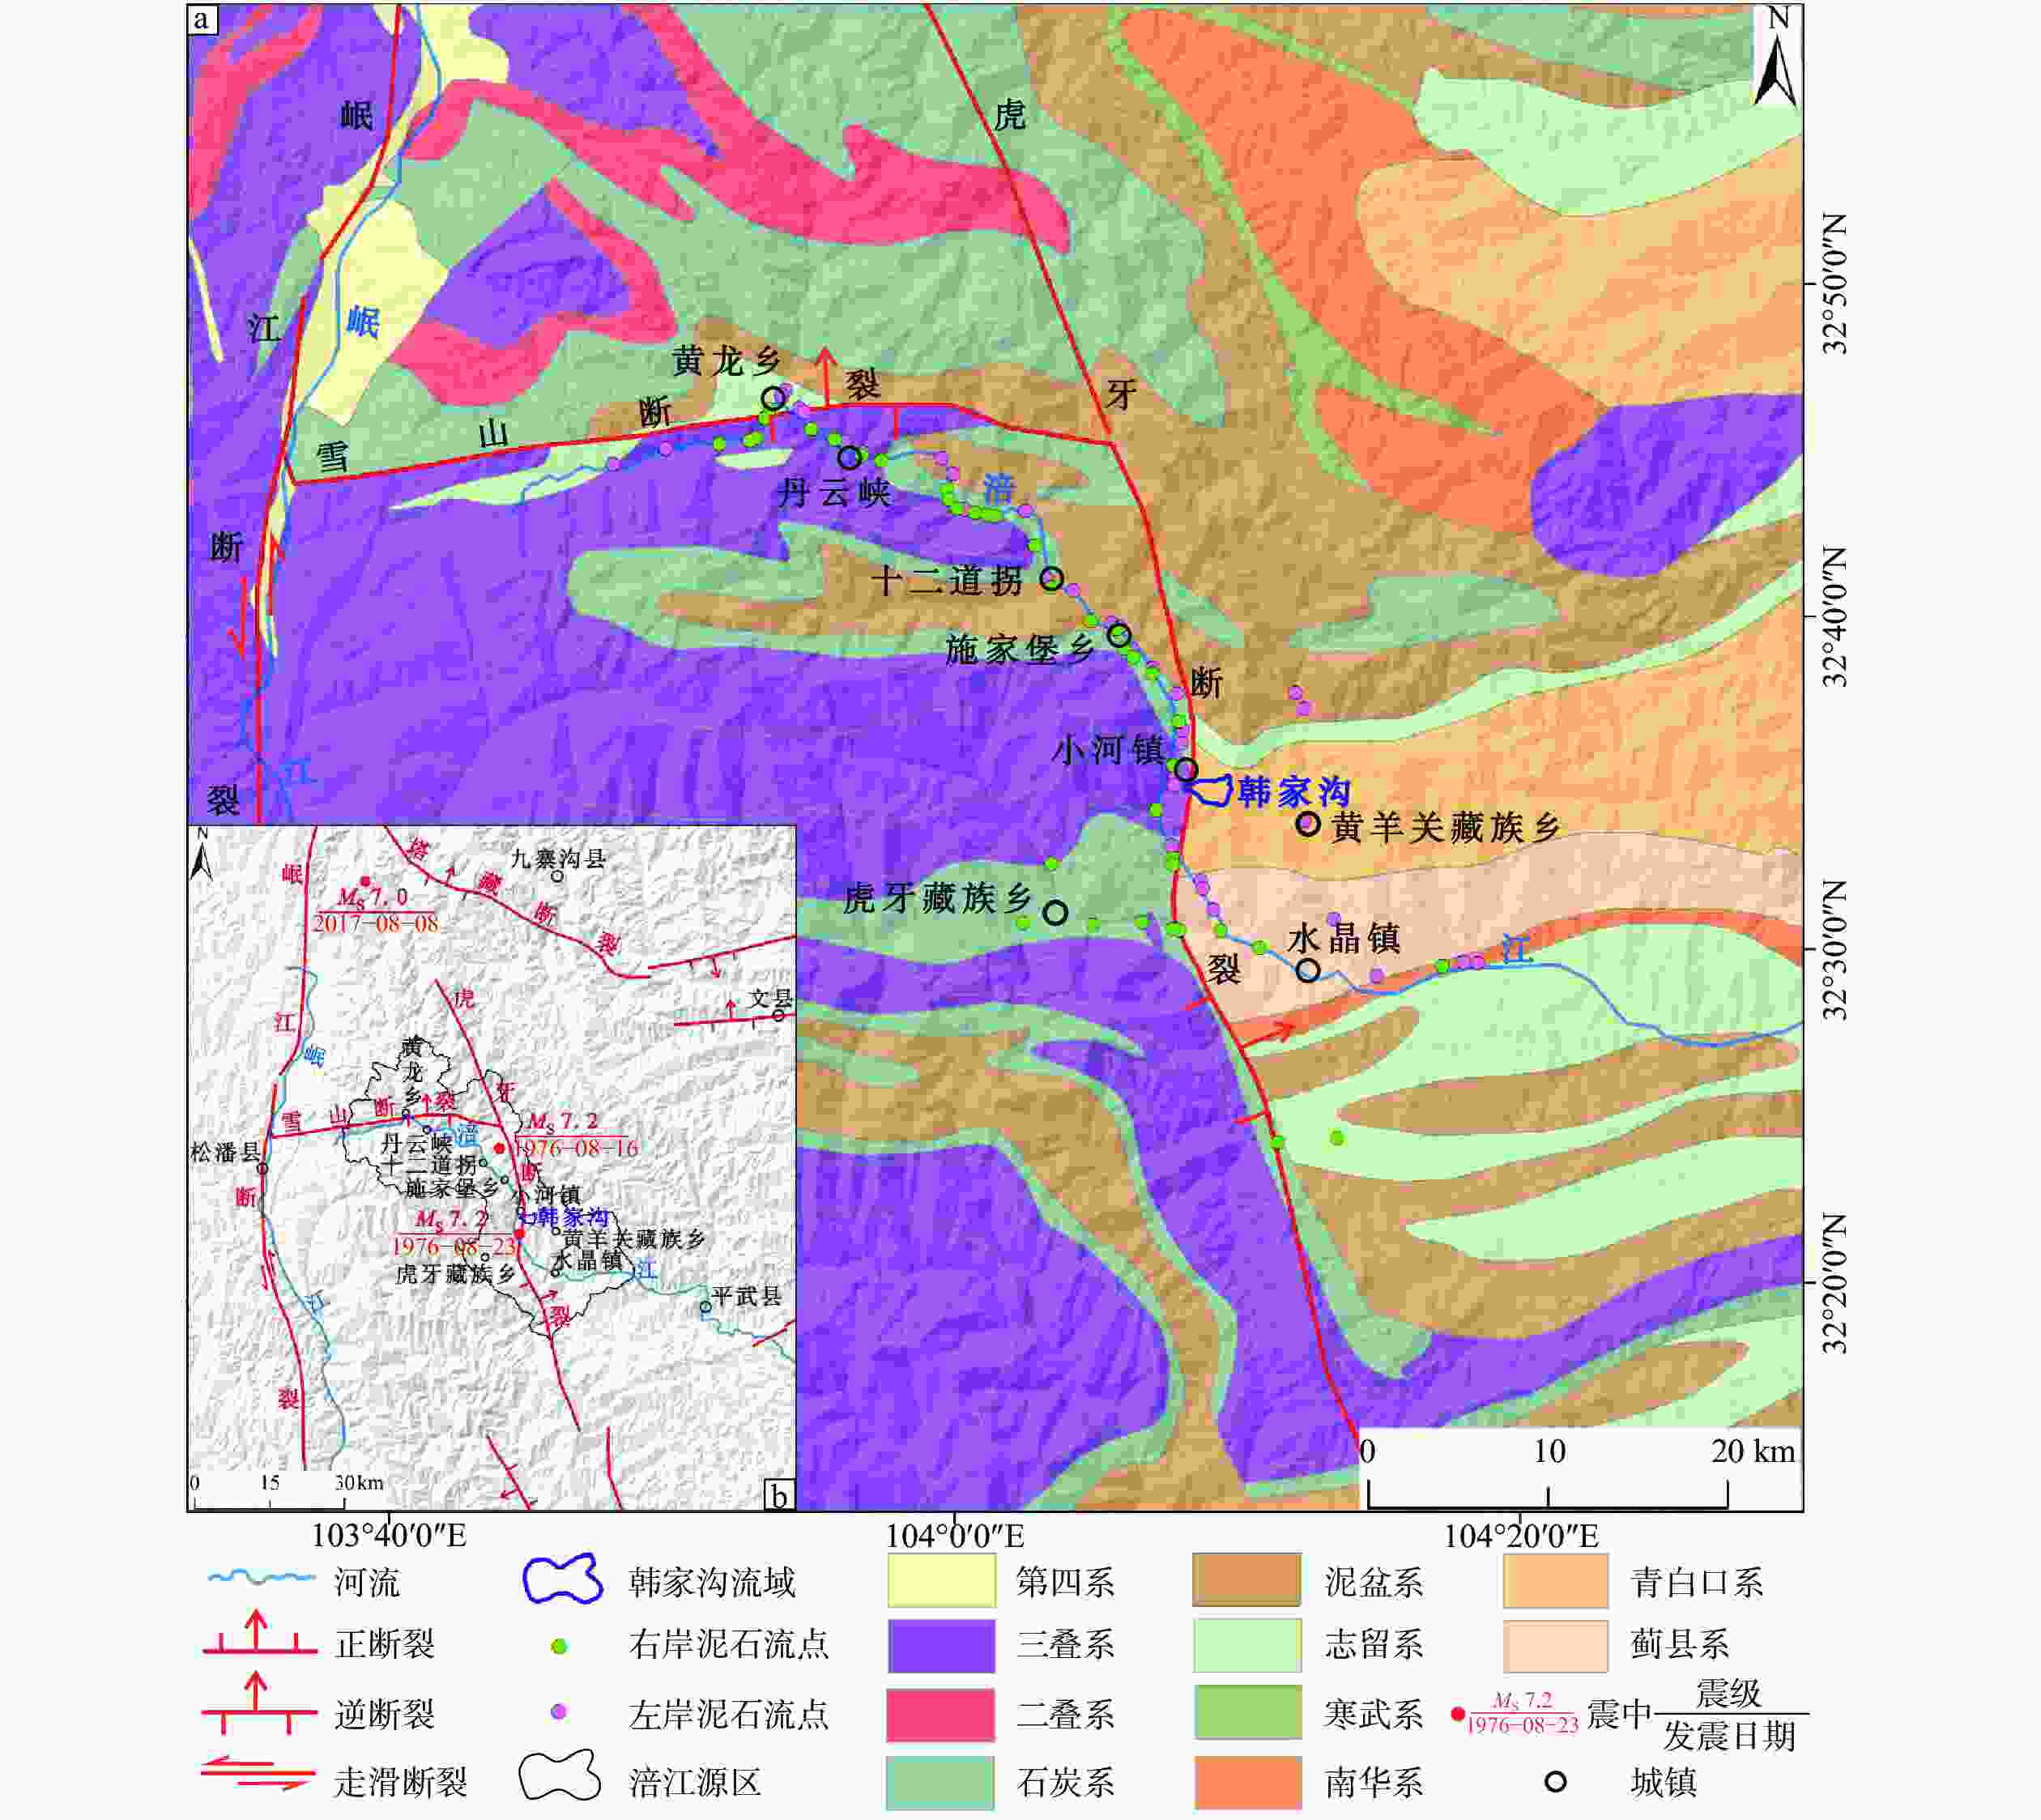
图 1 涪江源区地质略图
a—区域地质图;b—活动构造分布图
Figure 1. Geological sketch of the source area of the Fujiang River
(a) Regional geological map; (b) Active structure distribution map
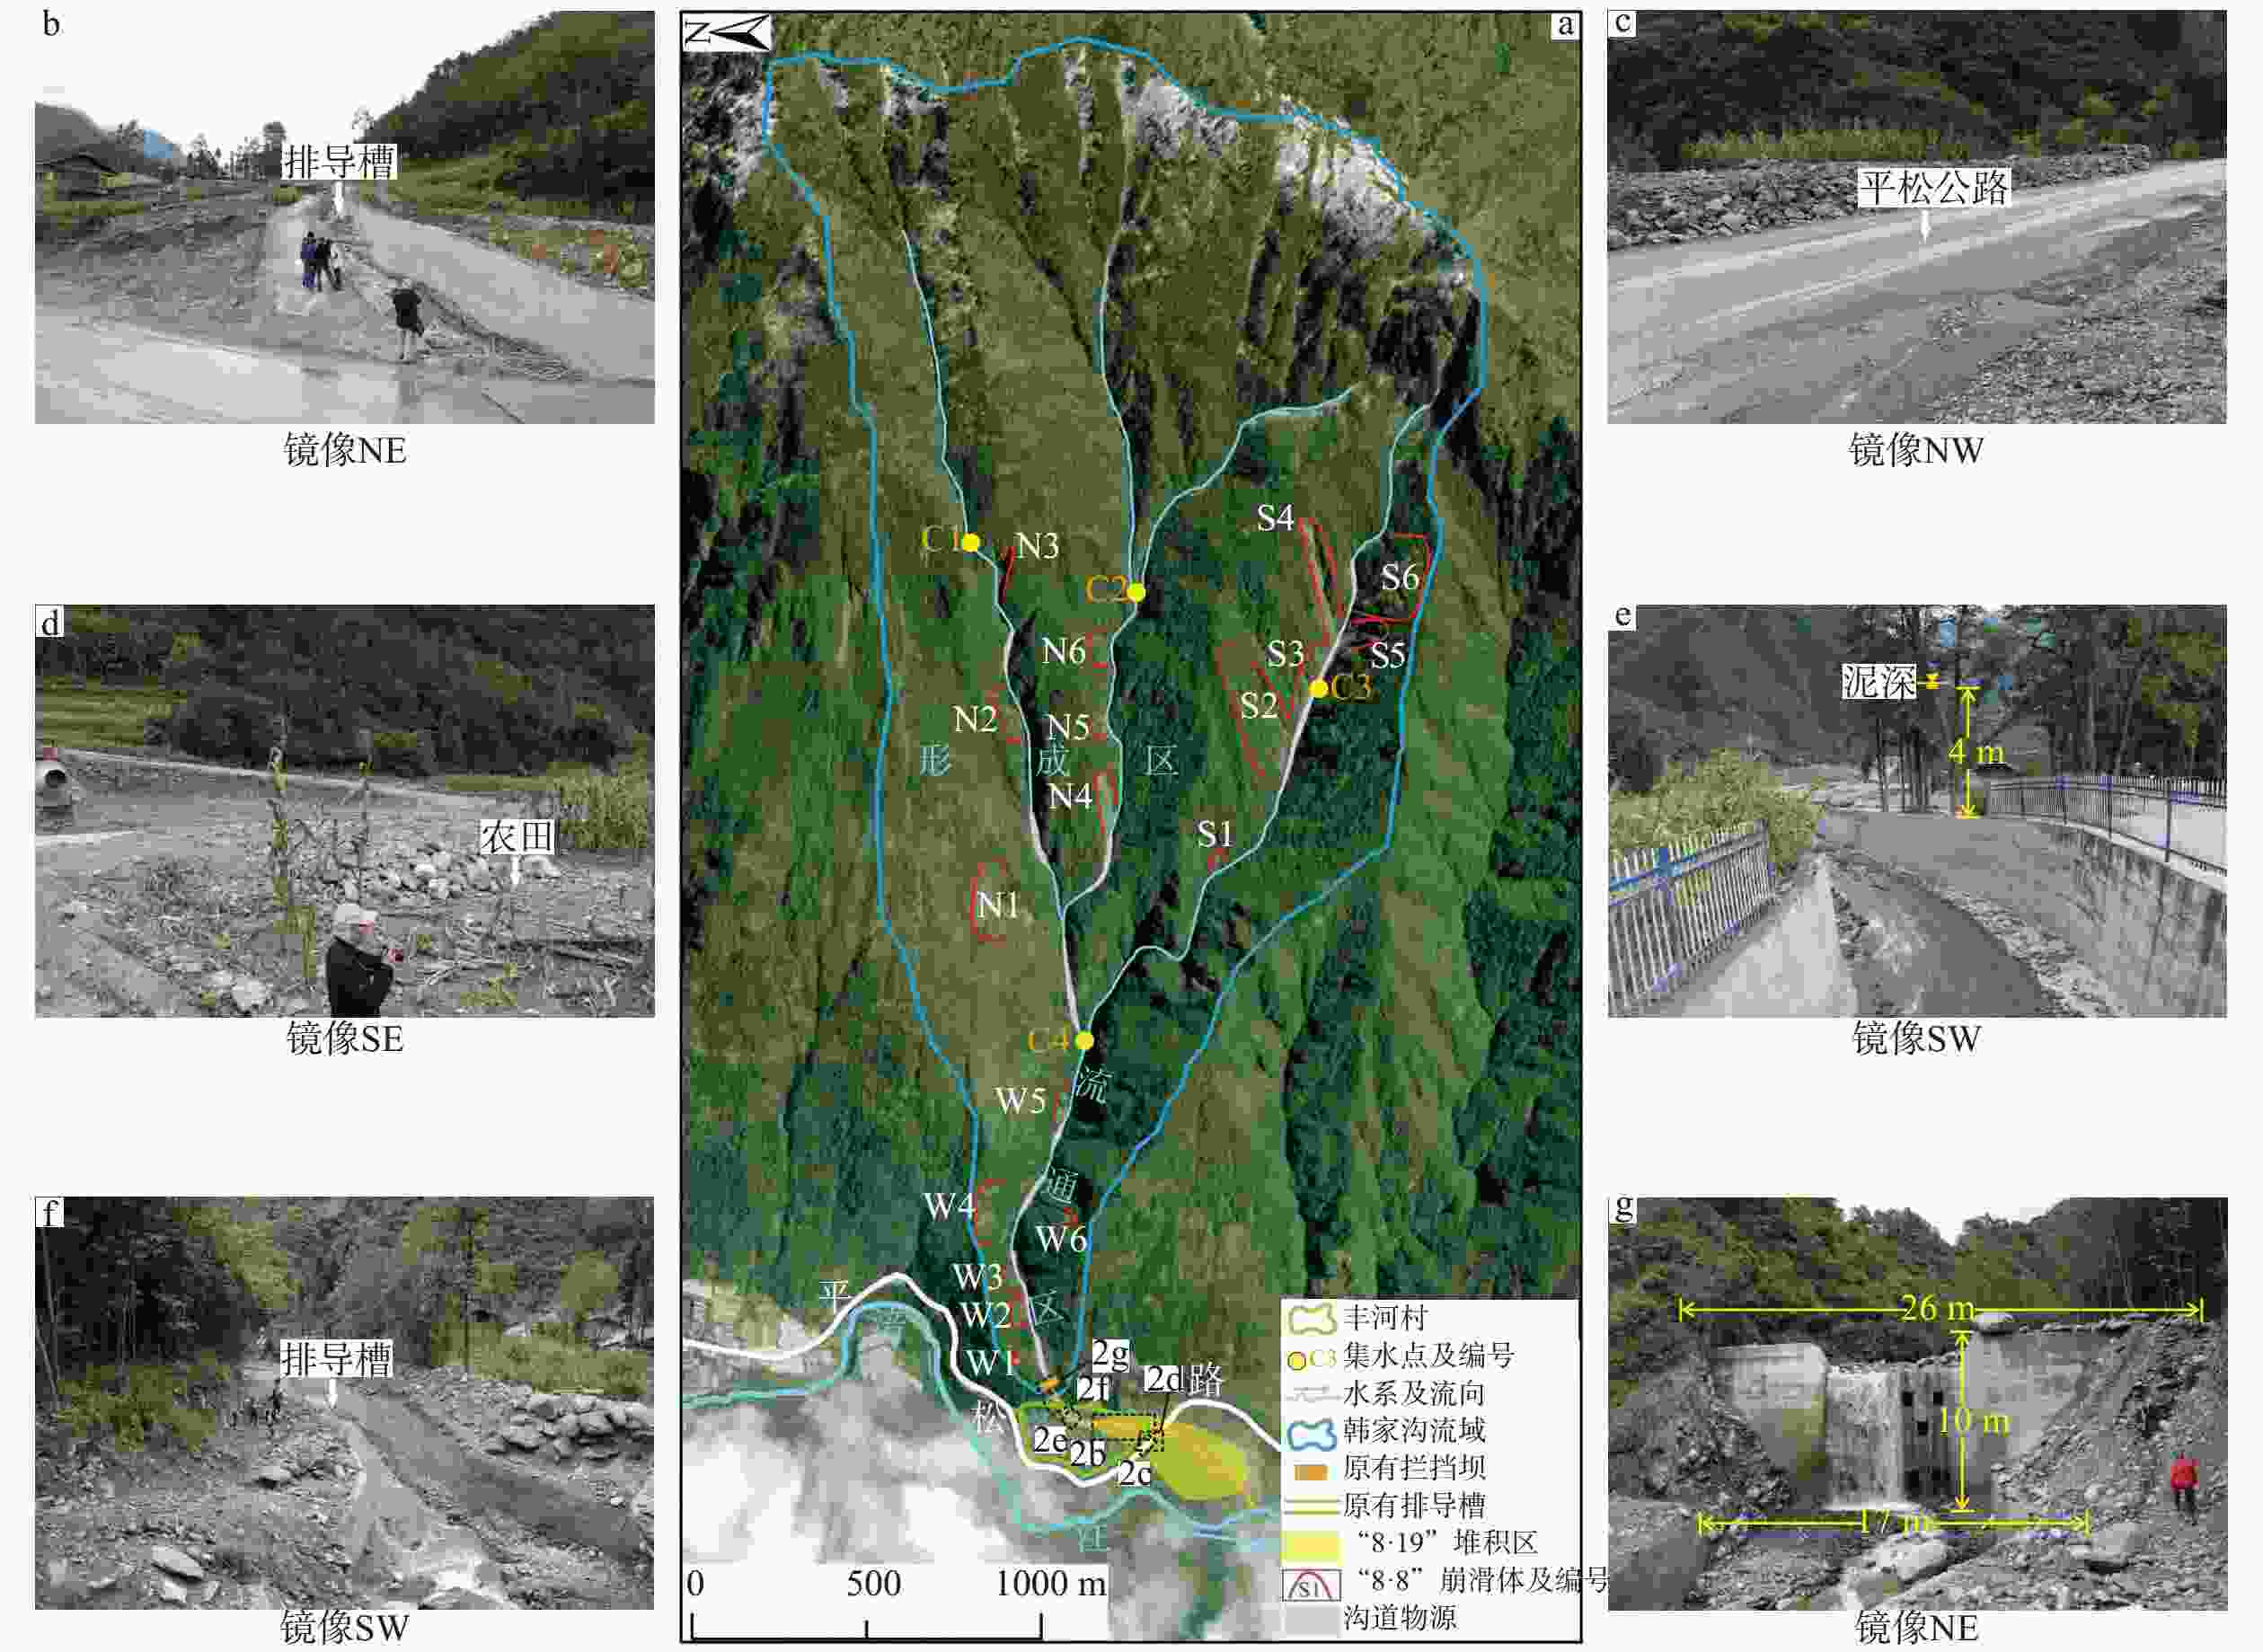
图 2 韩家沟泥石流流域崩滑体分布特征及“8·19”泥石流遗迹
a—韩家沟泥石流流域遥感影像及崩滑体分布;b—泥石流堆积区;c—泥石流淤埋公路;d—泥石流冲毁农田;e—排导槽拐弯处最高泥位;f—泥石流冲上排导槽;g—沟口拦挡坝淤满泥石流物质
Figure 2. Distribution characteristics of collapses and landslides and remains of the "8·19" debris flow in Hanjia gully debris flow watershed
(a) Remote sensing image and distribution of collapses and landslides in Hanjia Gully debris flow watershed; (b) Debris flow accumulation area; (c) Debris flow burying the highway; (d) Debris flow that washed away farmland; (e) The highest mud position at the bend of the drainage channel; (f) Debris flow that washed up the drainage channel; (g) The retaining dam at the mouth of the gully was filled with debris flow material
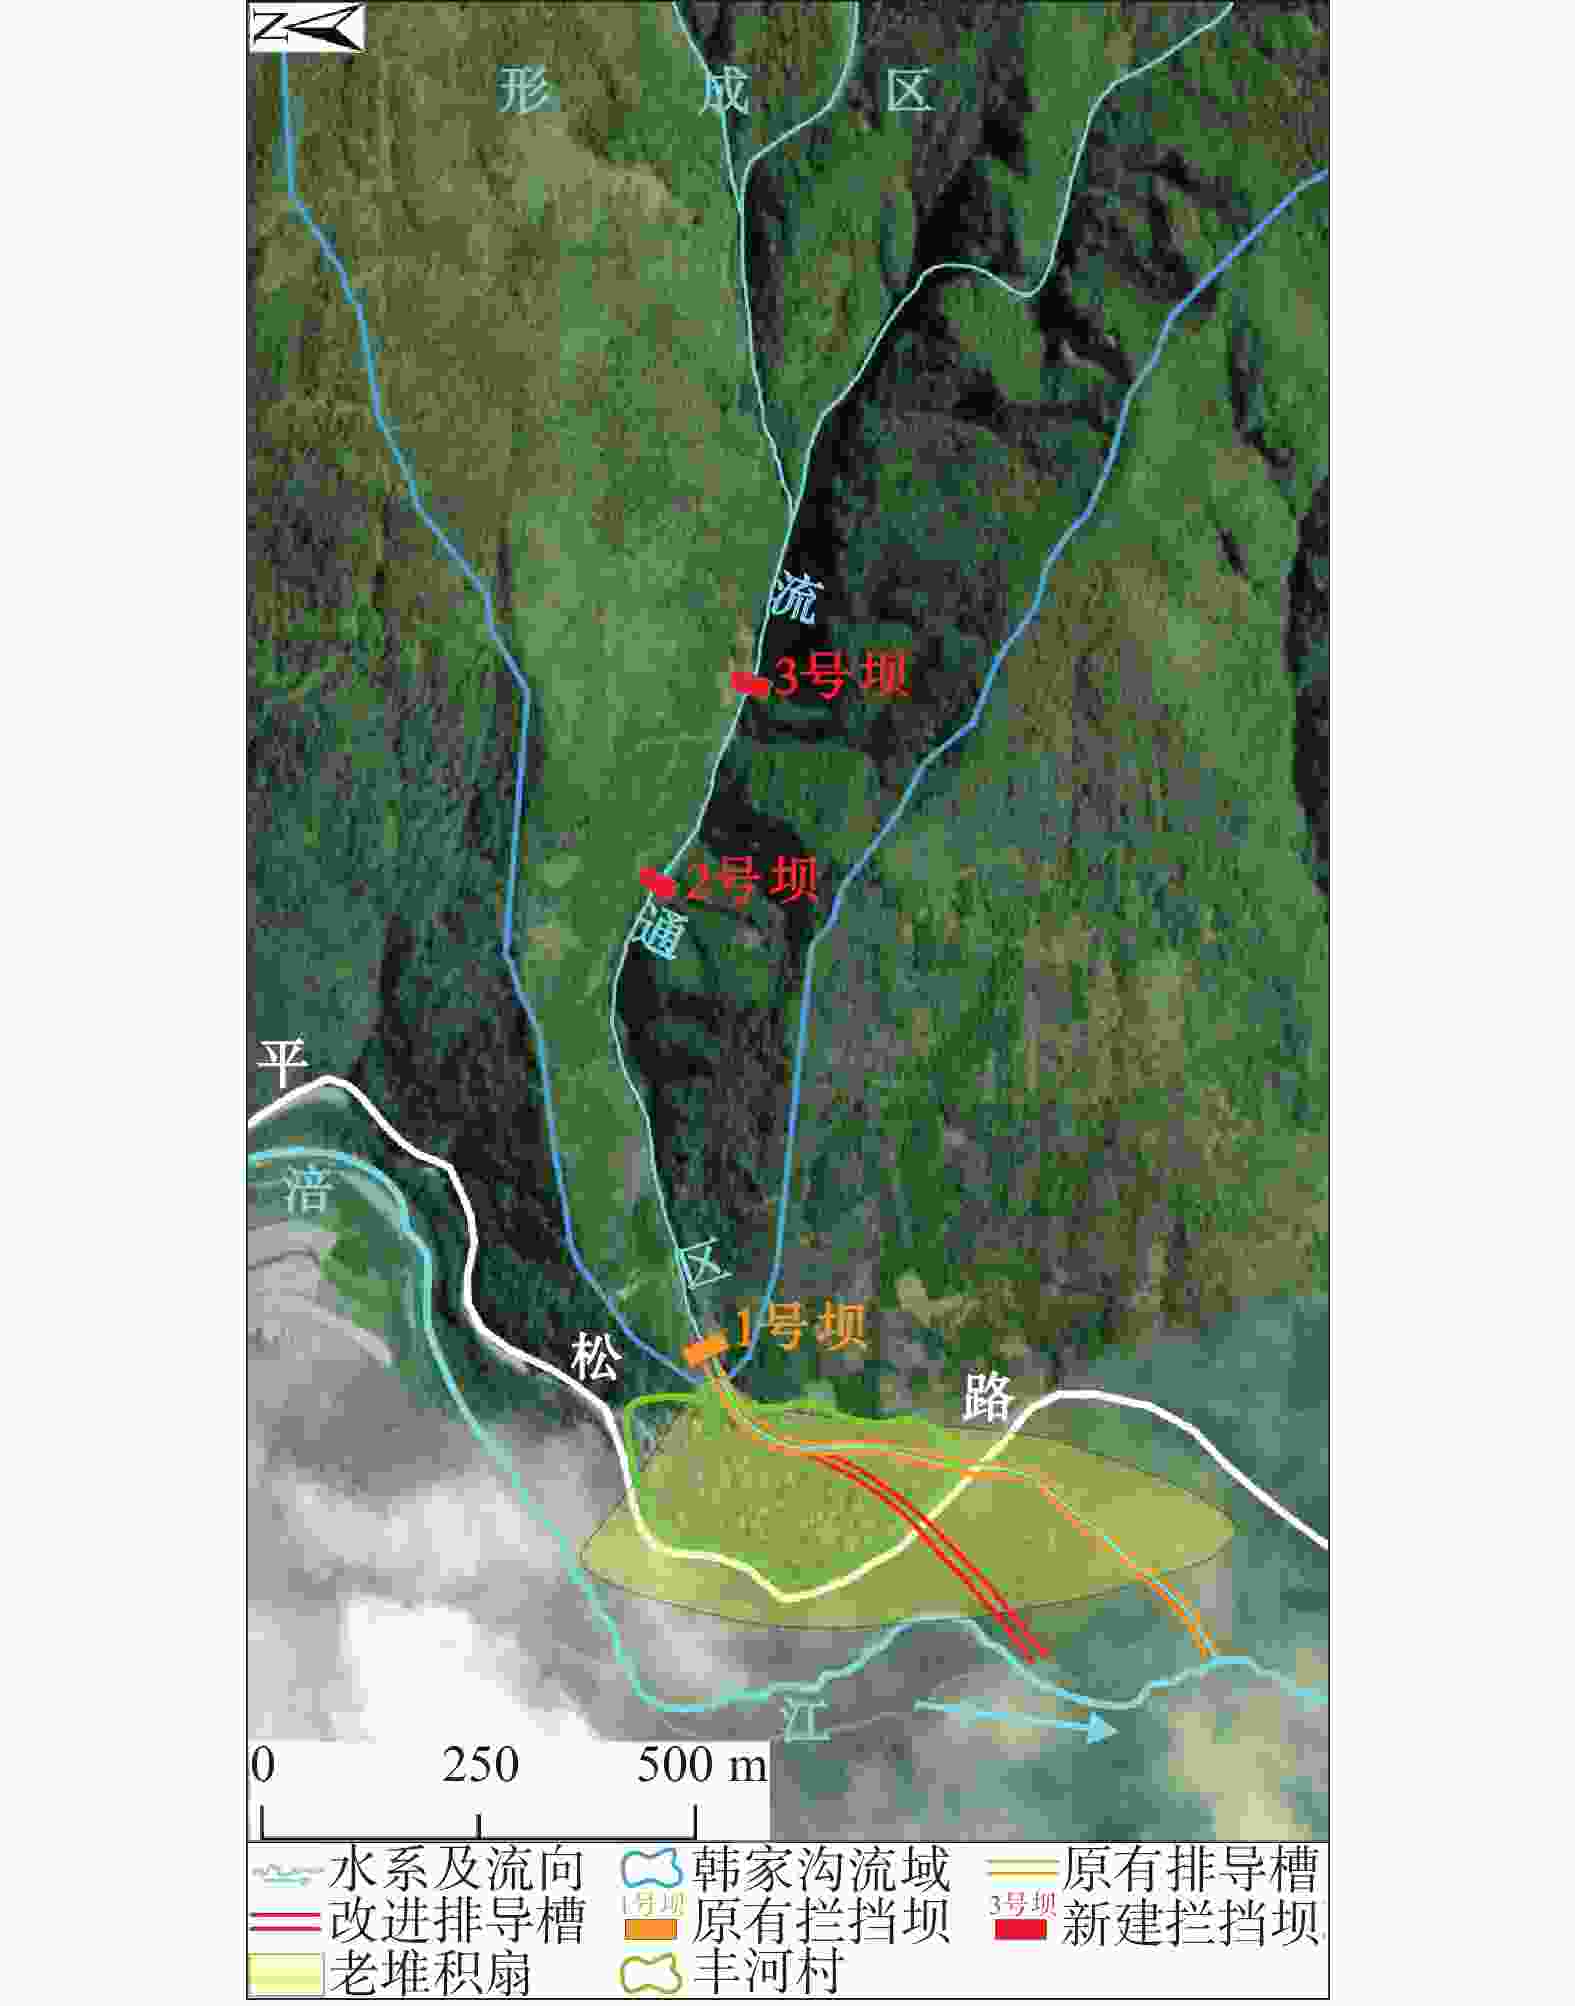
图 3 韩家沟泥石流防治工程改进前后工程布置平面图
Figure 3. Plan of Hanjia gully debris flow prevention and control engineering before and after improvement
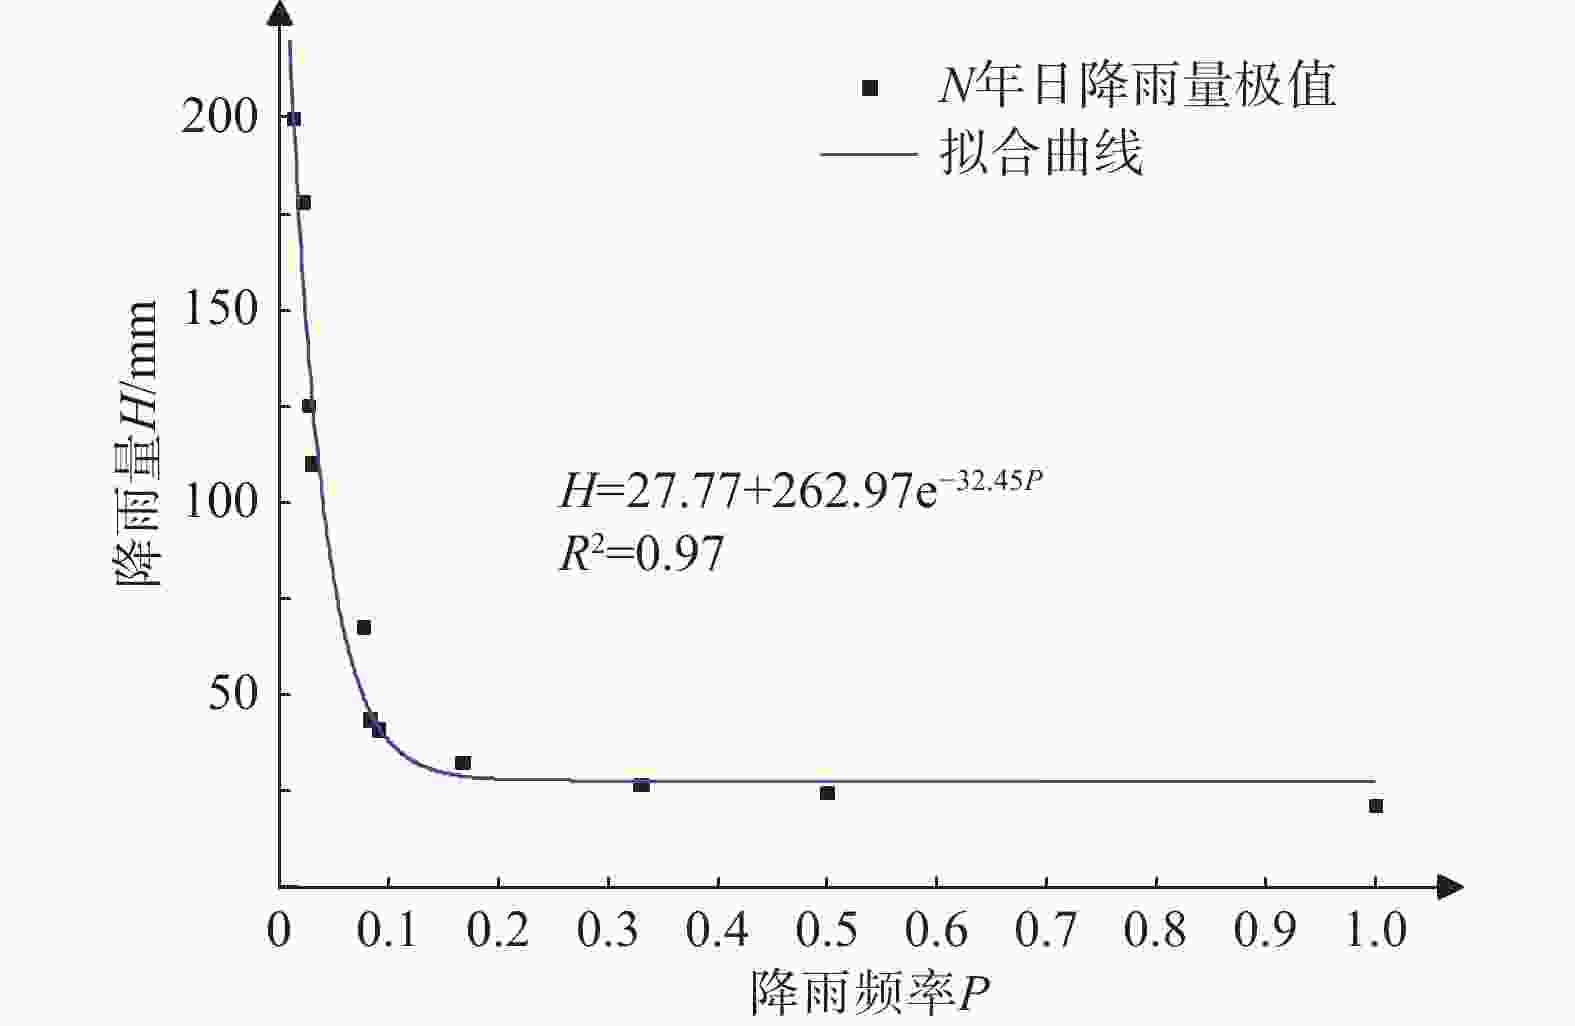
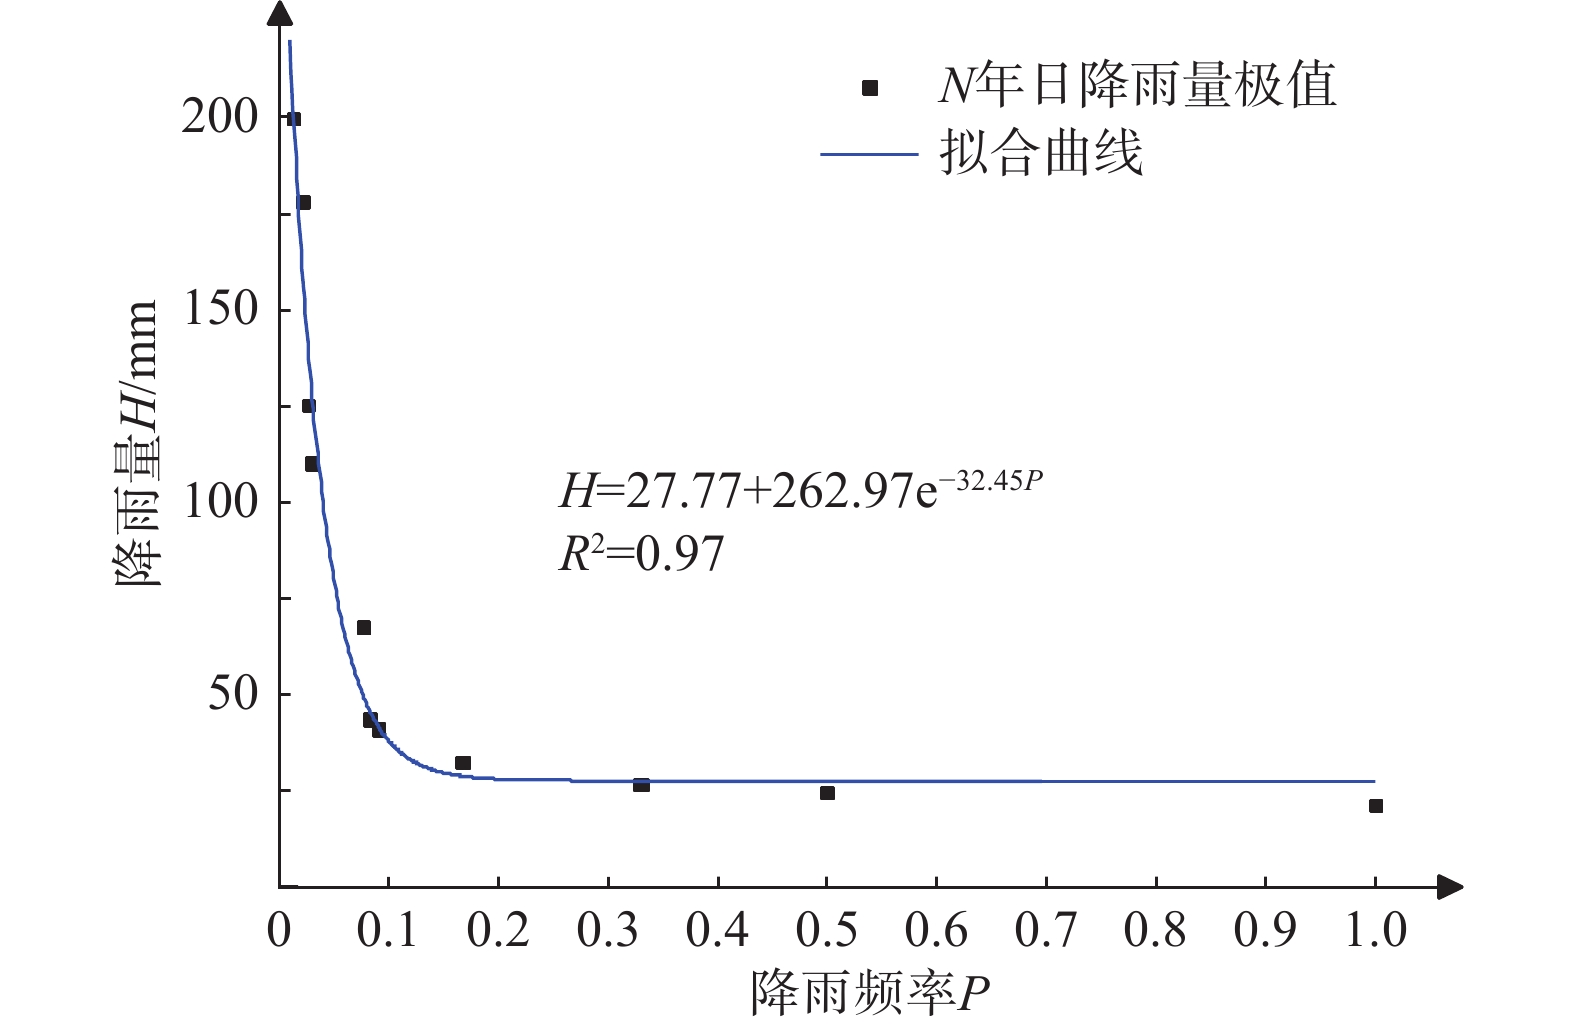
图 5 涪江流域降雨量频率拟合曲线
Figure 5. Fitting curve of rainfall frequency in the Fujiang River basin
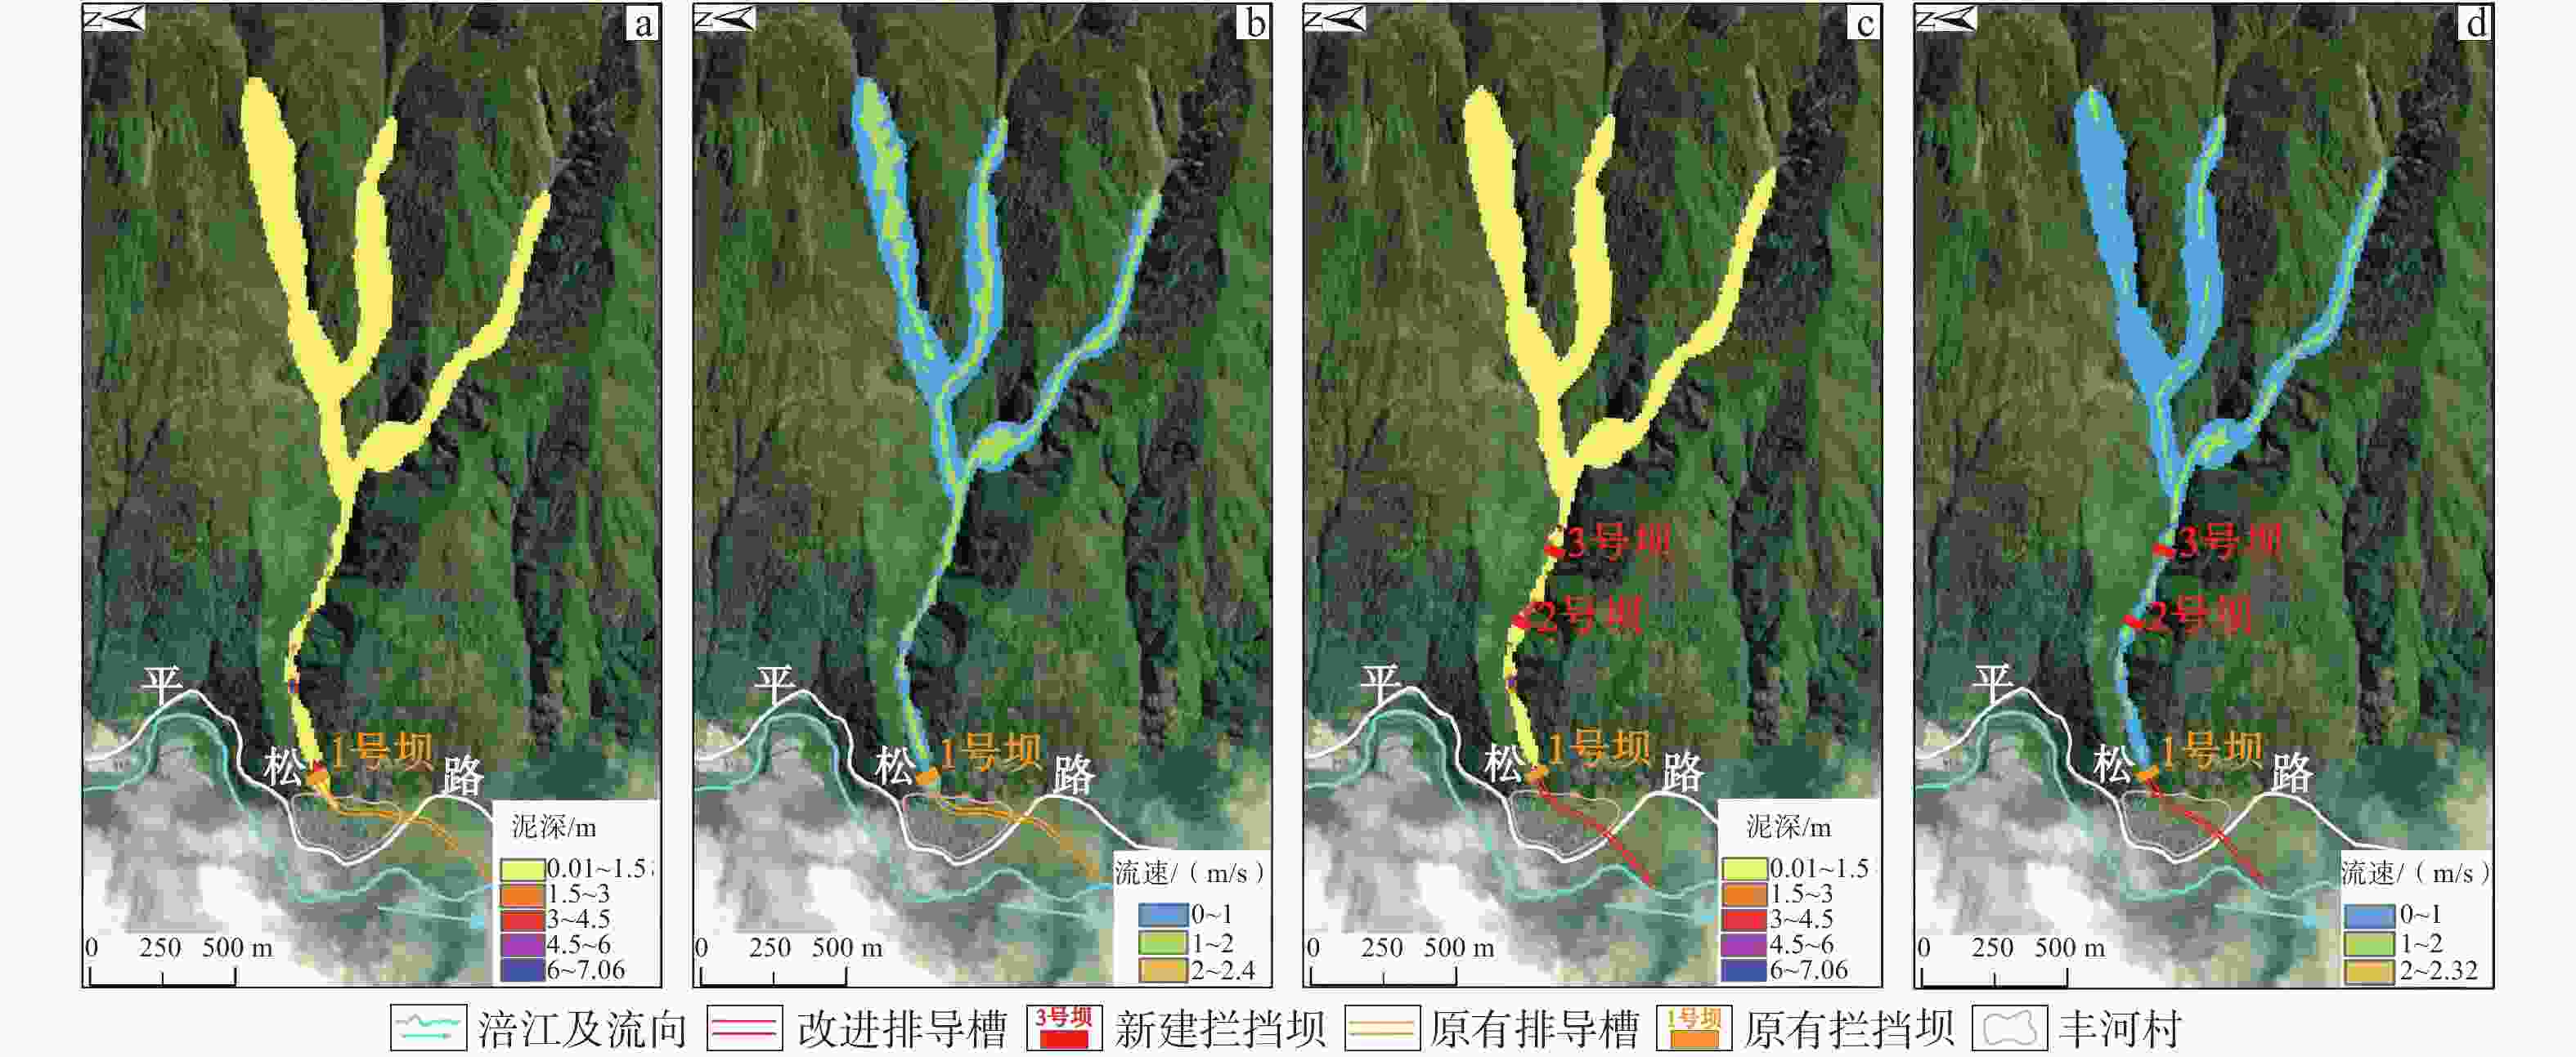
图 6 10年一遇降雨频率下不同防治工程的泥石流泥深与流速
a—现有防治工程下泥深;b—现有防治工程下流速;c—防治工程改进后泥深;d—防治工程改进后流速
Figure 6. Mud depth and velocity of debris flow in different control engineering conditions under 10-year rainfall frequency
(a) Mud depth of debris flow under existing control engineering conditions; (b) Velocity of debris flow under existing control engineering conditions; (c) Mud depth of debris flow after improvement of control engineering; (d) Velocity of debris flow after improvement of control engineering
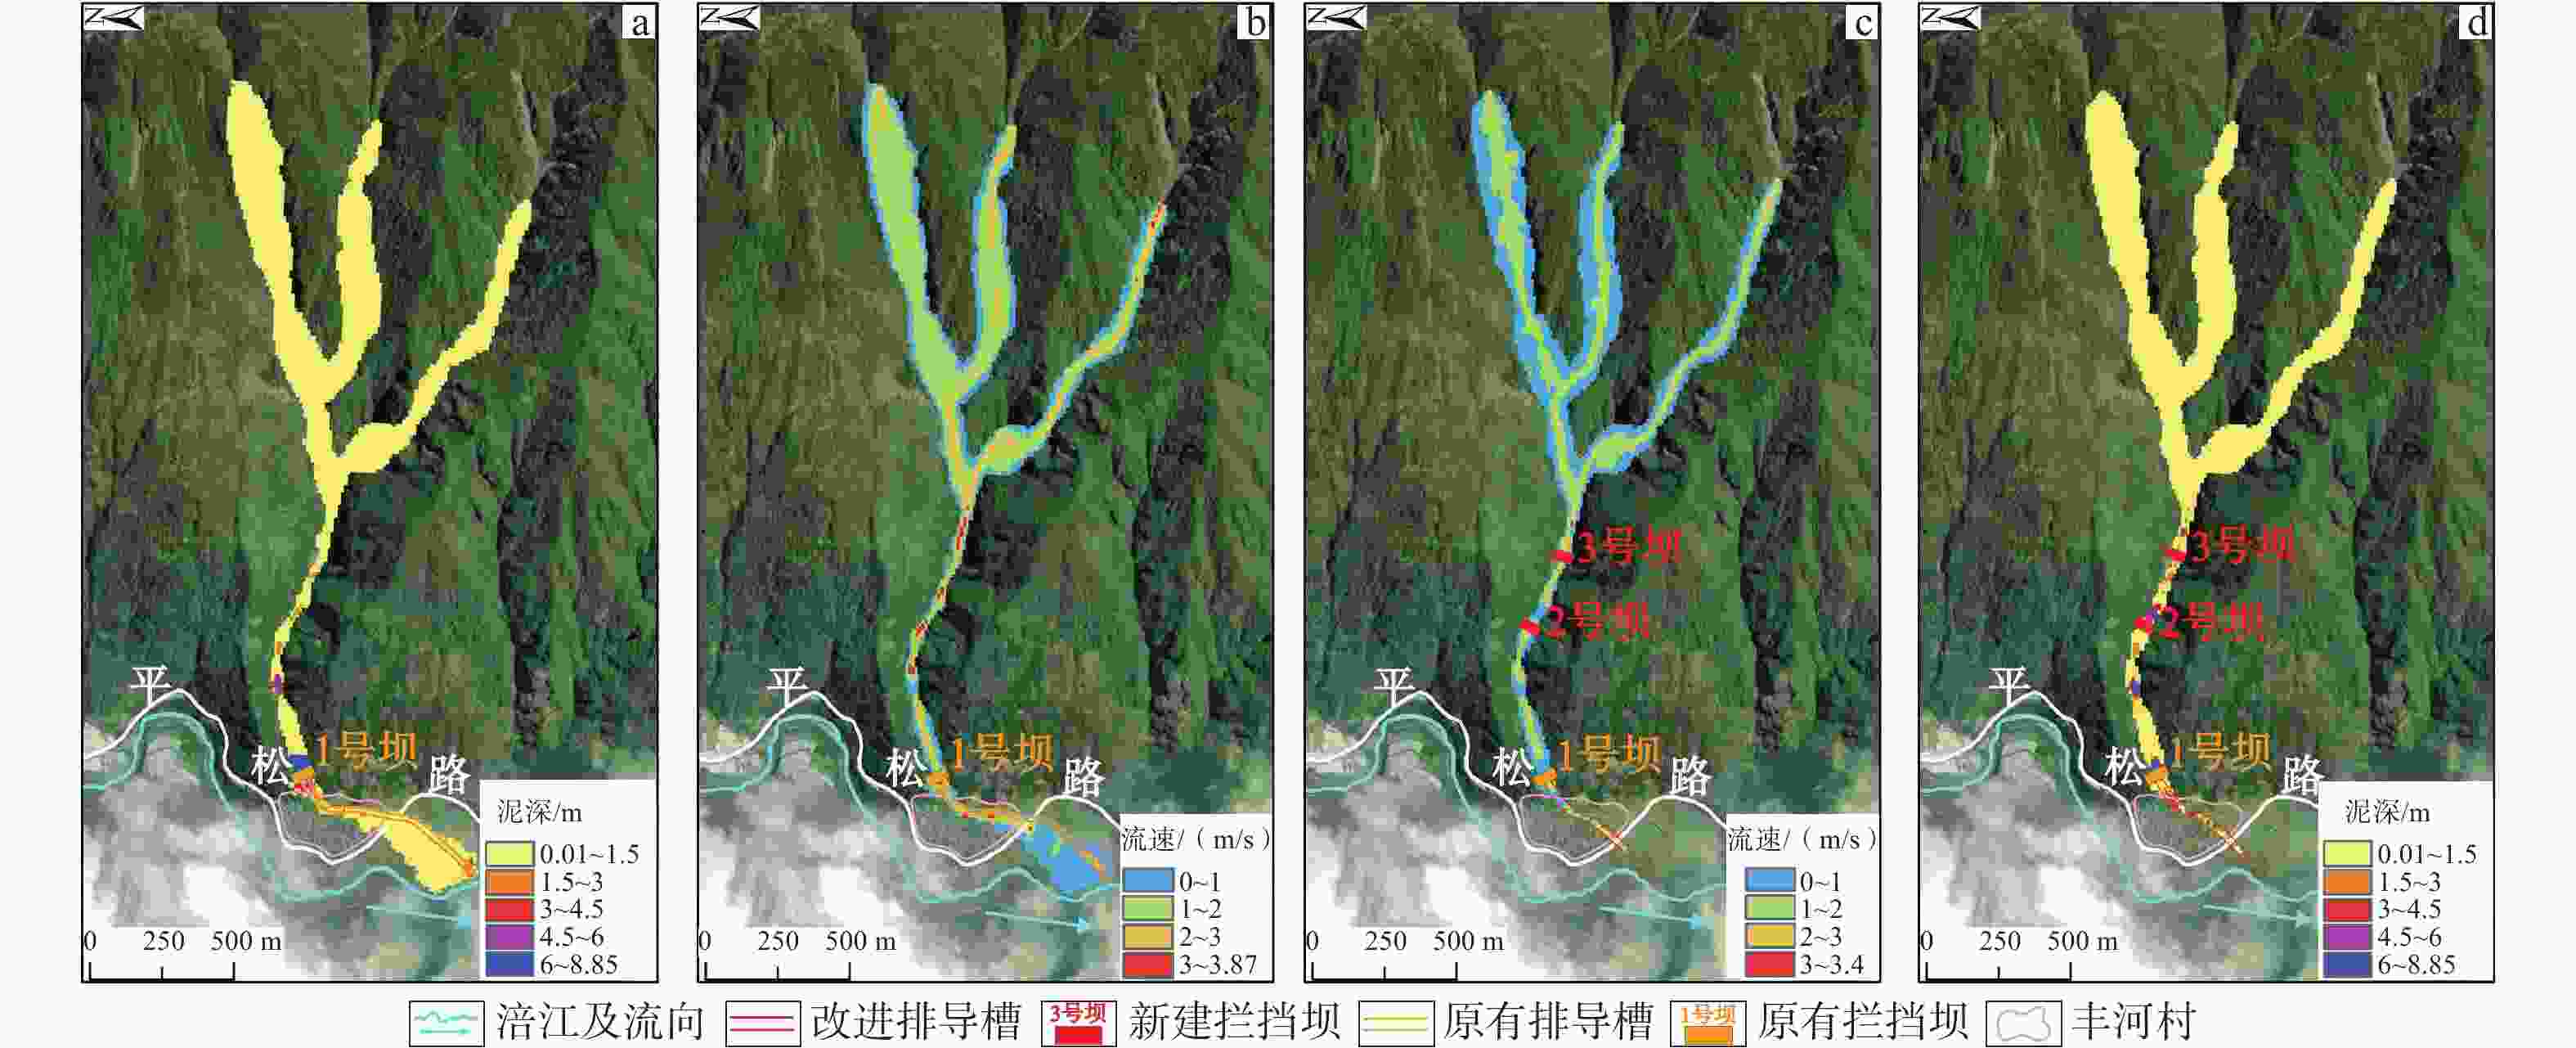
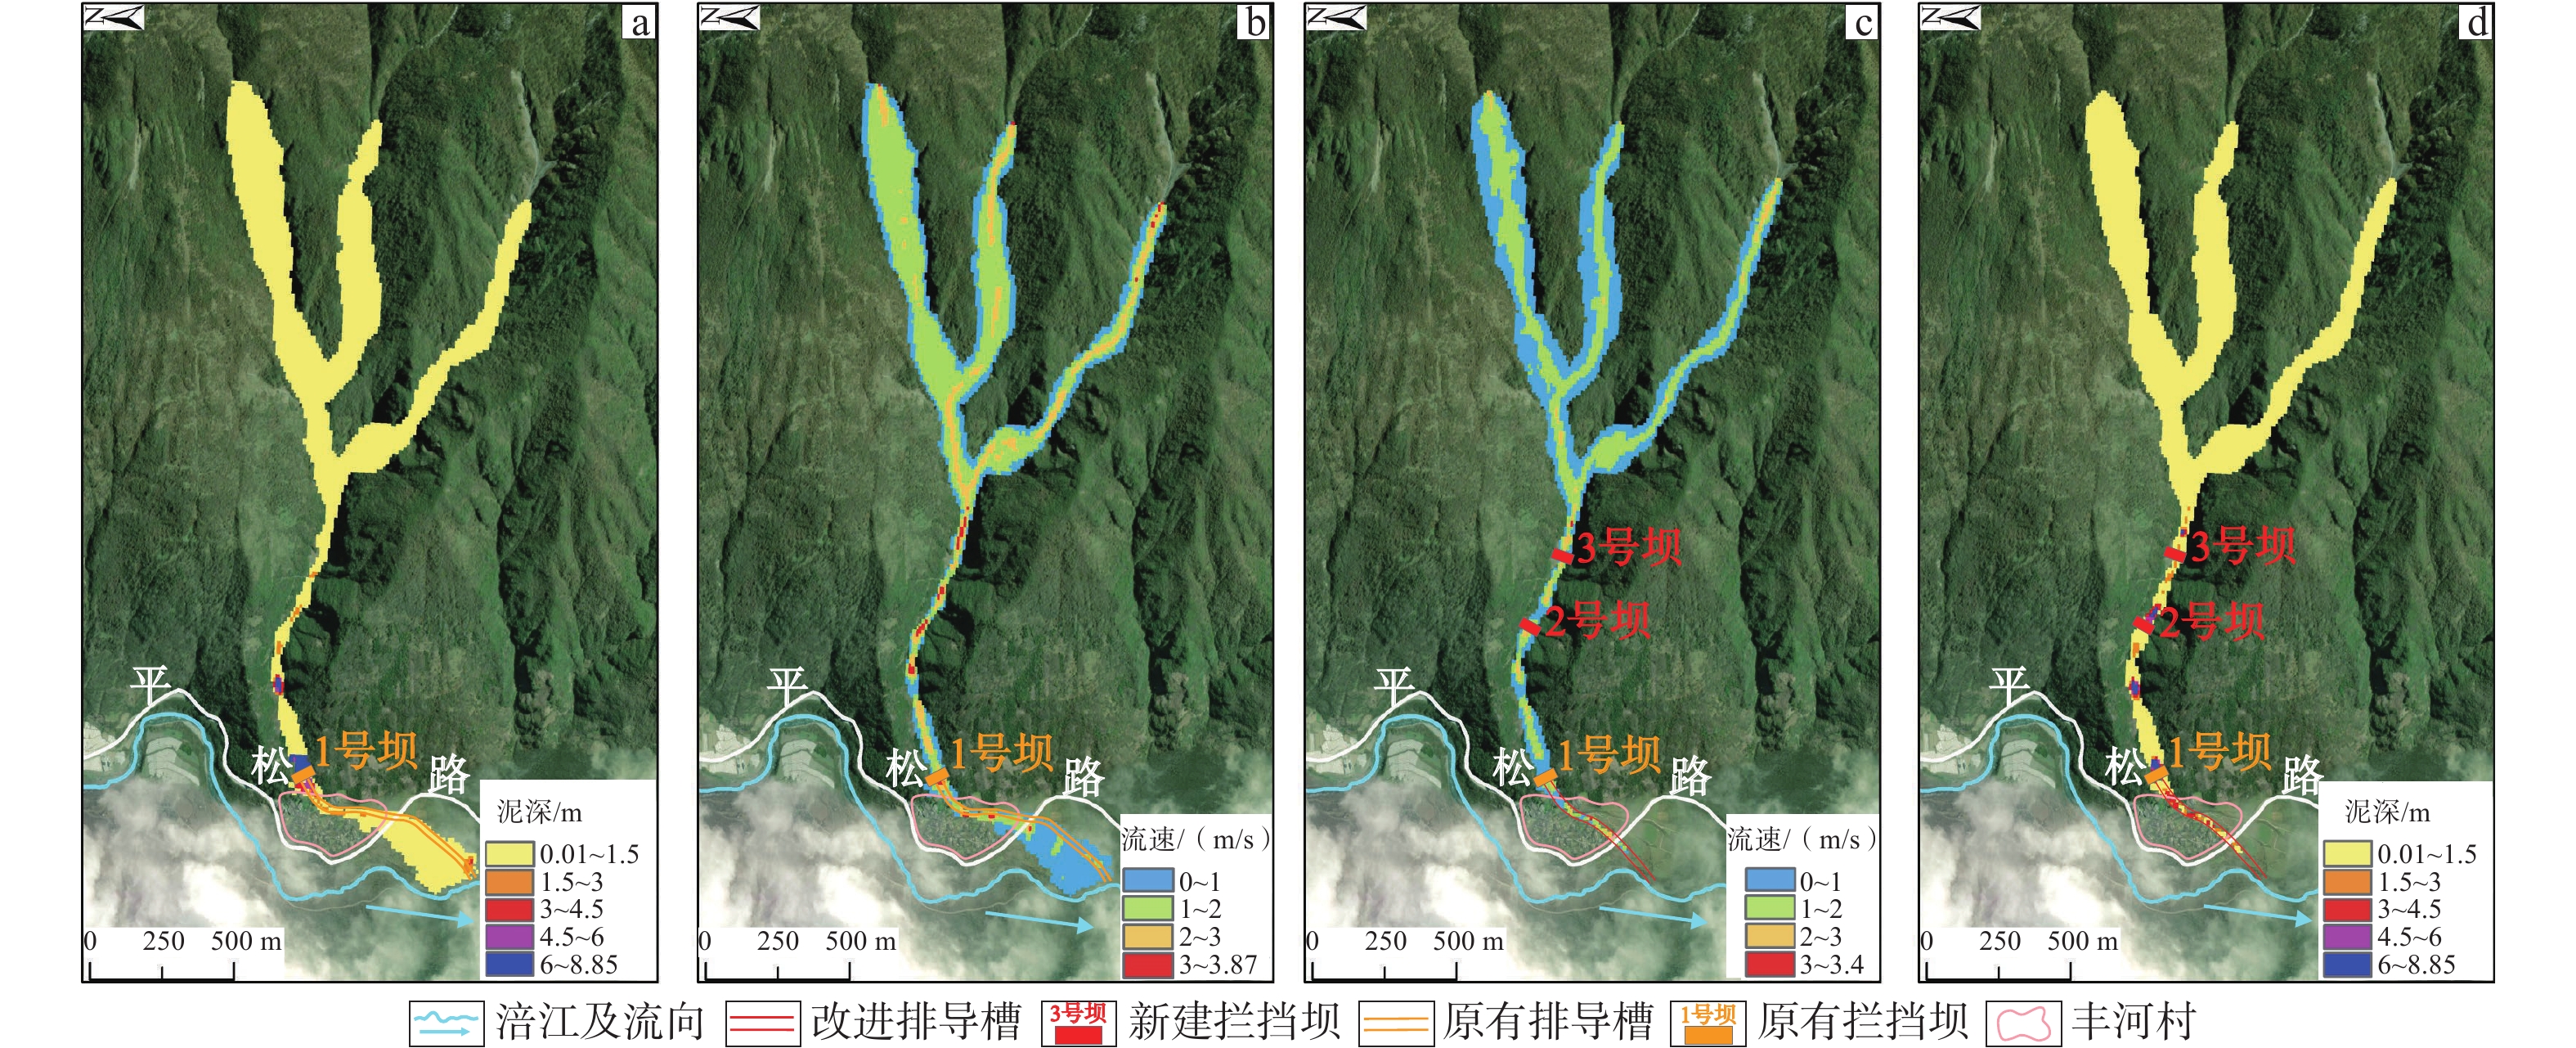
图 7 50年一遇降雨频率下不同防治工程的泥石流泥深与流速
a—现有防治工程下泥深;b—现有防治工程下流速;c—防治工程改进后流速;d—防治工程改进后泥深
Figure 7. Mud depth and velocity of debris flow in different control engineering conditions under 50-year rainfall frequency
(a) Mud depth of debris flow under existing control engineering conditions; (b) Velocity of debris flow under existing control engineering conditions; (c) Velocity of debris flow after improvement in control engineering; (d) Mud depth of debris flow after improvement in control engineering
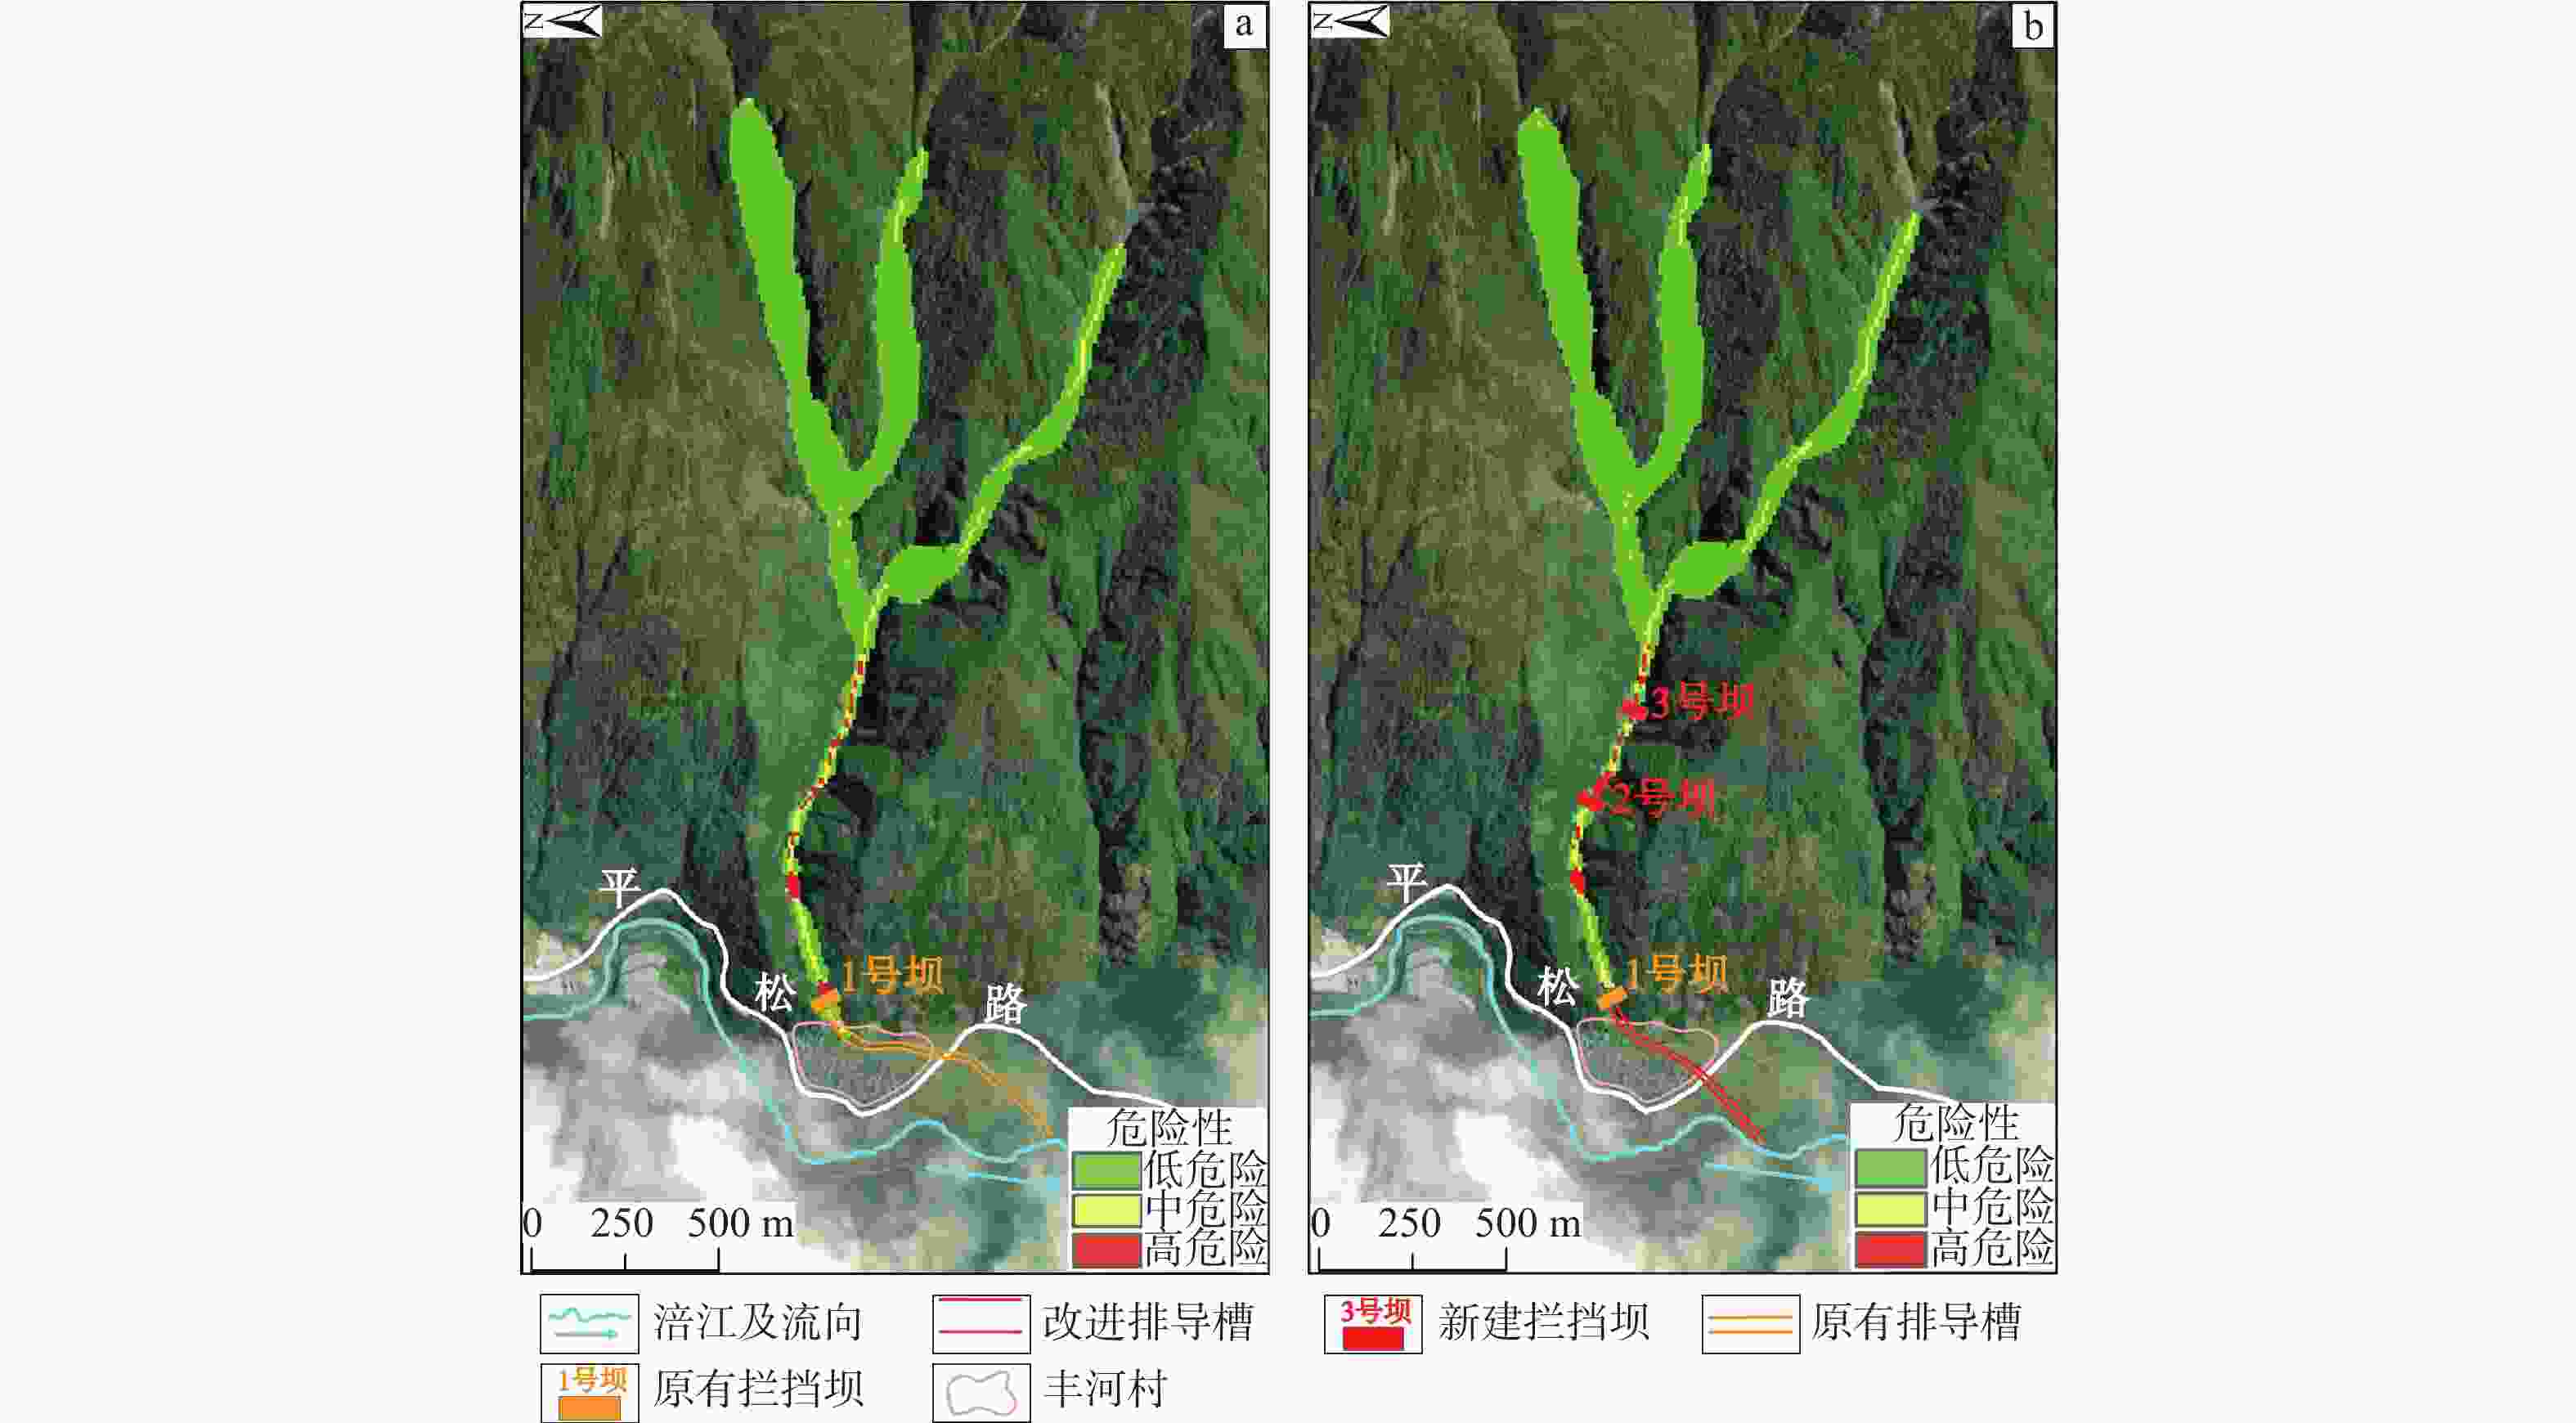
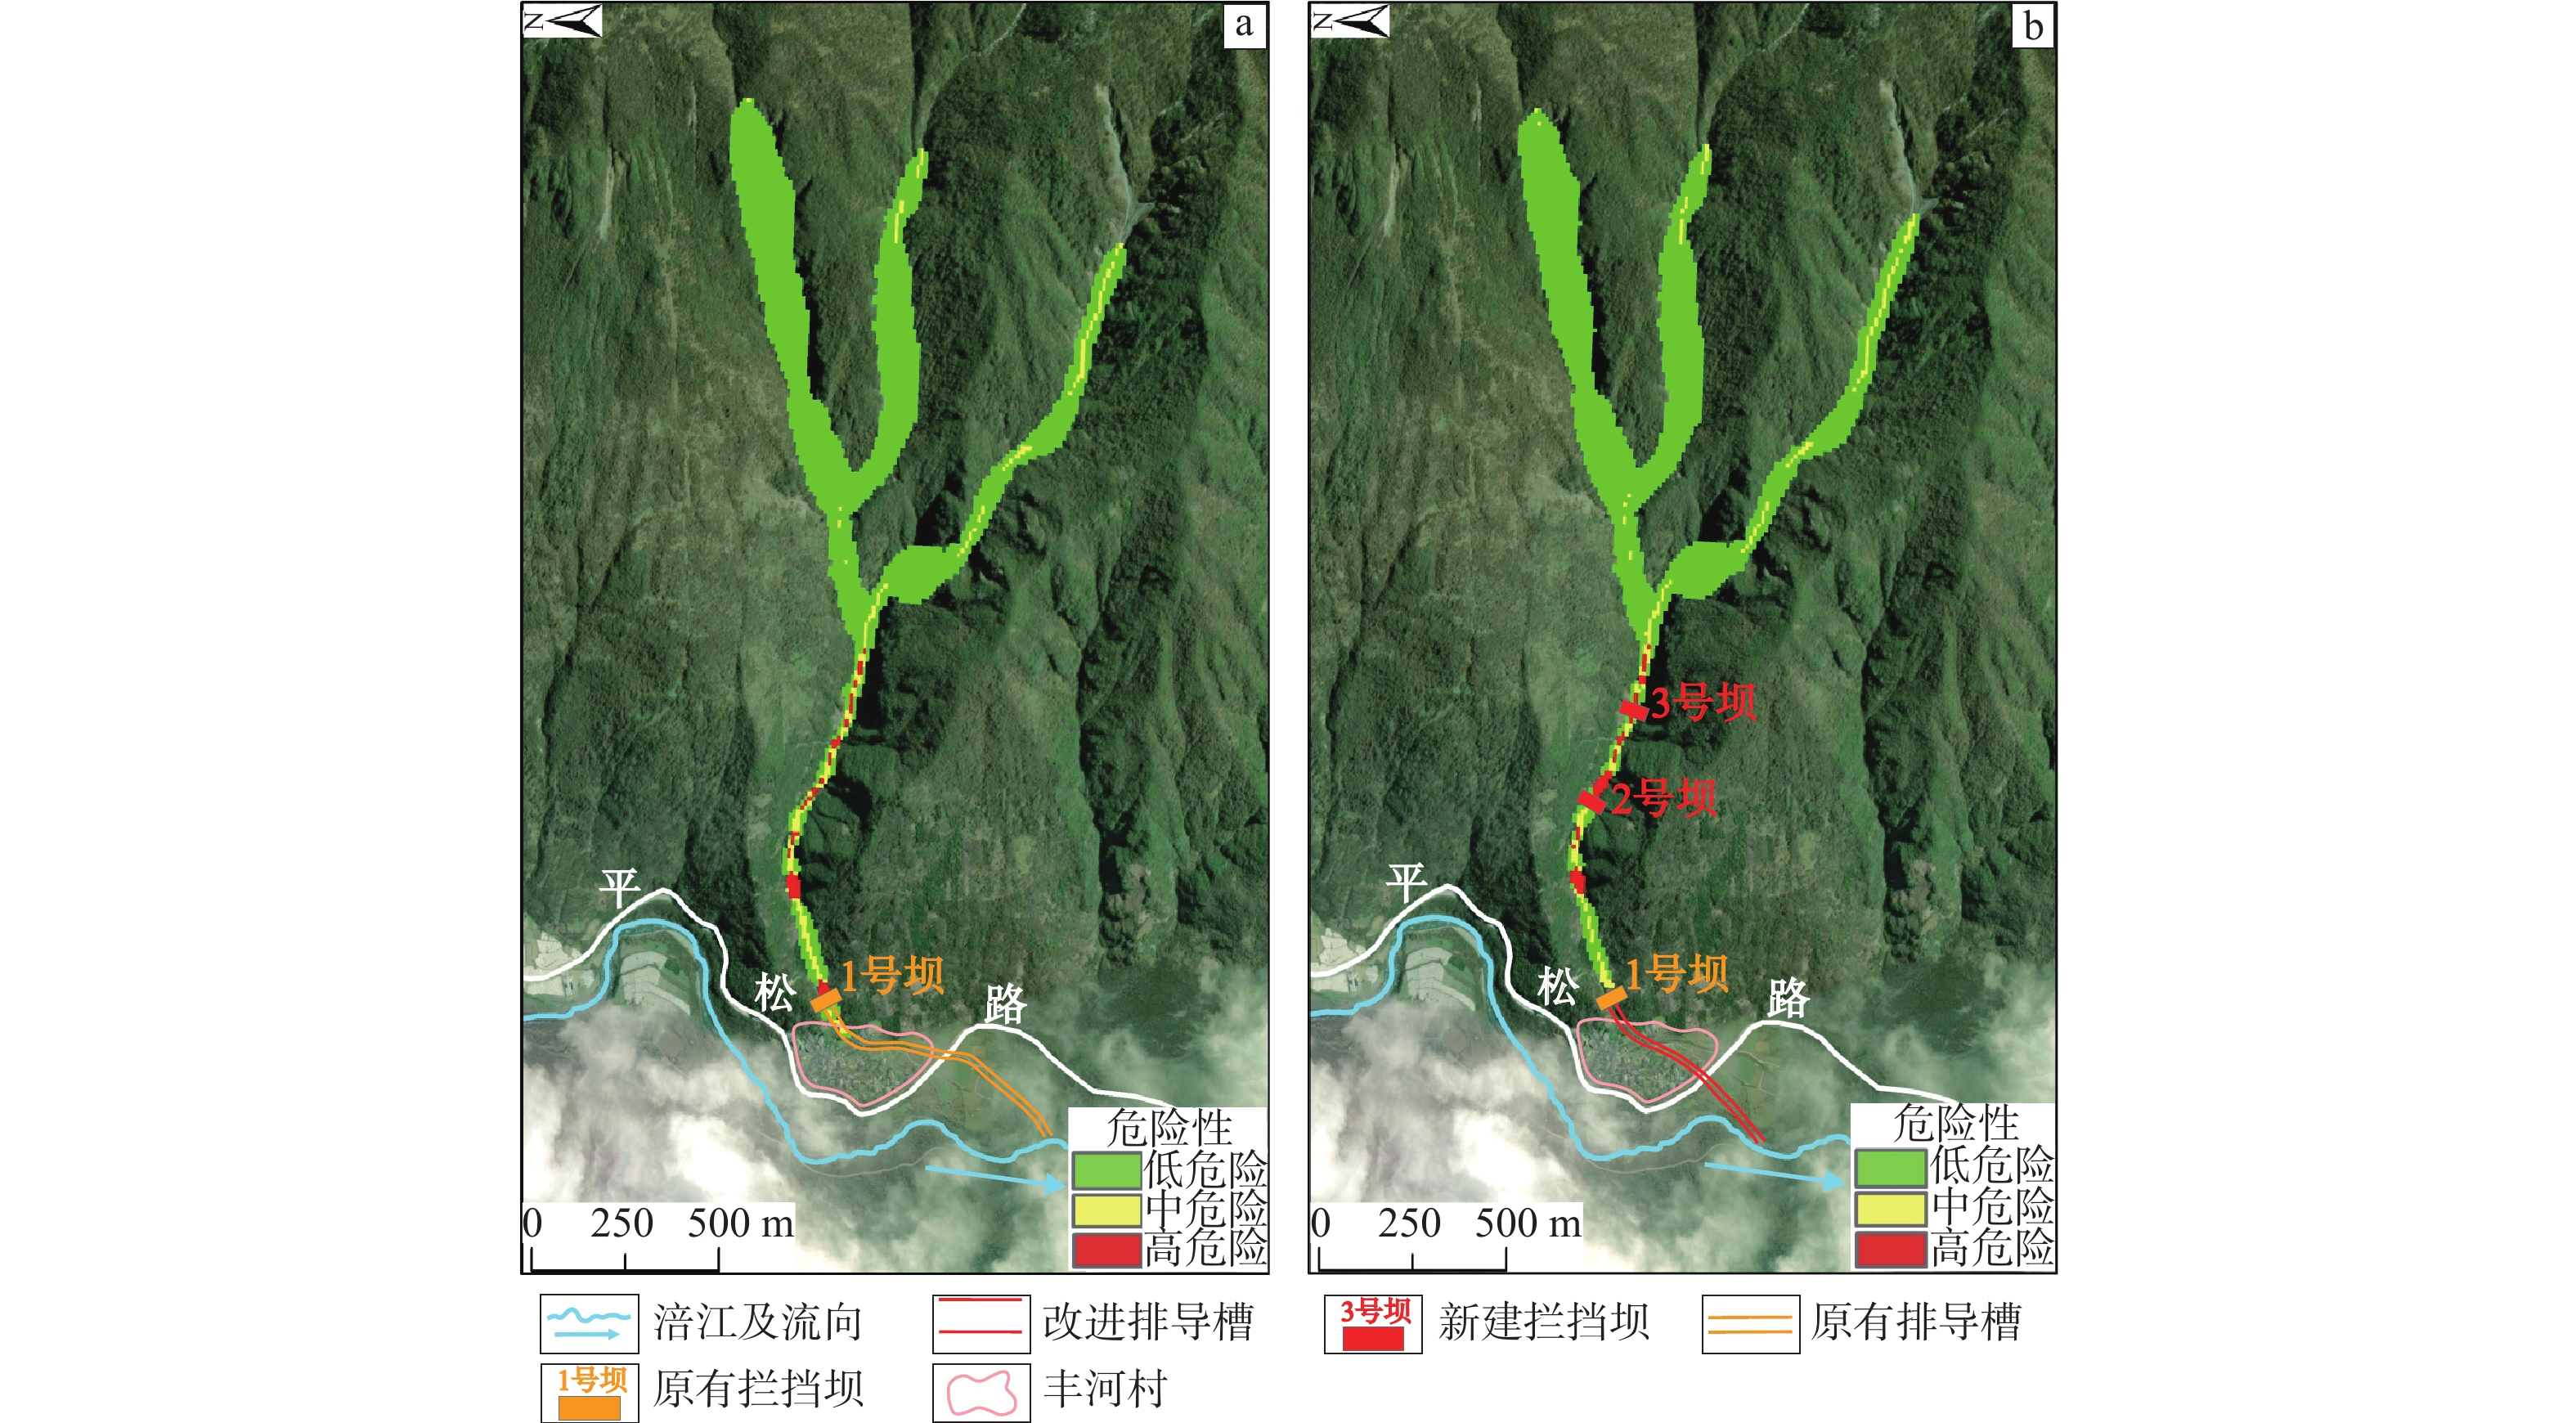
图 8 10年一遇降雨频率下不同防治工程的泥石流危险性分区
a—现有防治工程;b—防治工程改进后
Figure 8. Hazard distribution of debris flow in different control engineering conditions under 10-year rainfall frequency
(a) Under existing control engineering conditions; (b) After improvements in control engineering
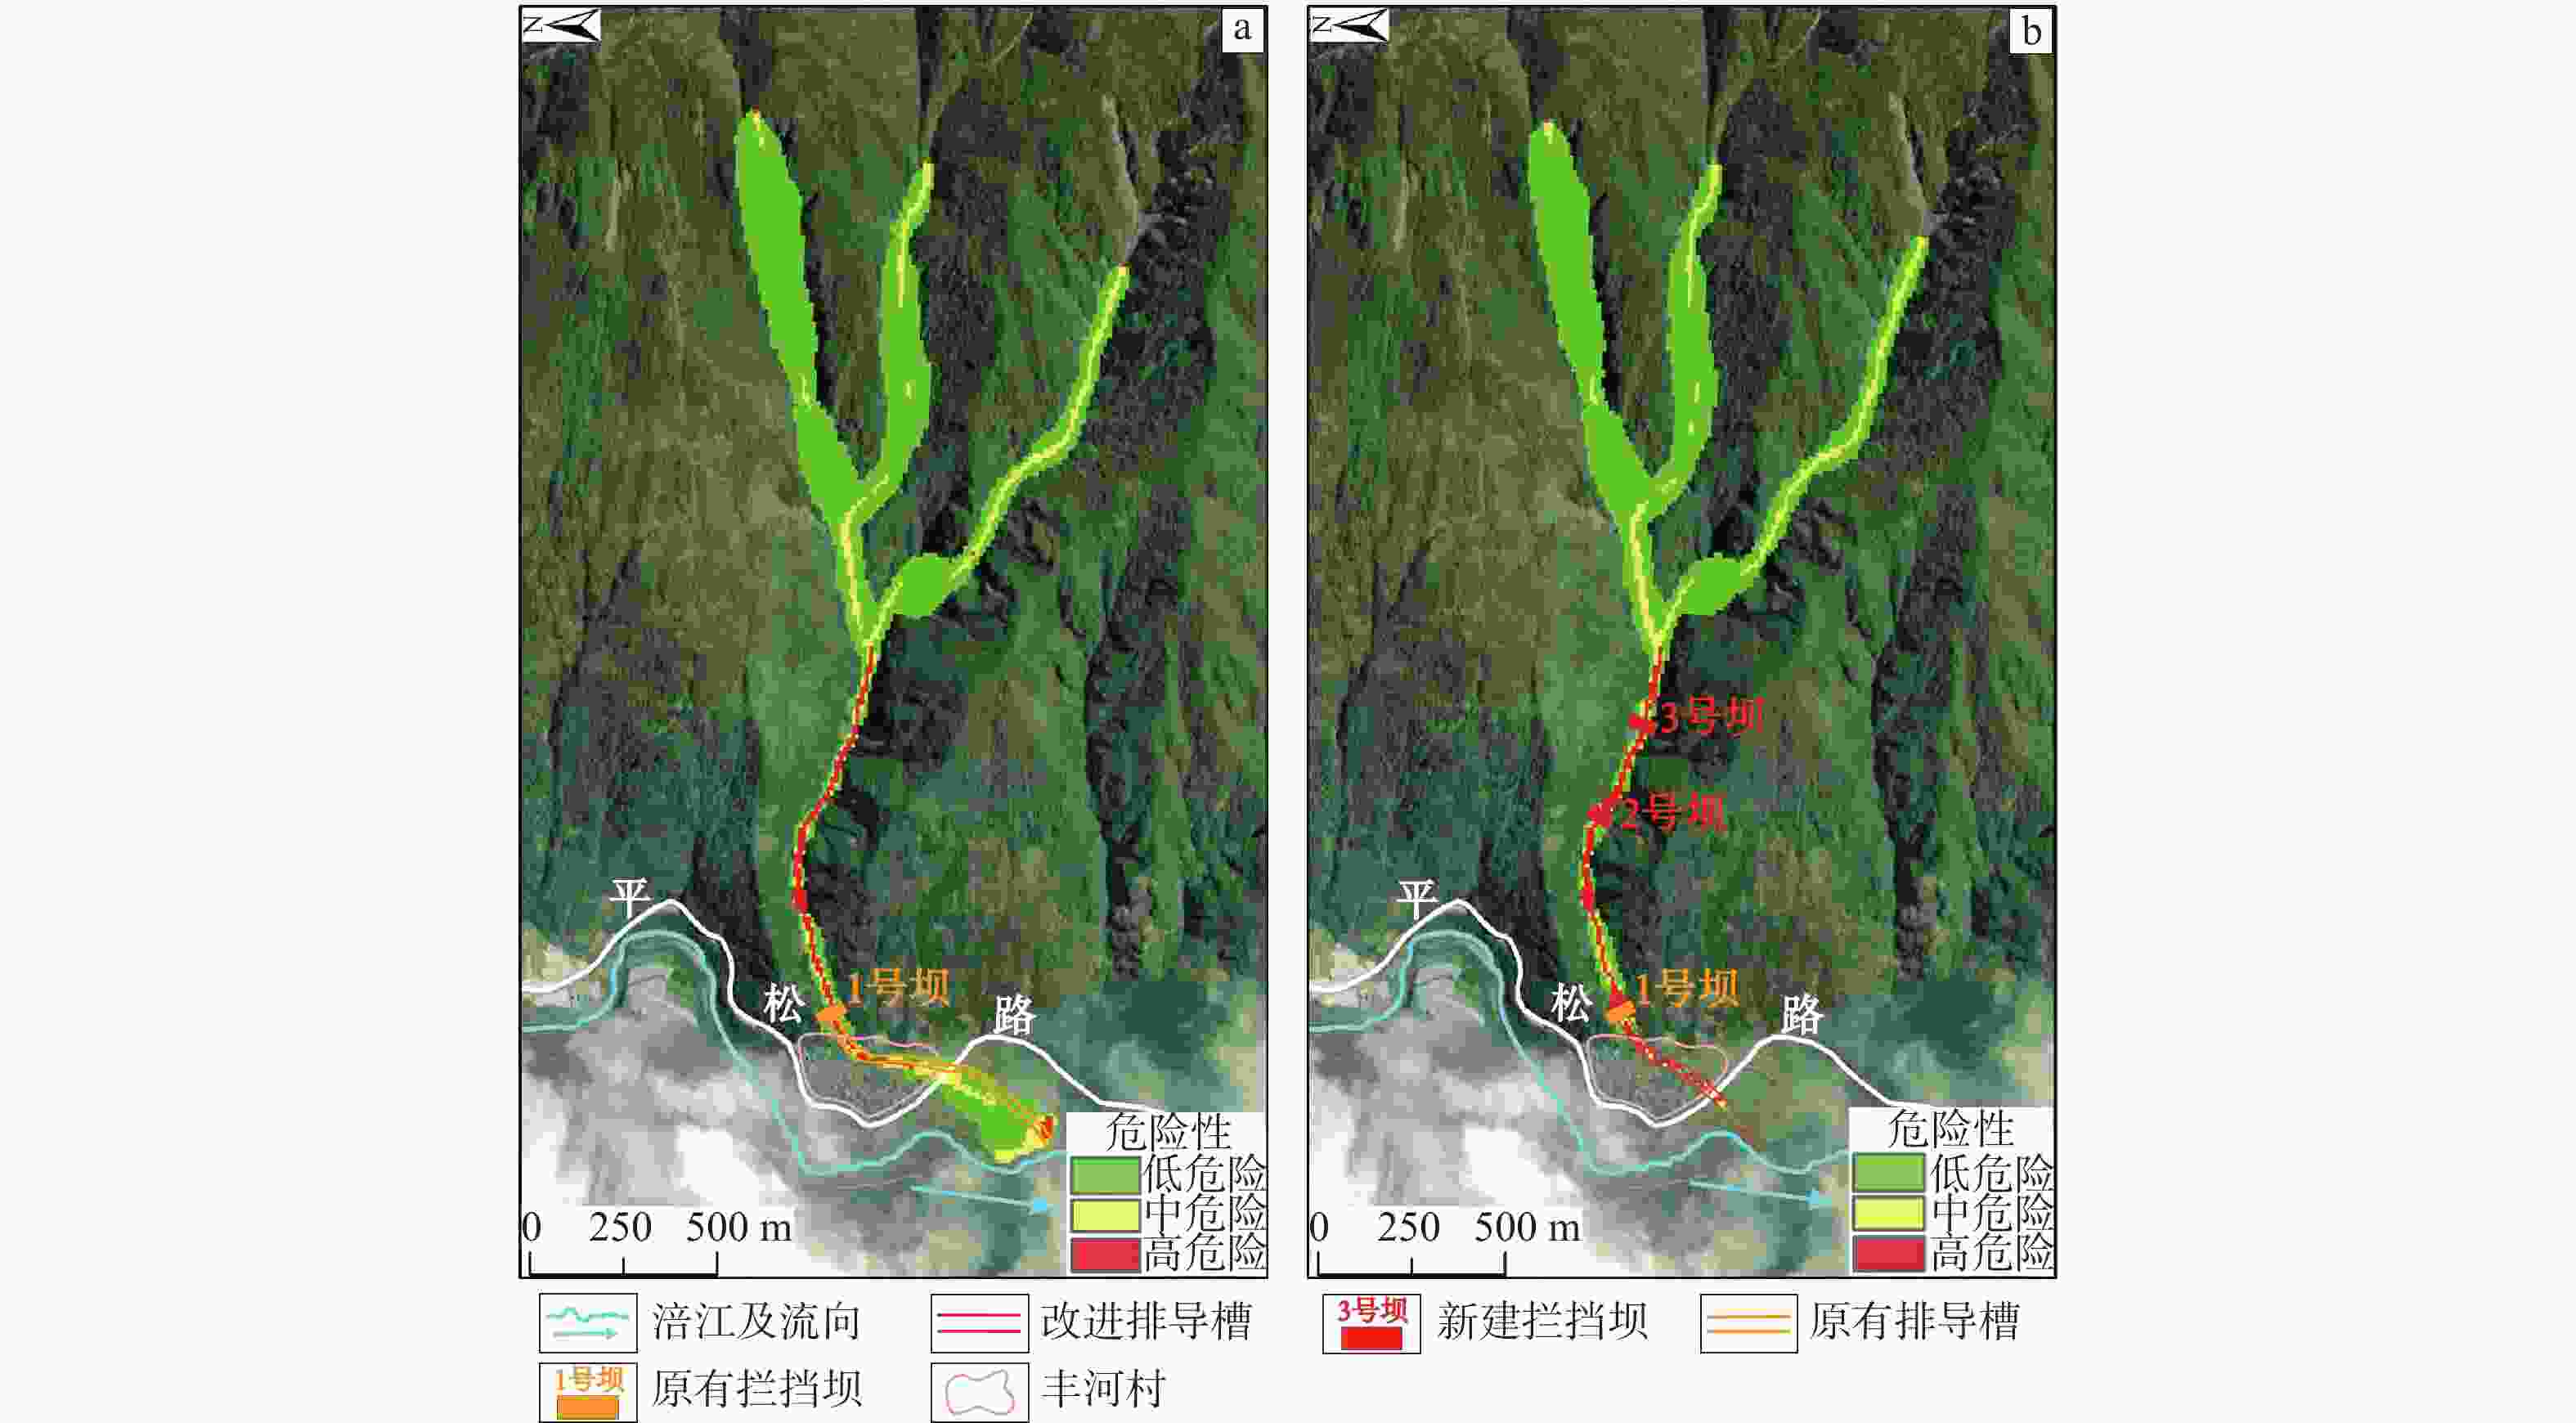
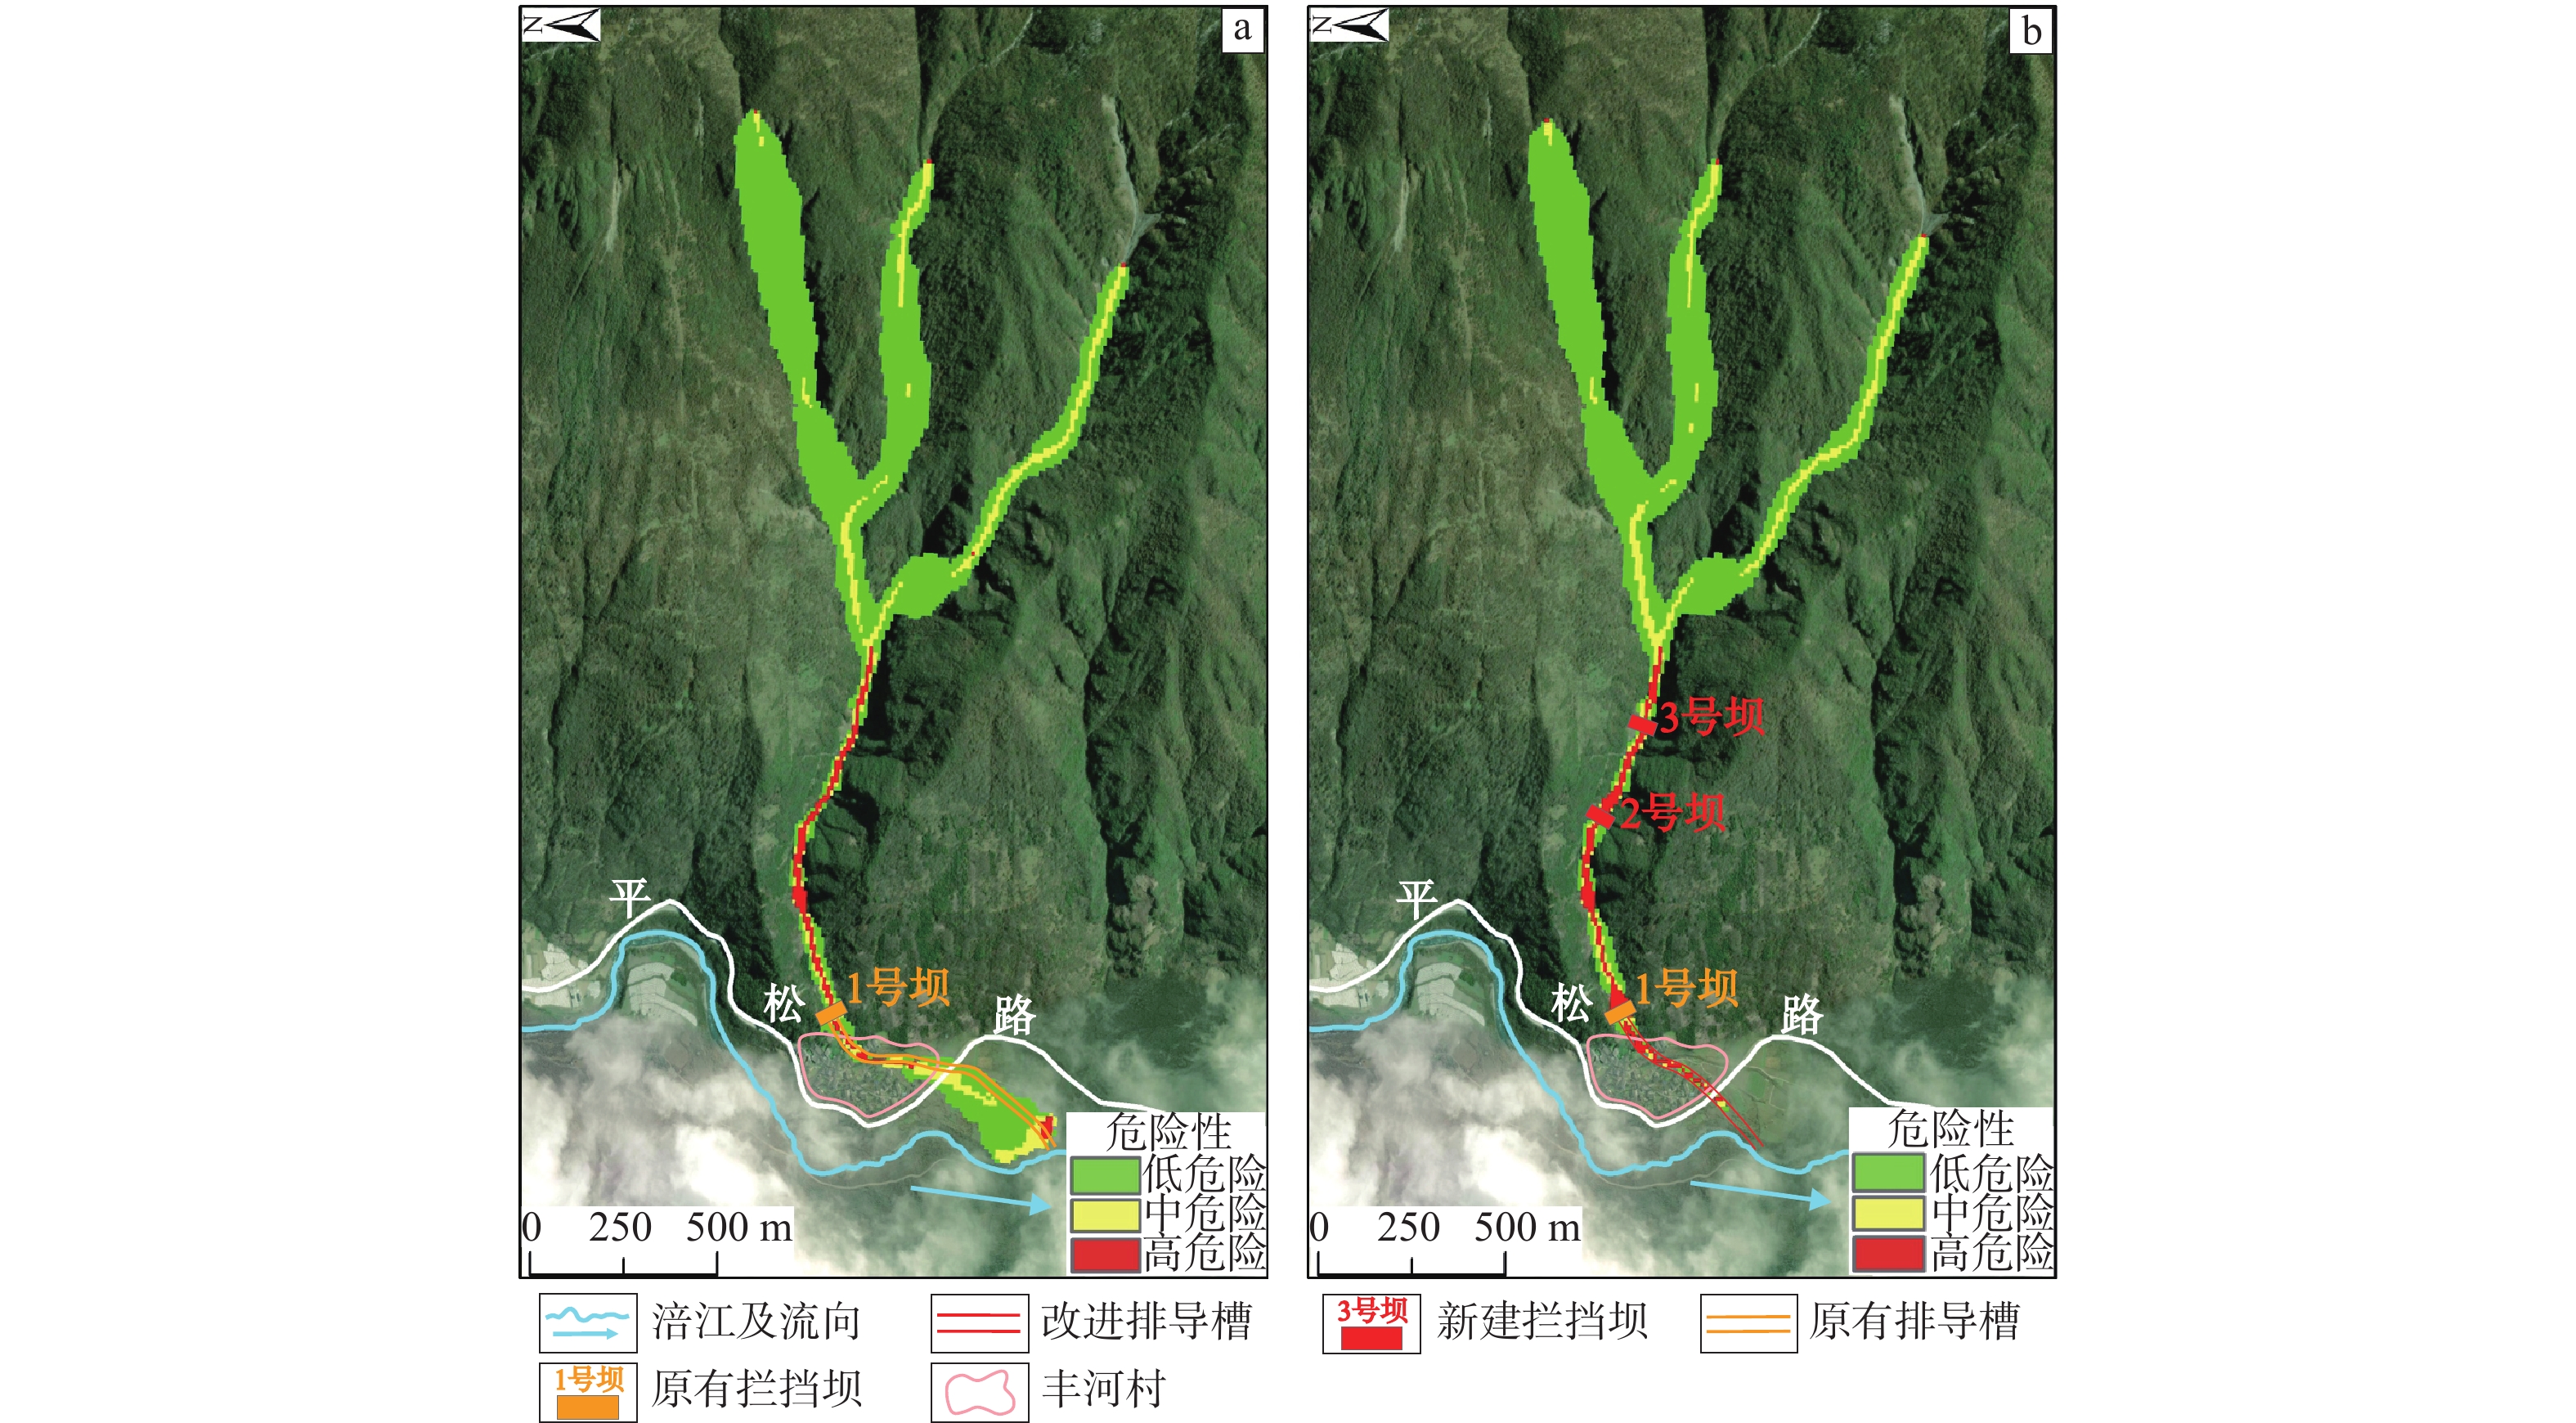
图 9 50年一遇降雨频率下不同防治工程的泥石流危险性分区
a—现有防治工程;b—防治工程改进后
Figure 9. Hazard distribution of debris flow in different control engineering conditions under 50-year rainfall frequency
(a) Under existing control engineering conditions; (b) After improvements in control engineering
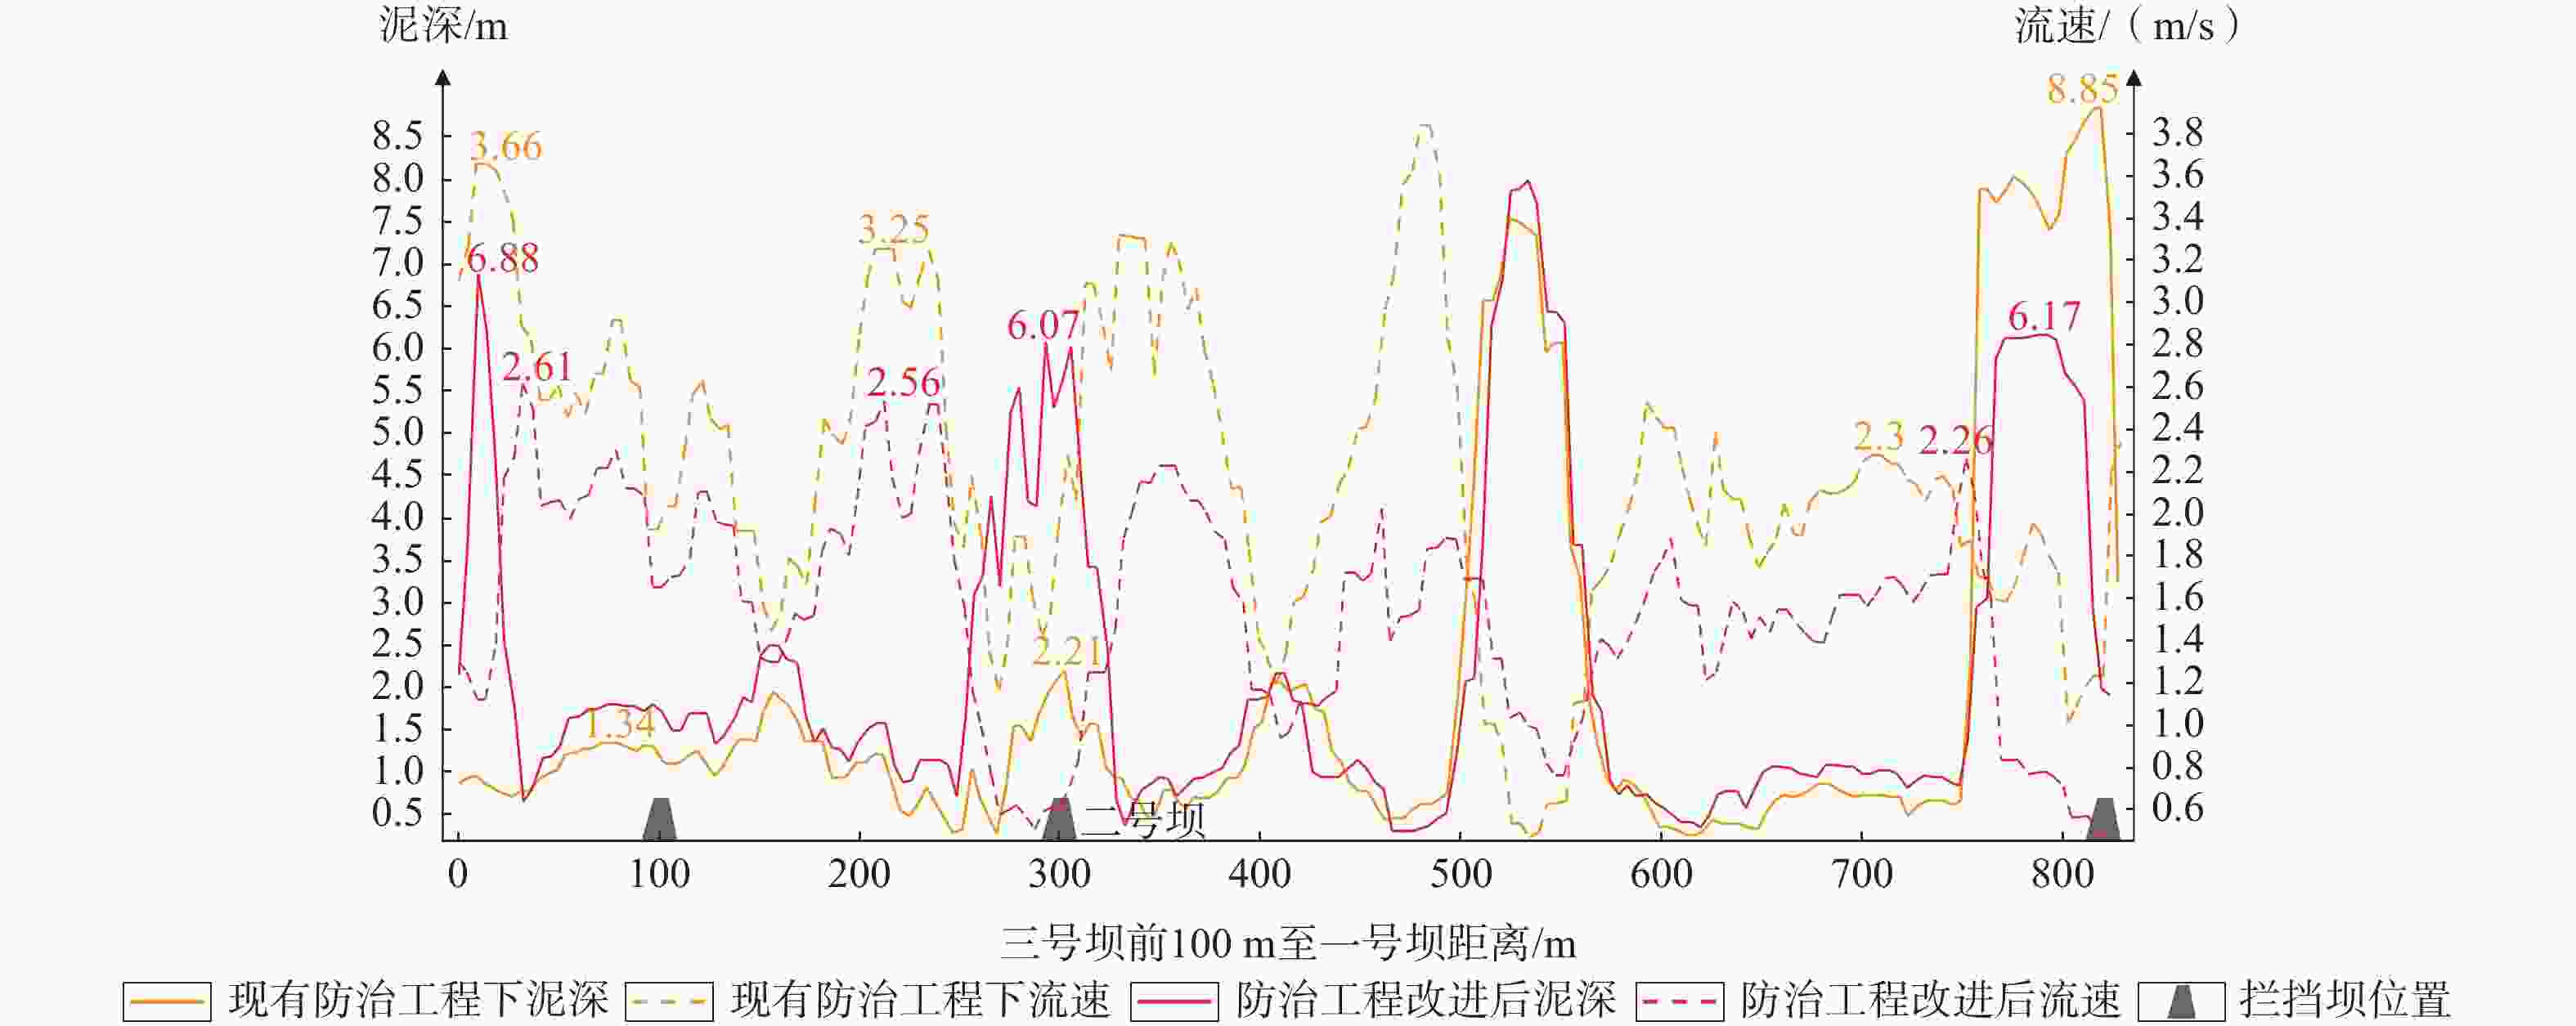
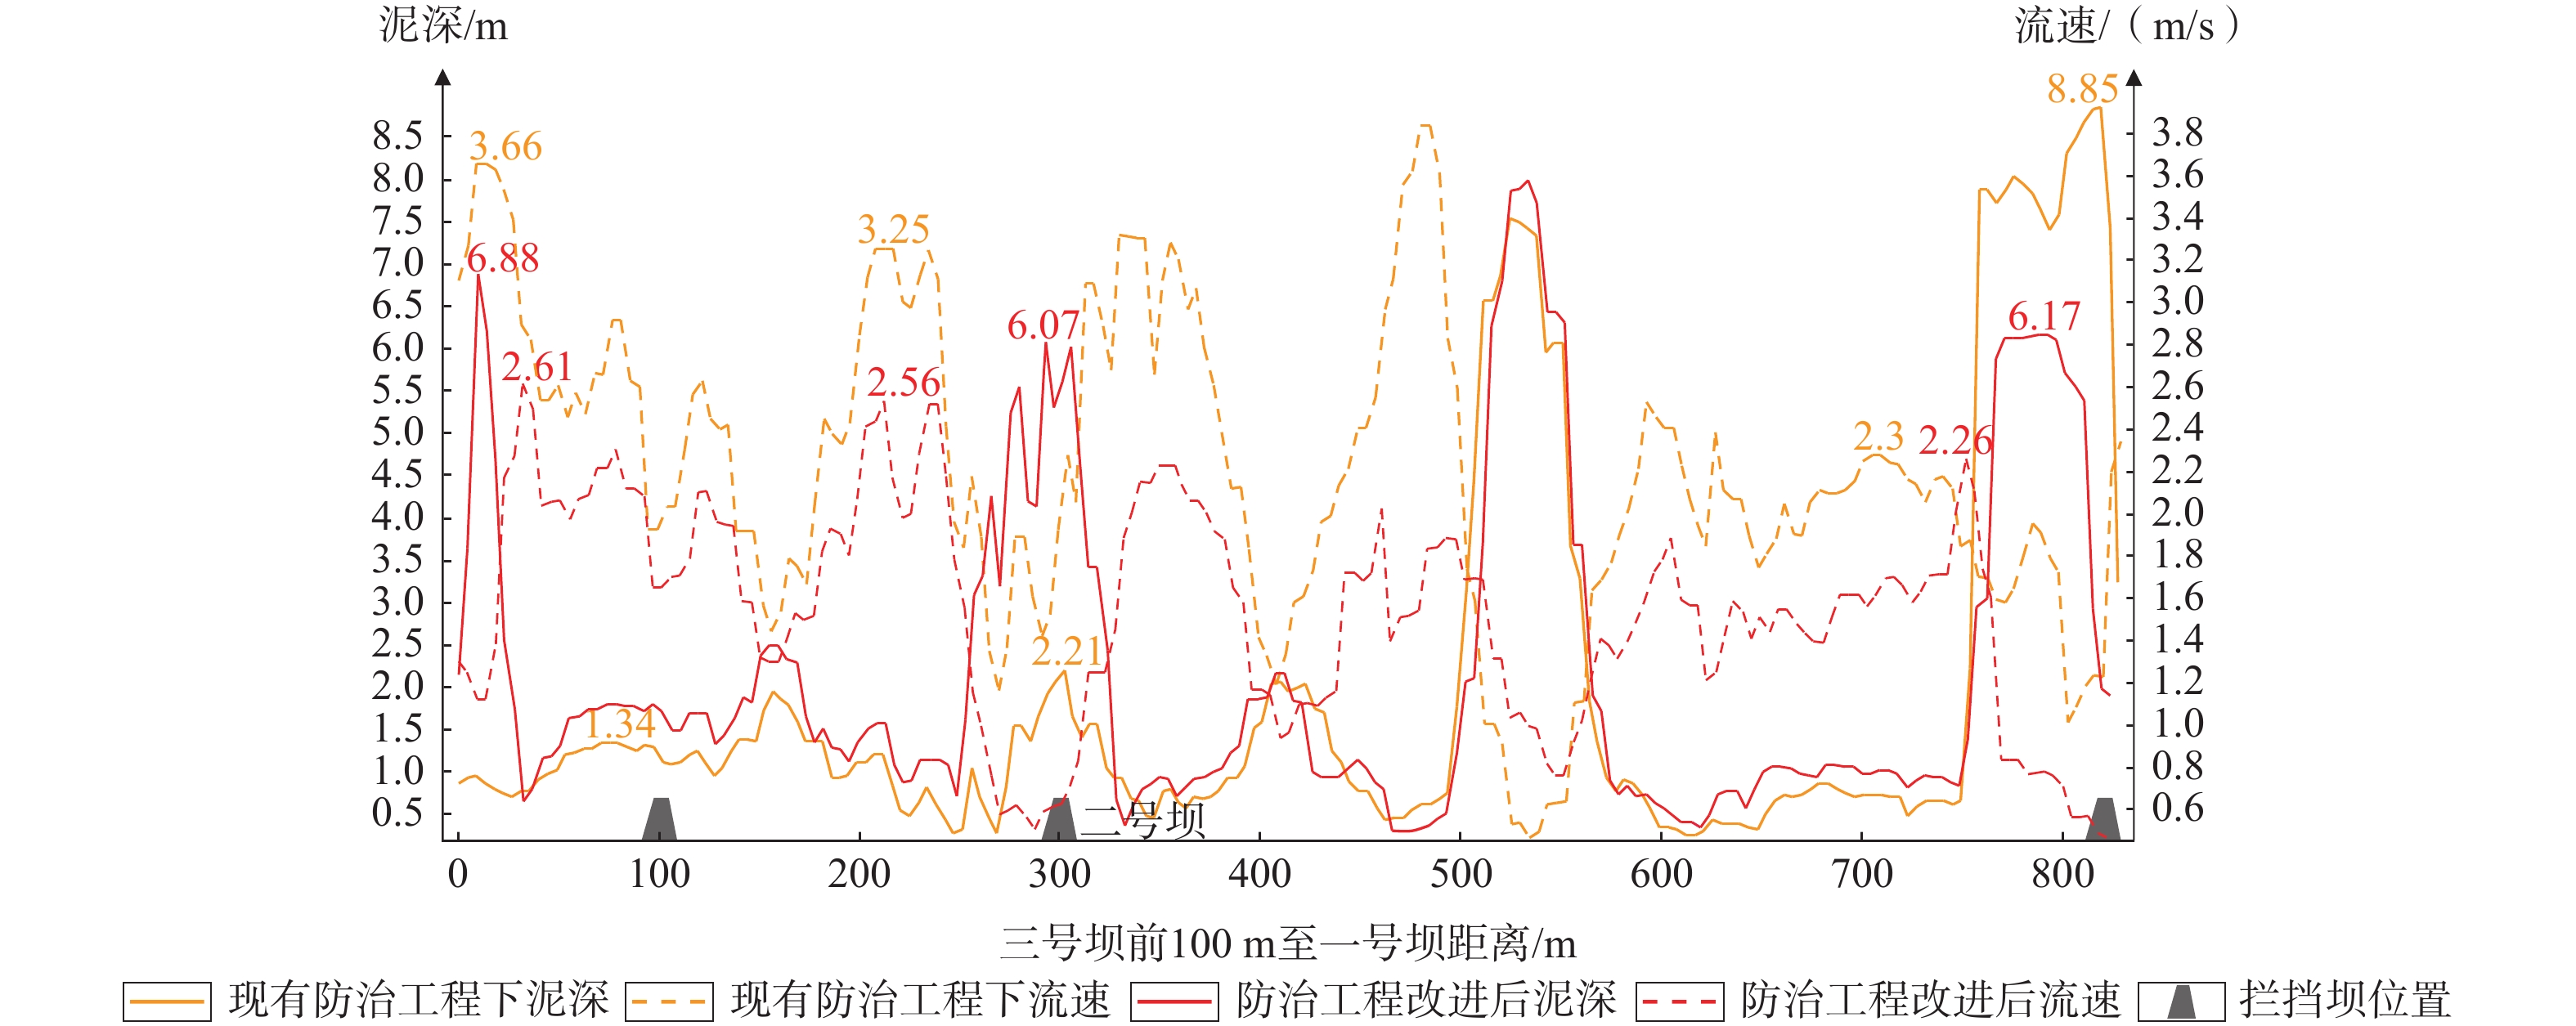
图 10 50年一遇降雨频率下不同防治工程的泥石流泥深及流速变化曲线
Figure 10. Change curve of mud depth and velocity of debris flow in different control engineering conditions under 50-year rainfall frequency
表 1 韩家沟流域崩滑体体积
Table 1. Static reserves of slumped masses in the Hanjia gully watershed
编号 崩滑体面积/×104 m2 体积/×104 m3 编号 崩滑体面积/×104 m2 体积/×104 m3 N1 2.29 6.66 S4 1.60 4.74 N2 0.69 2.13 S5 0.76 2.33 N3 0.24 0.78 S6 3.17 9.08 N4 0.63 1.95 W1 0.12 0.40 N5 0.26 0.84 W2 0.31 0.99 N6 0.50 1.57 W3 0.24 0.78 S1 0.17 0.56 W4 0.92 2.80 S2 3.69 10.49 W5 0.26 0.84 S3 0.62 1.92 W6 0.29 0.93 崩滑体总计 49.79 注:N、S、W分别为韩家沟流域内北侧、南侧、西侧  下载: 导出CSV
表 2 不同防治工程下的泥石流模拟结果
Table 2. Simulation results of debris flow under different control engineering conditions
降雨频率 模拟情况 拦挡坝数
量/座坝前100 m内最大
泥深/m坝前100 m内最大
流速/(m/s)堆积面积/
×104 m2泥石流堆积方量/
×104 m3威胁民宅面积/
×104 m210年一遇 ⅠP10 1 4.07(1号) 1.98(1号) 0.28 0.10 0 ⅡP10 3 1.05(1号)5.23(2号)6.2(3号) 1.40(1号)2.07(2号)2.04(3号) 0 0 0 50年一遇 ⅠP50 1 8.85(1号) 2.3(1号) 5.41 2.15 0.47 ⅡP50 3 6.17(1号)6.07(2号)6.88(3号) 2.26(1号)2.56(2号)2.61(3号) 0.76 1.07 0 注:1号为原有拦挡坝;2号、3号为新建拦挡坝
下载: 导出CSV
表 3 不同防治工程下堆积区的危险区面积、最大泥深与流速模拟结果
Table 3. Simulation results of hazardous area, maximum mud depth and velocity of accumulation area under different control engineering conditions
降雨频率 模拟情况 危险区面积/×104 m2 最大流速/(m/s) 最大泥深/m 高危险 中危险 低危险 10年一遇 ⅠP10 0 0.11 0.17 2.40 1.41 ⅡP10 0 0 0 0 0 50年一遇 ⅠP50 0.44 1.43 3.54 3.65 3.14 ⅡP50 0.35 0.12 0.29 3.40 3.90
下载: 导出CSV
表 4 泥石流危险性分区标准
Table 4. Debris flow hazard zoning standards
危险性 堆积深度/m 逻辑关系 堆积深度与流速乘积 高 H≥1.5 OR VH≥1.5 中 0.5<H<1.5 AND 0.5<VH<1.5 低 0.01≤H≤0.5 AND 0.1≤VH≤0.5
下载: 导出CSV
表 5 不同防治工程下泥石流危险性分区统计
Table 5. Statistics of hazard zones of debris flow under different control engineering conditions
降雨频率 模拟情况 危险区总面积
/×104 m2高危险区 中危险区 低危险区 面积
/×104 m2占总面积比例/% 面积
/×104 m2占总面积比例
/%面积
/×104 m2占总面积比例
/%10年一遇 ⅠP10 29.22 0.64 2.19 1.91 6.54 26.67 91.27 ⅡP10 28.79 0.62 2.15 1.83 6.36 26.34 91.49 50年一遇 ⅠP50 36.08 1.83 5.07 5.01 13.89 29.24 81.04 ⅡP50 31.56 1.99 6.31 3.99 12.64 25.58 81.05
下载: 导出CSV
表 6 韩家沟泥石流数值模拟精度
Table 6. Numerical simulation accuracy of Hanjia gully debris flow
沟名 堆积扇面积/×104 m2 $A_{\mathrm{c}} $ Sa Sn S0 韩家沟 5.15 5.41 4.57 75
下载: 导出CSV
-
[1] BONIELLO M A, CALLIGARIS C, LAPASIN R, et al., 2010. Rheo-logical investigation and simulation of a debris-flow event in the Fella watershed[J]. Natural Hazards and Earth System Sciences, 10(5): 989-997. doi: 10.5194/nhess-10-989-2010 [2] BERTOLO P, WIECZOREK G F, 2005. Calibration of numerical models for small debris flows in Yosemite Valley, California, USA[J]. Natural Hazards and Earth System Sciences, 5(6): 993-1001. doi: 10.5194/nhess-5-993-2005 [3] BOCCALI C, CALLIGARIS C, ZINI L, et al. , 2015. Comparison of scenarios after ten years: The influence of input parameters in Val Canale valley (Friuli Venezia Giulia, Italy)[M]//LOLLINO G, GIORDAN D, CROSTA G B, et al. Engineering geology for society and territory - volume 2: Landslide processes. Cham: Springer: 525-529. [4] CHANG M, LIU Y, ZHOU C, et al., 2020. Hazard assessment of a catastrophic mine waste debris flow of Hou Gully, Shimian, China[J]. Engineering Geology, 275: 105733. doi: 10.1016/j.enggeo.2020.105733 [5] CHEN P Y, YU H M, LIU Y, et al., 2013. Evaluation of debris flow risk based on independent information data fluctuation weighting method[J]. Rock and Soil Mechanics, 34(2): 449-454. (in Chinese with English abstract [6] CONG K, LI R D, BI Y H, 2019. Benefit evaluation of debris flow control engineering based on the FLO-2D model[J]. Northwestern Geology, 52(3): 209-216. (in Chinese with English abstract [7] CHEN H, DONG T X, LI Y, et al., 2020. Geomorphological characteristics and its response to fault activity in the upper reaches of the Fujiang Drainge Basin, China[J]. Mountain Research, 38(4): 542-551. (in Chinese with English abstract [8] CAO P, HOU S S, CHEN L, et al., 2021. Risk assessment of mass debris flow based on numerical simulation: An example from the Malu River Basin in Min County[J]. The Chinese Journal of Geological Hazard and Control, 32(2): 100-109. (in Chinese with English abstract [9] DU X J, SUN S Q, ZHAO Z, et al., 2016. Research on engineering control effect on Hongchun Gully debris based on FLO-2D model[J]. Earth and Environment, 44(3): 376-381. (in Chinese with English abstract [10] FU G C, LV T Y, SUN D X, et al., 2017. Seismogenic structure of the MS7.0 earthquake on August 8, 2017 in Jiuzhaigou, Sichuan[J]. Journal of Geomechanics, 23(6): 799-809. (in Chinese with English abstract [11] FANG Q S, TANG C, WANG Y, et al., 2016. A calculation method for predicting dynamic reserve and the total amount of material source of the debris flows in the Wenchuan meizoseismal area[J]. Journal of Disaster Prevention and Mitigation Engineering, 36(6): 1008-1014. (in Chinese with English abstract [12] GREGORETTI C, STANCANELLI L M, BERNARD M, et al., 2019. Relevance of erosion processes when modelling in-channel gravel debris flows for efficient hazard assessment[J]. Journal of Hydrology, 568: 575-591. doi: 10.1016/j.jhydrol.2018.10.001 [13] LIU X L, TANG C, FANG Q S, et al., 2017. Hazard assessment of dam-breaking debris flow based on numerical simulation[J]. Journal of Sediment Research, 42(6): 28-34. (in Chinese with English abstract [14] LI B X, CAI Q, SONG J, et al., 2022. Risk assessment of debris flow hazard based on FLO-2D: A case study of debris flow in Maiduo Gully[J]. Journal of Natural Disasters, 31(4): 256-265. (in Chinese with English abstract [15] MA S Q, YANG W M, ZHANG C S, et al., 2022. Provenance characteristics and risk analysis of debris flows in Siergou, Lanzhou city[J]. Journal of Geomechanics, 28(6): 1059-1070. (in Chinese with English abstract [16] Ministry of Land and Resources of the People's Republic of China, 2006. Specification of geological investigation for debris flow stabilization: DZ/T 0220-2006[S]. Beijing: Standards Press of China. (in Chinese) [17] O’BRIEN J S, 2009. FLO-2D Reference manual version 2009[R]. Arizona: FLO -2D software, Inc. [18] O’BRIEN J S, JULIEN P Y, FULLERTON W T, 1993. Two-dimensional water flood and mudflow simulation[J]. Journal of Hydraulic Engineering, 119(2): 244-261. doi: 10.1061/(ASCE)0733-9429(1993)119:2(244) [19] SHANG H, WANG M X, LUO D H, et al., 2019. Single gully debris flow hazard assessment based on function assignment model and fuzzy comprehensive evaluation method[J]. The Chinese Journal of Geological Hazard and Control, 30(1): 61-69. (in Chinese with English abstract [20] SHAO Y X, JI Y, YAN B Q, et al., 2021. Daqinggou debris flow hazard investigation and evaluation in Renhe, Panzhihua of Sichuan[J]. Journal of Agricultural Catastrophology, 11(5): 145-150. (in Chinese with English abstract [21] TAN C, CHEN J P, LI H Z, et al., 2012. Application of weighted distance discriminant analysis in debris flow risk assessment[J]. Journal of Jilin University (Earth Science Edition), 42(6): 1847-1852. (in Chinese with English abstract [22] TANG C, ZHOU J Q, ZHU J, et al., 1994. A study on the risk zoning of debris flow on alluvial fans by applying technology of numerical simulation[J]. Journal of Catastrophology, 9(4): 7-13. (in Chinese with English abstract [23] TANG H, TANG C, CHEN M, et al., 2019. Numerical simulation and analysis of debris flow prevention engineering effects in strong earthquake area[J]. Bulletin of Soil and Water Conservation, 39(4): 196-201. (in Chinese with English abstract [24] WEI B B, ZHAO Q H, HAN G, et al., 2013. Grey correlation method based hazard assessment of debris flow in quake-hit area-taking debris flows in Beichuan as an example[J]. Journal of Engineering Geology, 21(4): 525-533. (in Chinese with English abstract [25] WU Y H, LIU K F, CHEN Y C, 2013. Comparison between FLO-2D and Debris-2D on the application of assessment of granular debris flow hazards with case study[J]. Journal of Mountain Science, 10(2): 293-304. doi: 10.1007/s11629-013-2511-1 [26] WANG N N, TANG C, 2014. Numerical simulation of Huangyang Gully debris flow Longchi town Dujiangyan city based on FLO-2D[J]. Journal of Geological Hazards and Environment Preservation, 25(1): 107-112. (in Chinese with English abstract [27] WANG J, DING M T, HUANG Y, 2016. Debris flow motion feature and control measures of Lianhexi Valley based on FLO-2D[J]. Journal of Southwest University of Science and Technology, 31(2): 59-66. (in Chinese with English abstract [28] WANG G F, CHEN Z L, MAO J R, et al., 2020. Debris flow risk assessment in Bailong River Basin under different engineering scenarios and rainfall frequency conditions[J]. Journal of Shandong University of Science and Technology (Natural Science), 39(5): 30-40. (in Chinese with English abstract [29] WU J H, ZHANG C S, YANG W M, et al., 2022. Risk assessment of debris flow in Zhujiagully watershed based on entropy weight coefficient of variation fusion algorithm and FLO-2D[J]. Journal of Natural Disasters, 31(1): 81-91. (in Chinese with English abstract [30] WANG Y Y, ZHAN Q D, HAN W L, et al., 2003. Stress-strain properties of viscous debris flow and determination of volocity parameter[J]. The Chinese Journal of Geological Hazard and Control, 14(1): 9-13. (in Chinese with English abstract [31] YANG H L, FAN X Y, JIANG Y J, 2017. Analysis of engineering treatment effect of debris flow based on FLO-2D: Case of Yindongzi gully in Dujiangyan city[J]. Yangtze River, 48(17): 66-71, 95. (in Chinese with English abstract [32] YAO X, ZHOU Z K, LI L J, et al., 2017. InSAR co-seismic deformation of 2017 MS7.0 Jiuzhaigou earthquake and discussions on seismogenic tectonics[J]. Journal of Geomechanics, 23(4): 507-514. (in Chinese with English abstract [33] ZHANG C S, ZHANG Y C, MA Y S, 2003. Regional dangerous on the geological hazards of collapse, landslide and debris flow in the upper reaches of the Yellow River[J]. Journal of Geomechanics, 9(2): 143-153. (in Chinese with English abstract [34] ZHANG H W, LIU F Z, WANG J C, et al., 2022. Hazard assessment of debris flows in Kongpo Gyamda, Tibet based on FLO-2D numerical simulation[J]. Journal of Geomechanics, 28(2): 306-318. (in Chinese with English abstract [35] ZHANG F X, ZHANG L Q, ZHOU J, et al., 2019. Risk assessment of debris flow in Ruoru Village, Tibet based on FLO-2D[J]. Journal of Water Resources and Water Engineering, 30(5): 95-102. (in Chinese with English abstract [36] ZHANG X Z, TIE Y B, LI G H, et al., 2022. Characteristics and risk assessment of debris flows in the Wandong catchment after the MS6.8 Luding earthquake[J]. Journal of Geomechanics, 28(6): 1035-1045. (in Chinese with English abstract [37] 丛凯,李瑞冬,毕远宏,2019. 基于FLO-2D模型的泥石流治理工程效益评价[J]. 西北地质,52(3):209-216. [38] 陈浩,董廷旭,李勇,等,2020. 涪江上游流域地貌特征及其对断裂活动性的响应[J]. 山地学报,38(4):542-551. [39] 陈鹏宇,余宏明,刘勇,等,2013. 基于独立信息数据波动赋权的泥石流危险度评价[J]. 岩土力学,34(02):449-454. [40] 曹鹏,侯圣山,陈亮,等,2021. 基于数值模拟的群发性泥石流危险性评价:以甘肃岷县麻路河流域为例[J]. 中国地质灾害与防治学报,32(2):100-109. [41] 杜雪剑,孙书勤,赵峥,等,2016. 基于FLO-2D模型的红椿沟泥石流工程治理效果研究[J]. 地球与环境,44(3):376-381. [42] 付国超,吕同艳,孙东霞,等,2017. 2017年8月8日四川九寨沟7.0级地震发震构造浅析[J]. 地质力学学报,23(6):799-809. [43] 方群生,唐川,王毅,等,2016. 汶川极震区泥石流动储量与总物源量计算方法研究[J]. 防灾减灾工程学报,36(6):1008-1014. [44] 高士麟,2021. 四川省小流域设计洪水分析及应用[J]. 四川建筑,41(5):230-233. doi: 10.3969/j.issn.1007-8983.2021.05.075 [45] 刘鑫磊,唐川,方群生,等,2017. 基于数值模拟的溃决型泥石流危险性评价研究[J]. 泥沙研究,42(6):28-34. [46] 李宝幸,蔡强,宋军,等,2022. 基于FLO-2D的泥石流灾害风险评价:以麦多沟泥石流为例[J]. 自然灾害学报,31(4):256-265. [47] 马思琦,杨为民,张春山,等,2022. 兰州市寺儿沟泥石流物源特征及其危险性分析[J]. 地质力学学报,28(6):1059-1070. doi: 10.12090/j.issn.1006-6616.20222829 [48] 尚慧,王明轩,罗东海,等,2019. 基于函数赋值模型与模糊综合评判法的单沟泥石流危险性评价[J]. 中国地质灾害与防治学报,30(1):61-69. [49] 邵玉祥,计扬,严步青,等,2021. 四川攀枝花仁和区大箐沟泥石流调查及危险性评价[J]. 农业灾害研究,11(5):145-150. doi: 10.3969/j.issn.2095-3305.2021.05.058 [50] 唐川,周钜乾,朱静,等,1994. 泥石流堆积扇危险度分区评价的数值模拟研究[J]. 灾害学,9(4):7-13. [51] 唐海,唐川,陈明,等,2019. 强震区泥石流防治工程效果数值模拟分析[J]. 水土保持通报,39(4):196-201. [52] 谭春,陈剑平,李会中,等,2012. 加权距离判别法在泥石流危险度评价中的应用[J]. 吉林大学学报(地球科学版),42(06):1847-1852. [53] 魏斌斌,赵其华,韩刚,等,2013. 基于灰色关联法的地震灾区泥石流危险性评价:以北川县泥石流为例[J]. 工程地质学报,21(4):525-533. doi: 10.3969/j.issn.1004-9665.2013.04.007 [54] 王纳纳,唐川,2014. 基于FLO-2D的都江堰市龙池镇黄央沟泥石流数值模拟[J]. 地质灾害与环境保护,25(1):107-112. doi: 10.3969/j.issn.1006-4362.2014.01.020 [55] 王骏,丁明涛,黄英,2016. 基于FLO-2D的联合溪沟泥石流运动特征及防治对策[J]. 西南科技大学学报,31(2):59-66. doi: 10.3969/j.issn.1671-8755.2016.02.012 [56] 王高峰,陈宗良,毛佳睿,等,2020. 不同工程情景和降雨频率工况下白龙江流域泥石流危险性评价[J]. 山东科技大学学报(自然科学版),39(5):30-40. [57] 吴季寰,张春山,杨为民,等,2022. 基于熵权变异系数融合算法和FLO-2D的朱家沟流域泥石流危险性评价[J]. 自然灾害学报,31(1):81-91. [58] 王裕宜,詹钱登,韩文亮,等,2003. 粘性泥石流体的应力应变特性和流速参数的确定[J]. 中国地质灾害与防治学报,14(1):9-13. doi: 10.3969/j.issn.1003-8035.2003.01.002 [59] 杨海龙,樊晓一,姜元俊,2017. 基于FLO-2D的泥石流工程治理效果分析:以都江堰银洞子沟泥石流为例[J]. 人民长江,48(17):66-71,95. [60] 姚鑫,周振凯,李凌婧,等,2017. 2017年四川九寨沟MS7.0地震InSAR同震形变场及发震构造探讨[J]. 地质力学学报,23(4):507-514. doi: 10.3969/j.issn.1006-6616.2017.04.001 [61] 张春山,张业成,马寅生,2003. 黄河上游地区崩塌、滑坡、泥石流地质灾害区域危险性评价[J]. 地质力学学报,9(2):143-153. doi: 10.3969/j.issn.1006-6616.2003.02.007 [62] 张浩韦,刘福臻,王军朝,等,2022. 基于FLO-2D数值模拟的工布江达县城泥石流灾害危险性评价[J]. 地质力学学报,28(2):306-318. [63] 张奋翔,张路青,周剑,等,2019. 基于FLO-2D的西藏若如村泥石流危险性分析[J]. 水资源与水工程学报,30(5):95-102. [64] 张宪政,铁永波,李光辉,等,2022. 四川泸定MS6.8级地震区湾东河流域泥石流活动性预测[J]. 地质力学学报,28(6):1035-1045. doi: 10.12090/j.issn.1006-6616.20222827 [65] 中华人民共和国国土资源部,2006. 泥石流灾害防治工程勘查规范:DZ/T 0220-2006[S]. 北京:中国标准出版社. -

 下载:
下载:


计量
- 文章访问数: 1103
- HTML全文浏览量: 250
- PDF下载量: 71
- 被引次数: 0
