

Quantitative staging of alluvial fan geomorphic surfaces in arid areas based on SAR imagery: A case study of the Shule River alluvial fan in the western desert region of the Hexi Corridor
-
摘要: 河流作用形成的洪积扇和河流阶地可以提供过去构造活动、气候变化和地貌演变过程的有效记录;而准确划分洪积扇地貌面的期次是开展环境变化及构造活动定量研究的基础。已有研究往往利用L波段数据SAR后向散射系数值作为地貌粗糙度替代参数,进行地貌面定量分期,但并未考虑不同时间数据源对分期结果的影响。以疏勒河洪积扇为研究对象,通过分析多时相L波段SAR数据后验统计指标以及大气评估条件,确定最佳数据源,并运用最大似然分类法对后向散射强度值进行分类,以实现地貌面的定量分期。结果表明:使用分期后验统计指标作为选取最佳时像影像数据的标准,可以获得更好的分期结果;L波段HH单极化数据可得到较好的分期结果,与C波段数据相比,对于不同年龄地貌面的划分更具优势,且数据更易获取,具备自动化分期潜力;SAR影像质量以及分期结果与成像时大气条件密切相关,而与季节相关性不大,因此建议优先选择成像时地表含水量较低的影像,例如,高蒸发强度的夏季。文章提出的这套对遥感数据质量分析并进行地貌面分期的方法可用于完成干旱地区大尺度冲/洪积扇的快速定量分期,为构造和气候的研究提供有价值的信息。Abstract: The alluvial fans and river terraces formed by river processes effectively record past tectonic activities, climate changes, and geomorphic evolution processes. Accurately dividing the alluvial fan into stages is the basis for the subsequent research. Previous researchers used L-band SAR backscatter coefficient values as a substitute parameter for geomorphic roughness to achieve quantitative zoning of geomorphic surfaces. However, these studies did not consider the impact of different time data sources on the geomorphic surface results. This study selects the Shule River alluvial fan as the research object. It determines the optimal data source by analyzing the posterior statistical indicators of multi-temporal L-band SAR data and evaluating atmospheric conditions. The maximum likelihood classification method is used to complete the classification of backscatter intensity values and achieve quantitative staging of the geomorphic surface. The results indicate that the posterior statistical indicators of staging can be used as the standard for selecting the best temporal image data to obtain better staging results. L-band HH monopolarization data provides better staging results, demonstrating advantages in distinguishing landforms of different ages compared to C-band data. Moreover, L-band data is more accessible and holds potential for automated staging. SAR image quality and staging results are closely related to imaging atmospheric conditions but show minimal seasonal dependence. Therefore, the study recommends prioritizing images with low surface water content during imaging, such as in high-evaporation intensity summer seasons. The proposed method for analyzing remote sensing data quality and staging landforms can be applied to rapidly and quantitatively stage large-scale alluvial fans in arid regions, providing valuable information for studies on tectonics and climate.
-

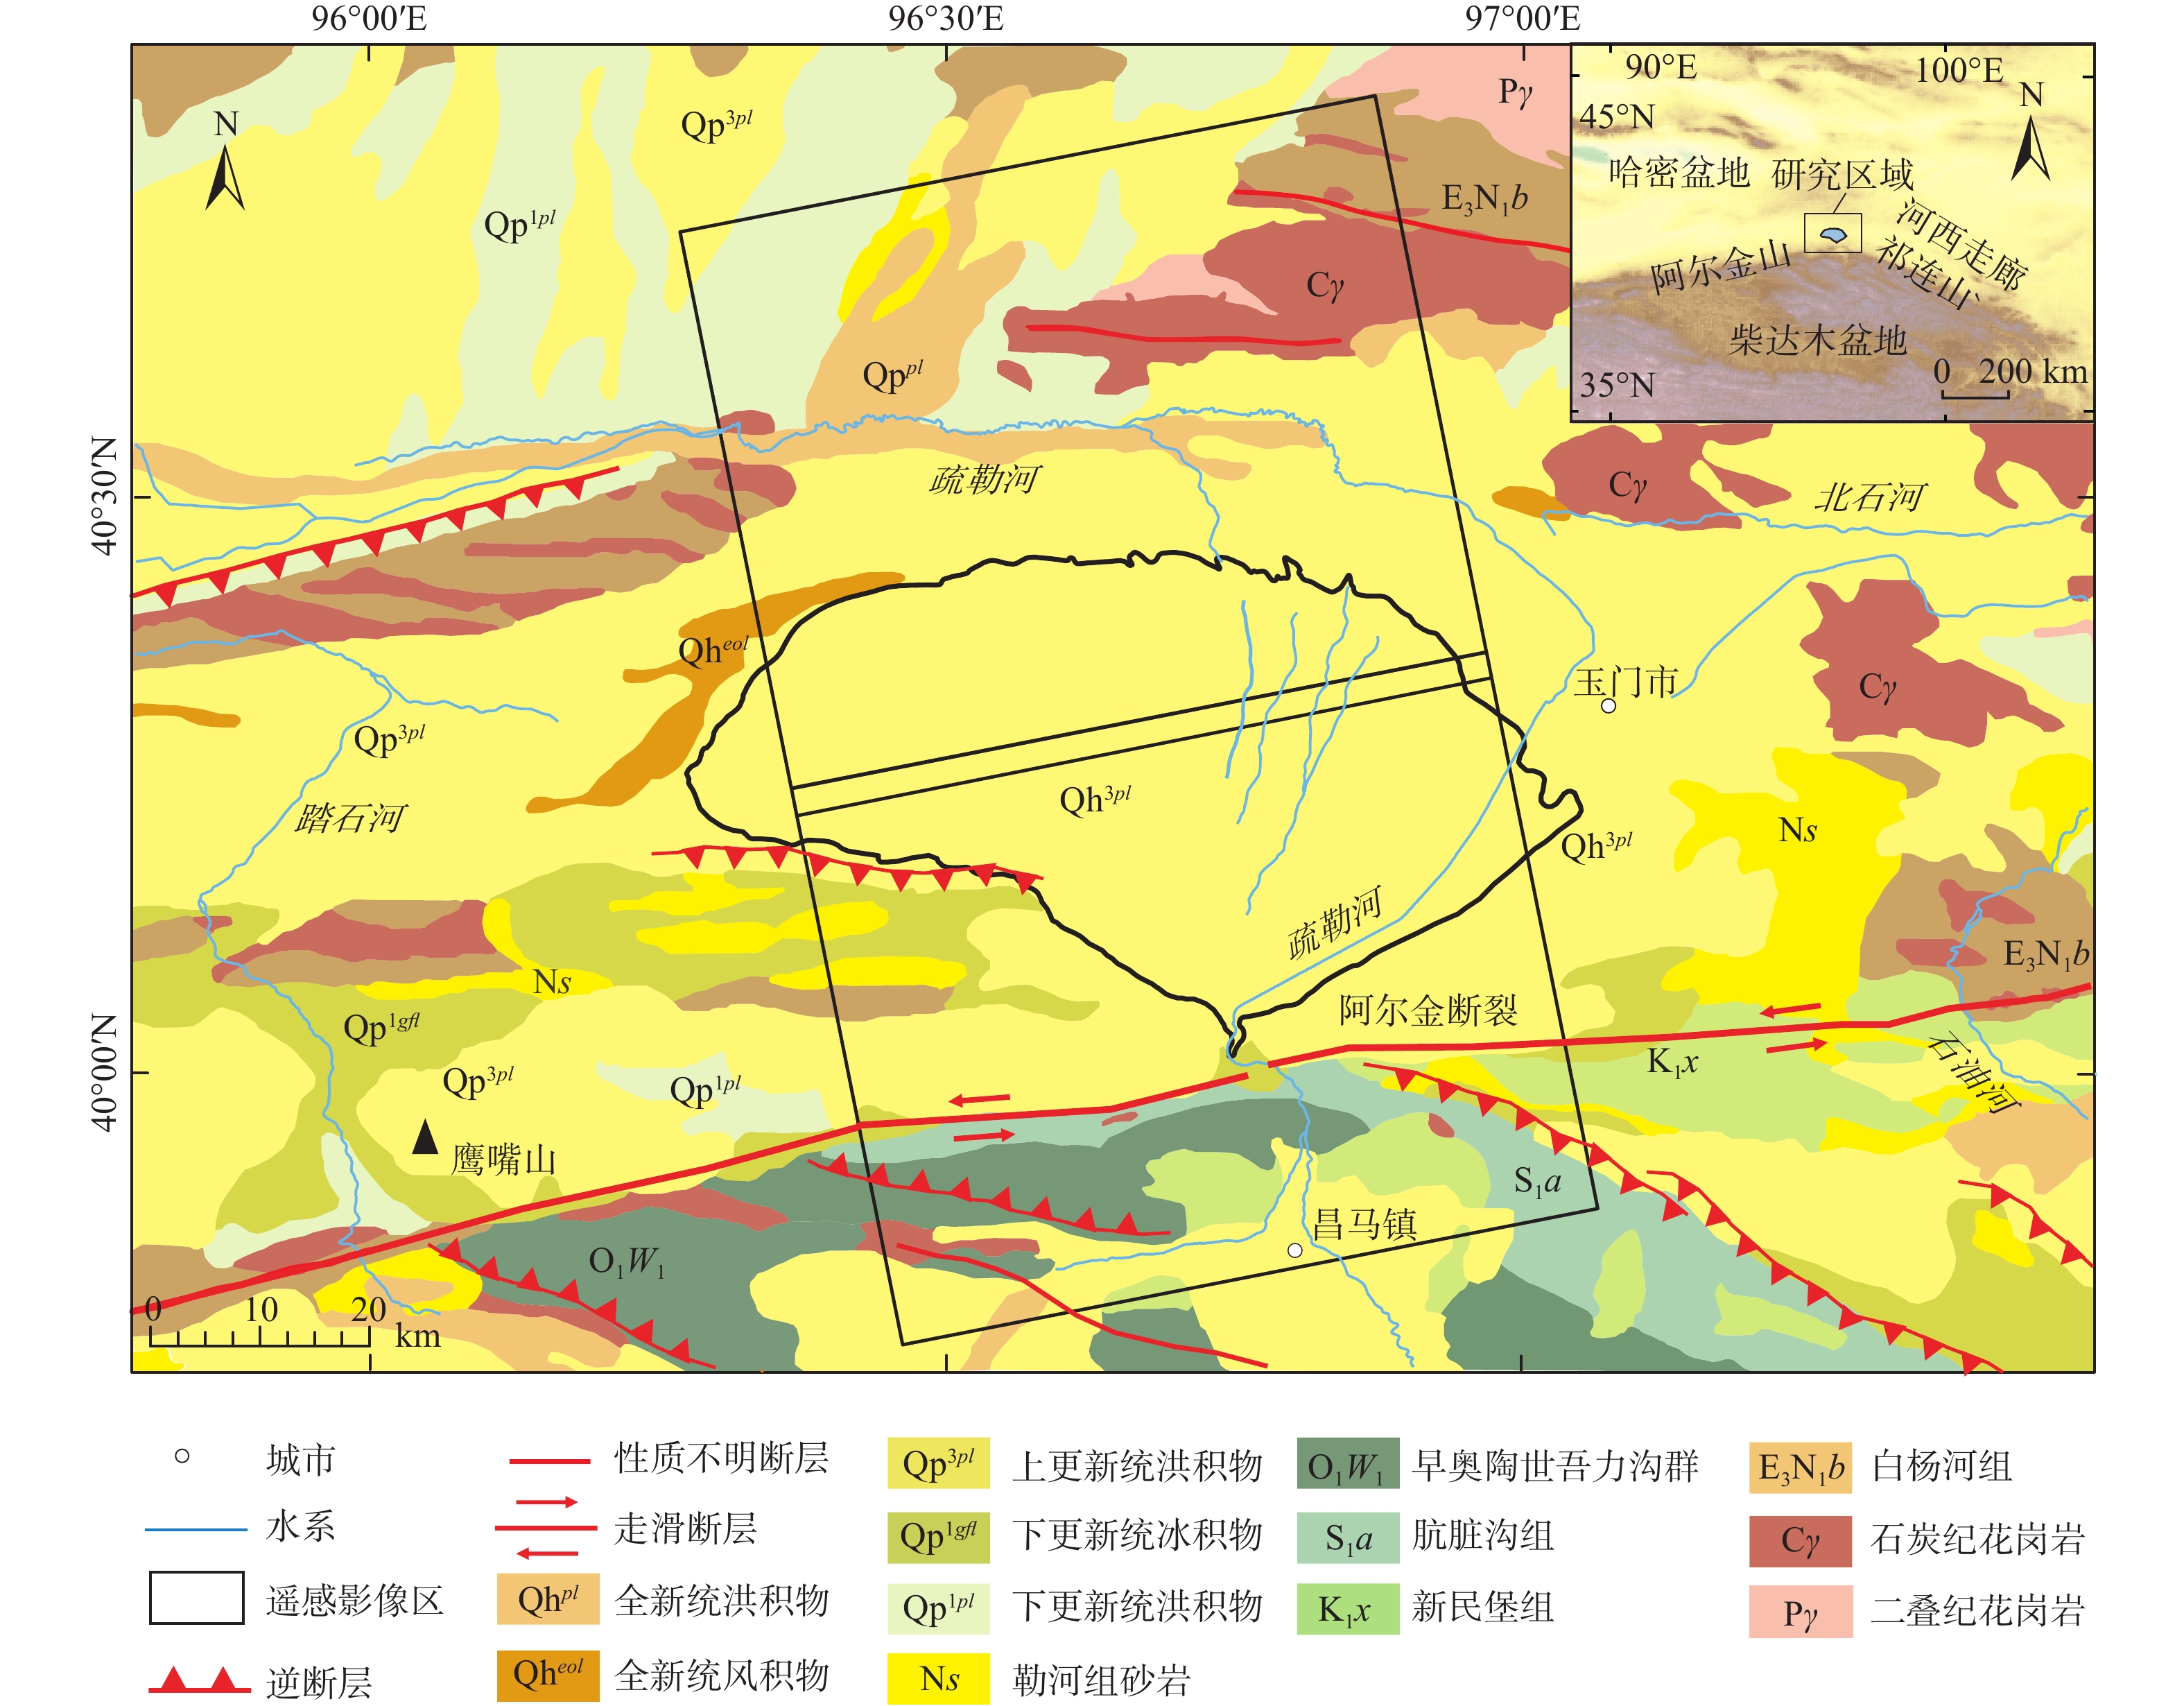
图 1 疏勒河洪积扇地区地质构造图(引自《1︰50万中国地质图》公开版(
http://www.ngac.org.cn );断裂分布据Zelenin et al.,2022修改)Figure 1. Tectonic map of the diluvial fan area of Shule River (The geological map is quoted from the public version of the 1:500000 Geological Map of China at http://www.ngac.org.cn; Fracture distribution is modified after Zelenin et al.,2022)
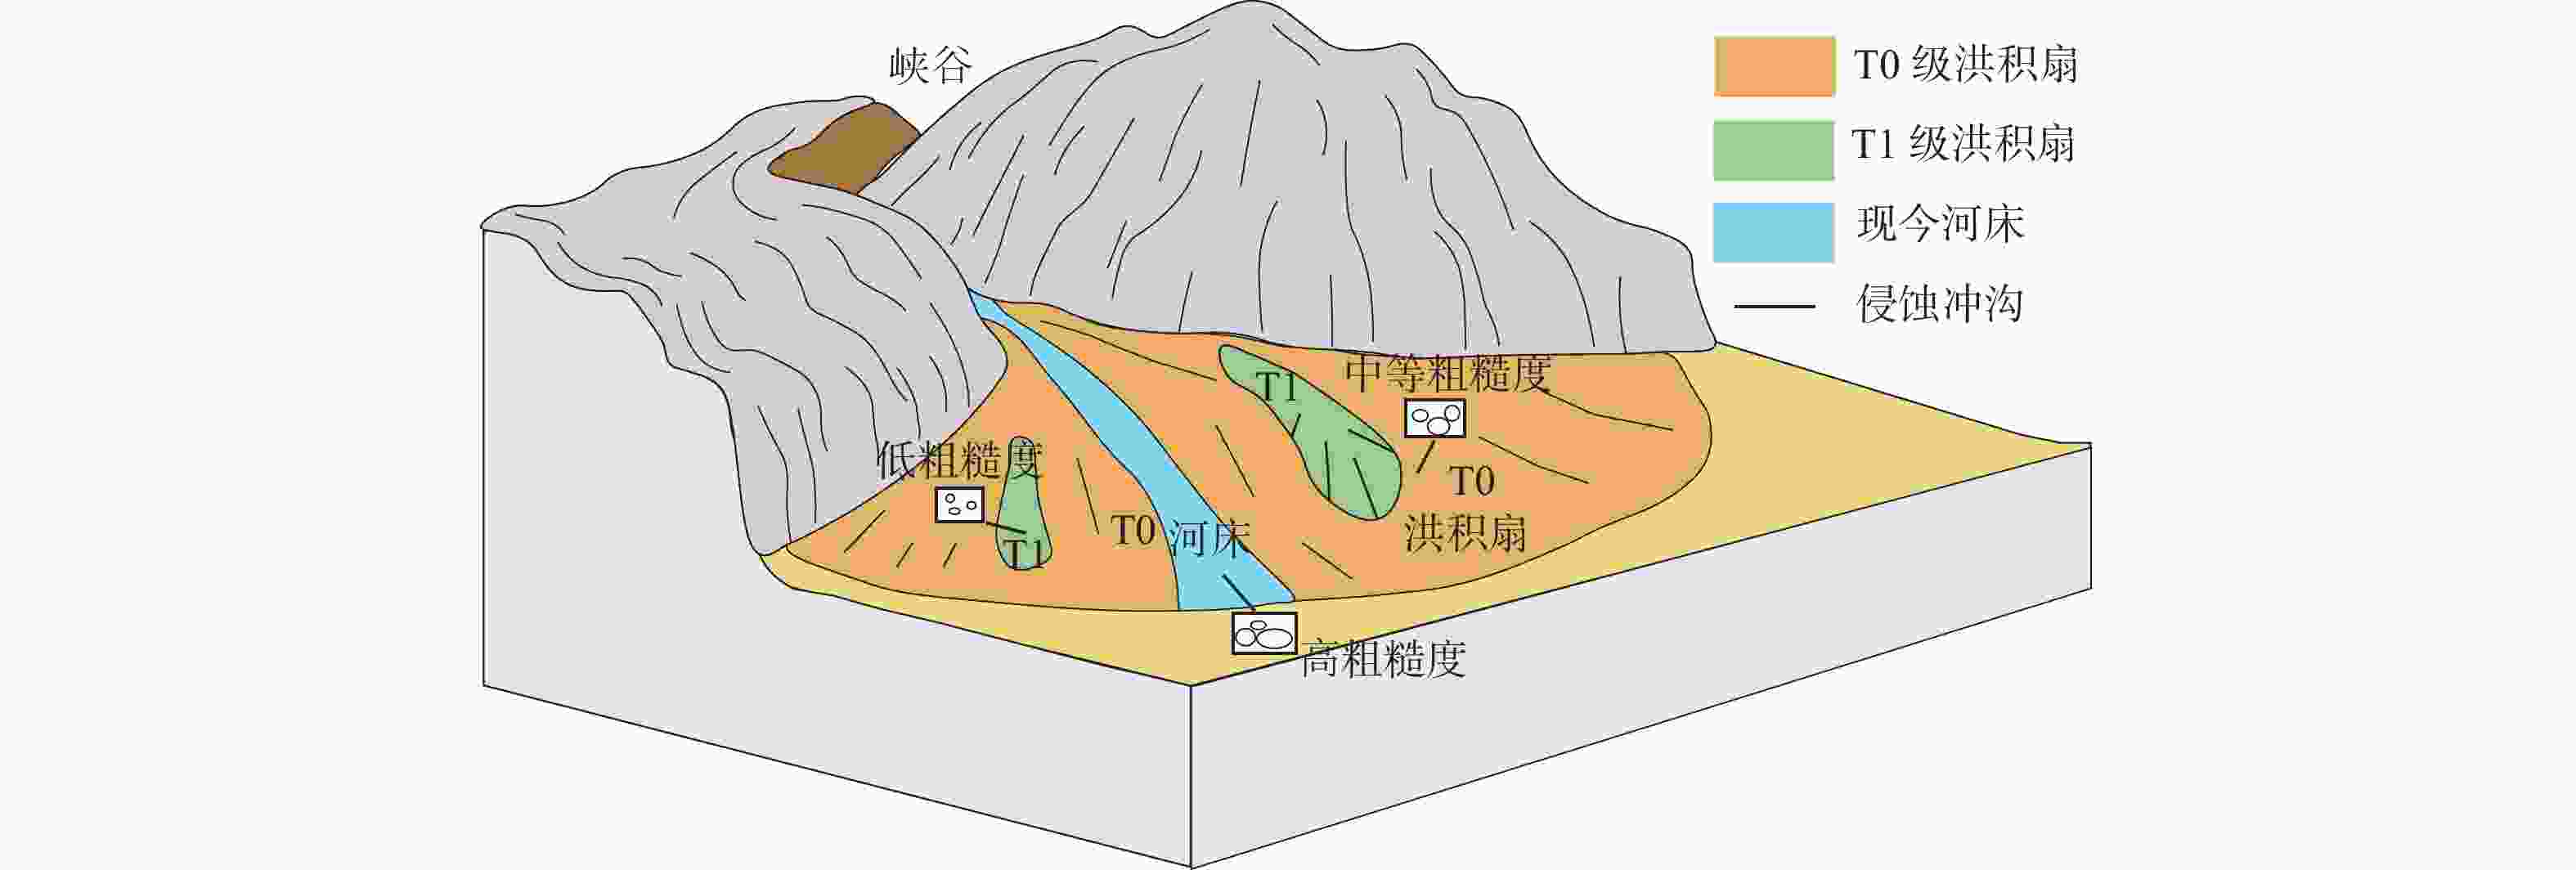
图 2 洪积扇演化示意图(据Blair and McPherson,1994修改)
Figure 2. Schematic diagram of the evolution of alluvial fans (modified after Blair and McPherson,1994)

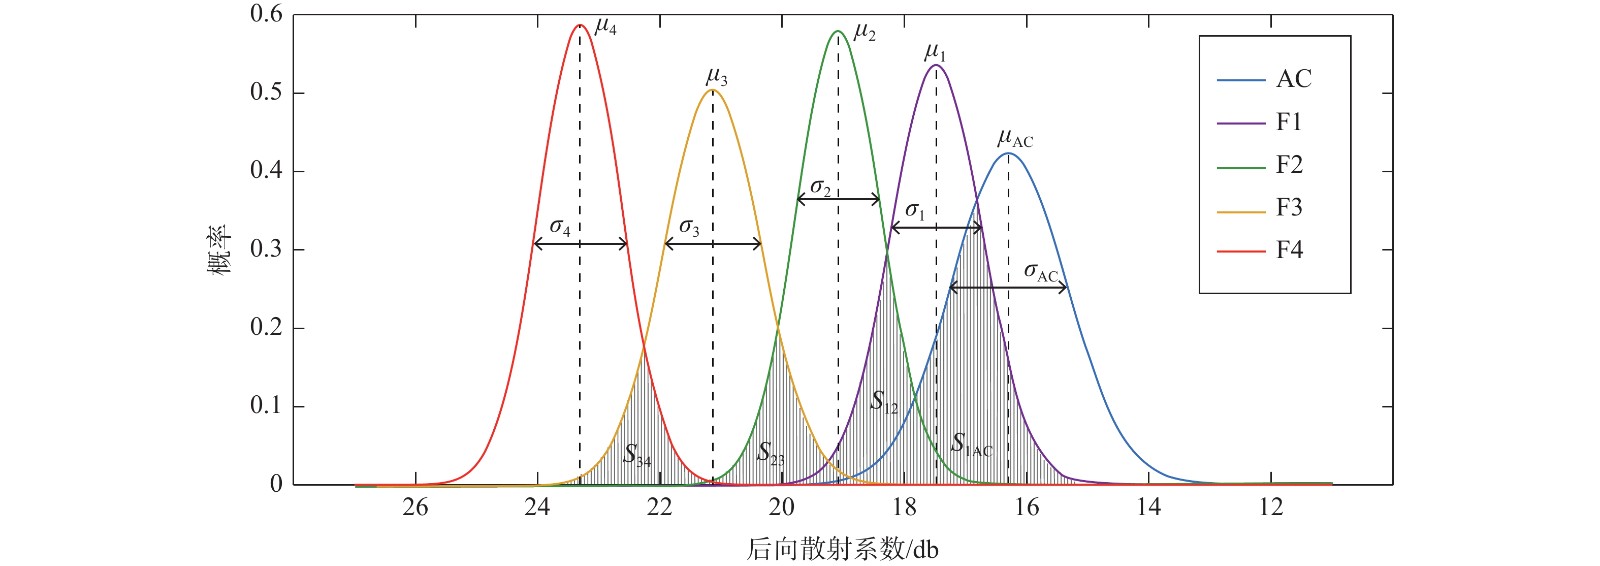
图 4 各期地貌面后向散射强度值正态分布概率密度曲线离散程度与区分程度
F1—F4对应不同期地貌面;AC为现今河床区域;μ为均值,σ为标准差;S为重叠面积
Figure 4. Calculation method of dispersion degree and discrimination degree of normal distribution probability density curve of backscatter intensity values of various geomorphic surfaces F1 to F4 correspond to different stages of landforms; AC represents the current riverbed area; μ denotes the mean, σ is the standard deviation; S stands for the overlapping area.

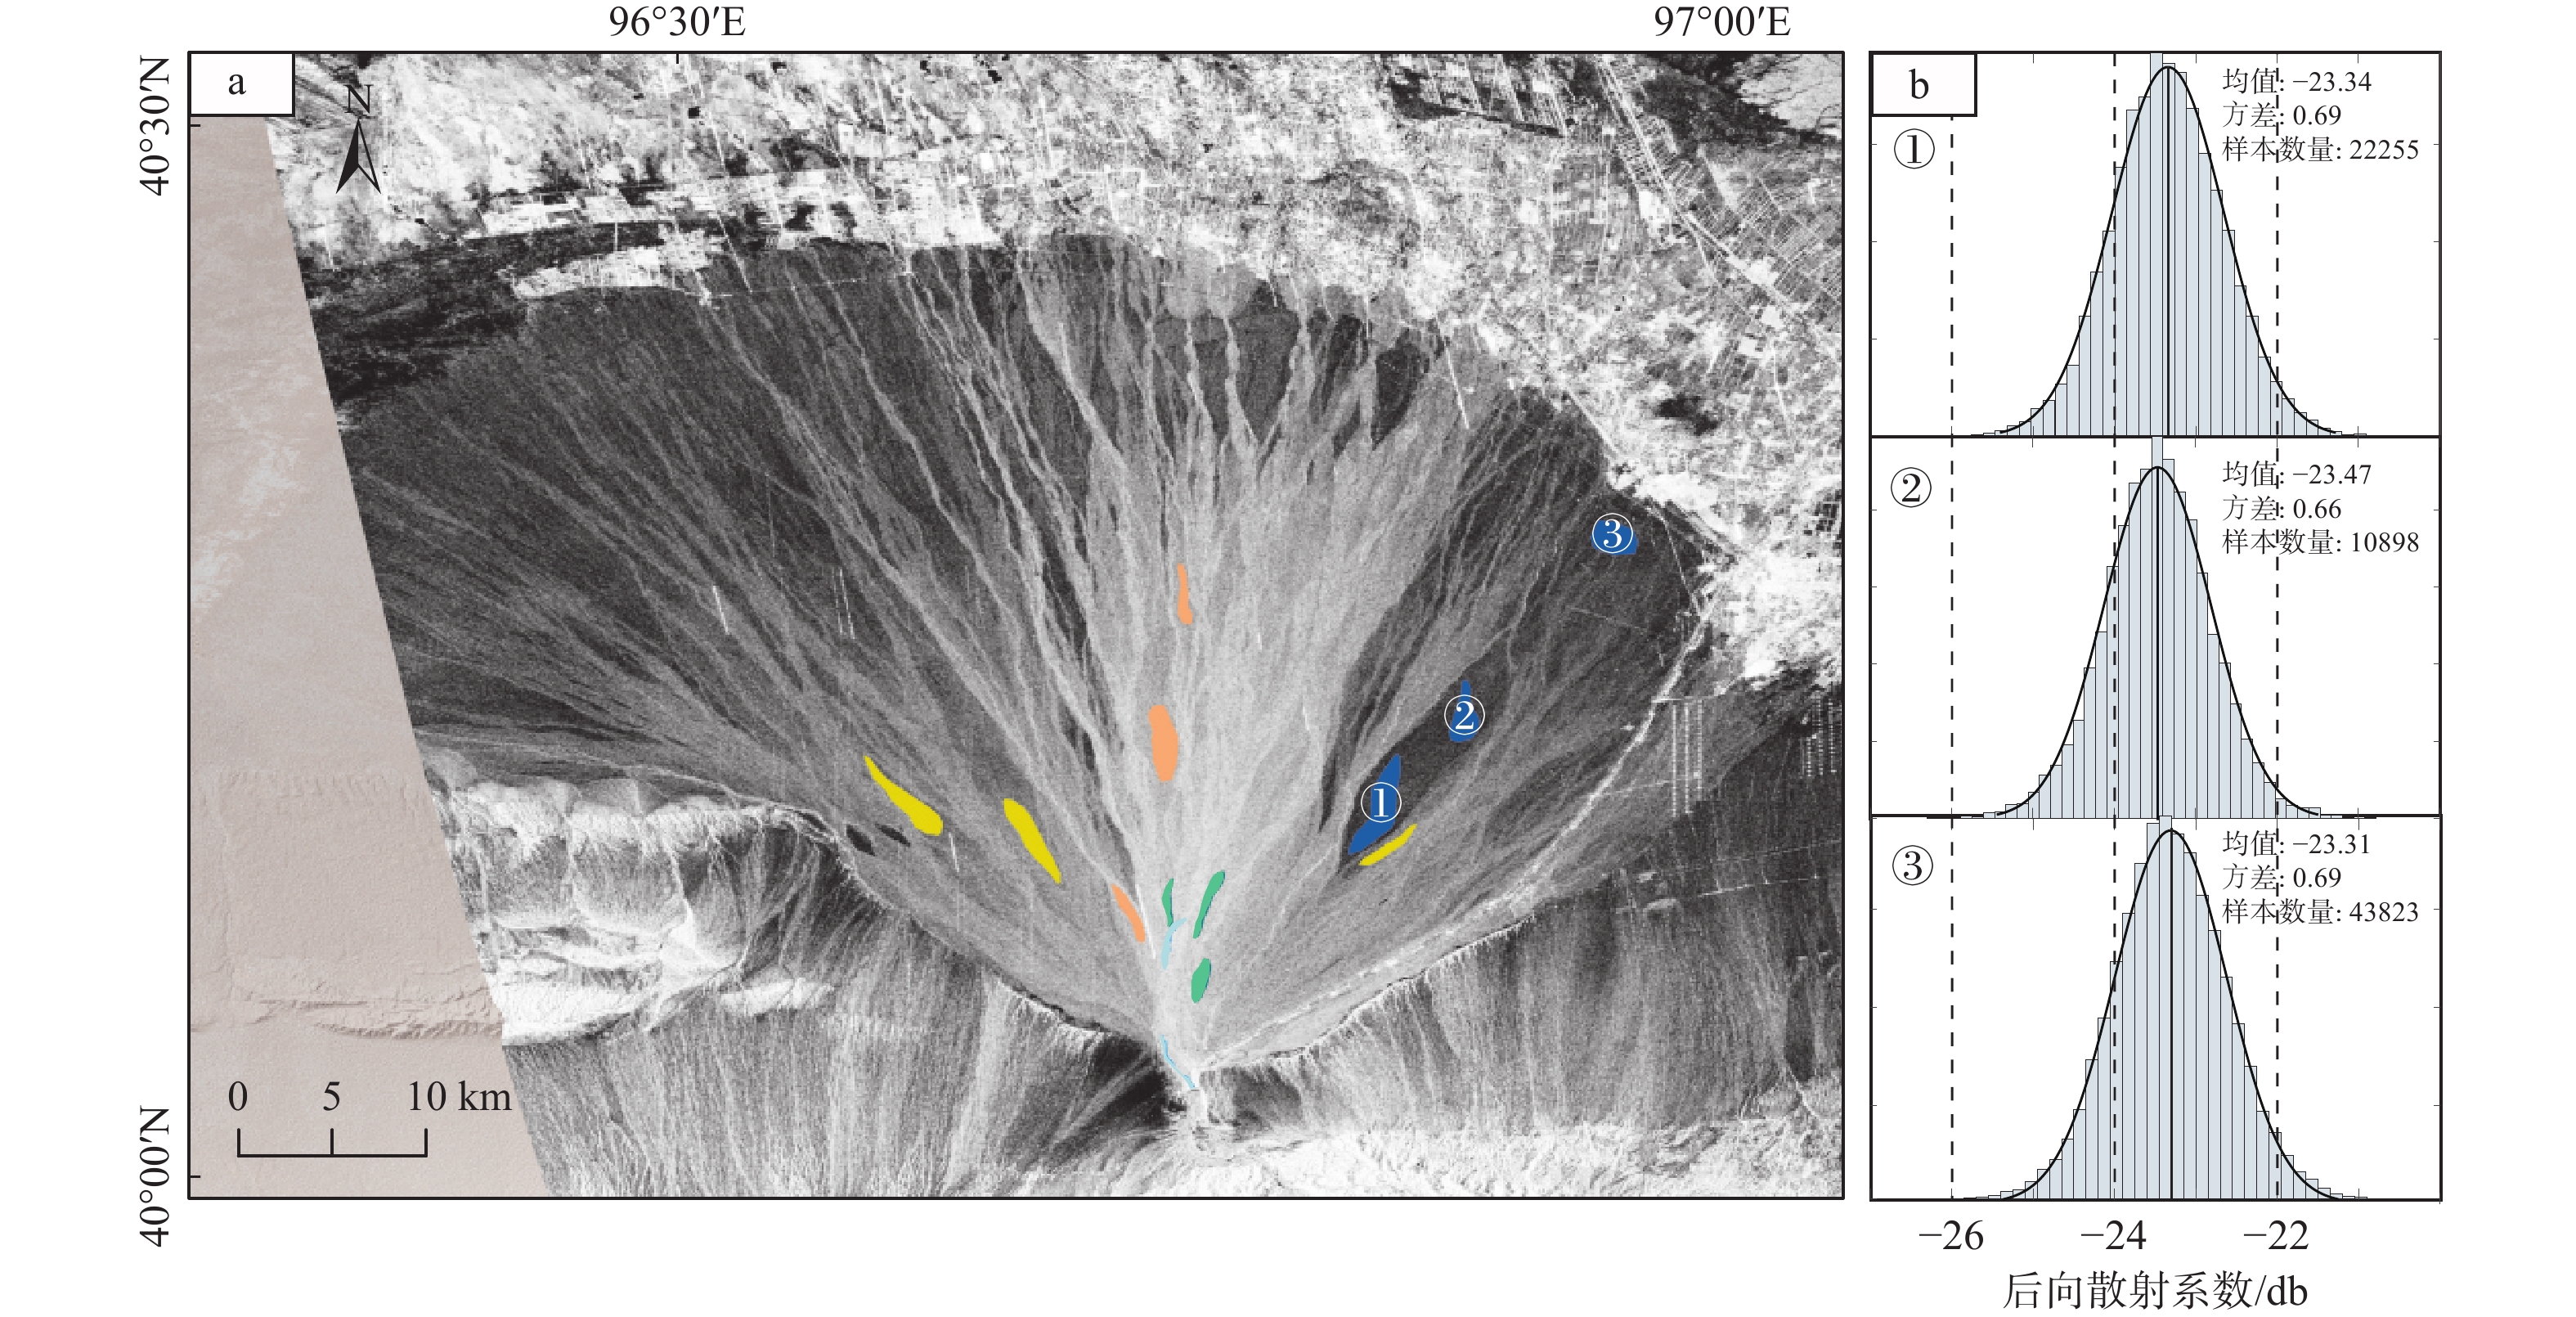
图 5 地貌面样本选取
a—样本选取区域(彩色多边形为样本区域范围,不同颜色区域代表不同期地貌面样本);b—蓝色多边形范围对应的后向散射系数统计结果
Figure 5. Selection of geomorphic surface samples (a) Sample selection area (Colored polygons represent the sample area range, different colored areas represent samples of different stages of landforms); (b) Statistical results of the backscatter coefficients corresponding to the blue polygon range
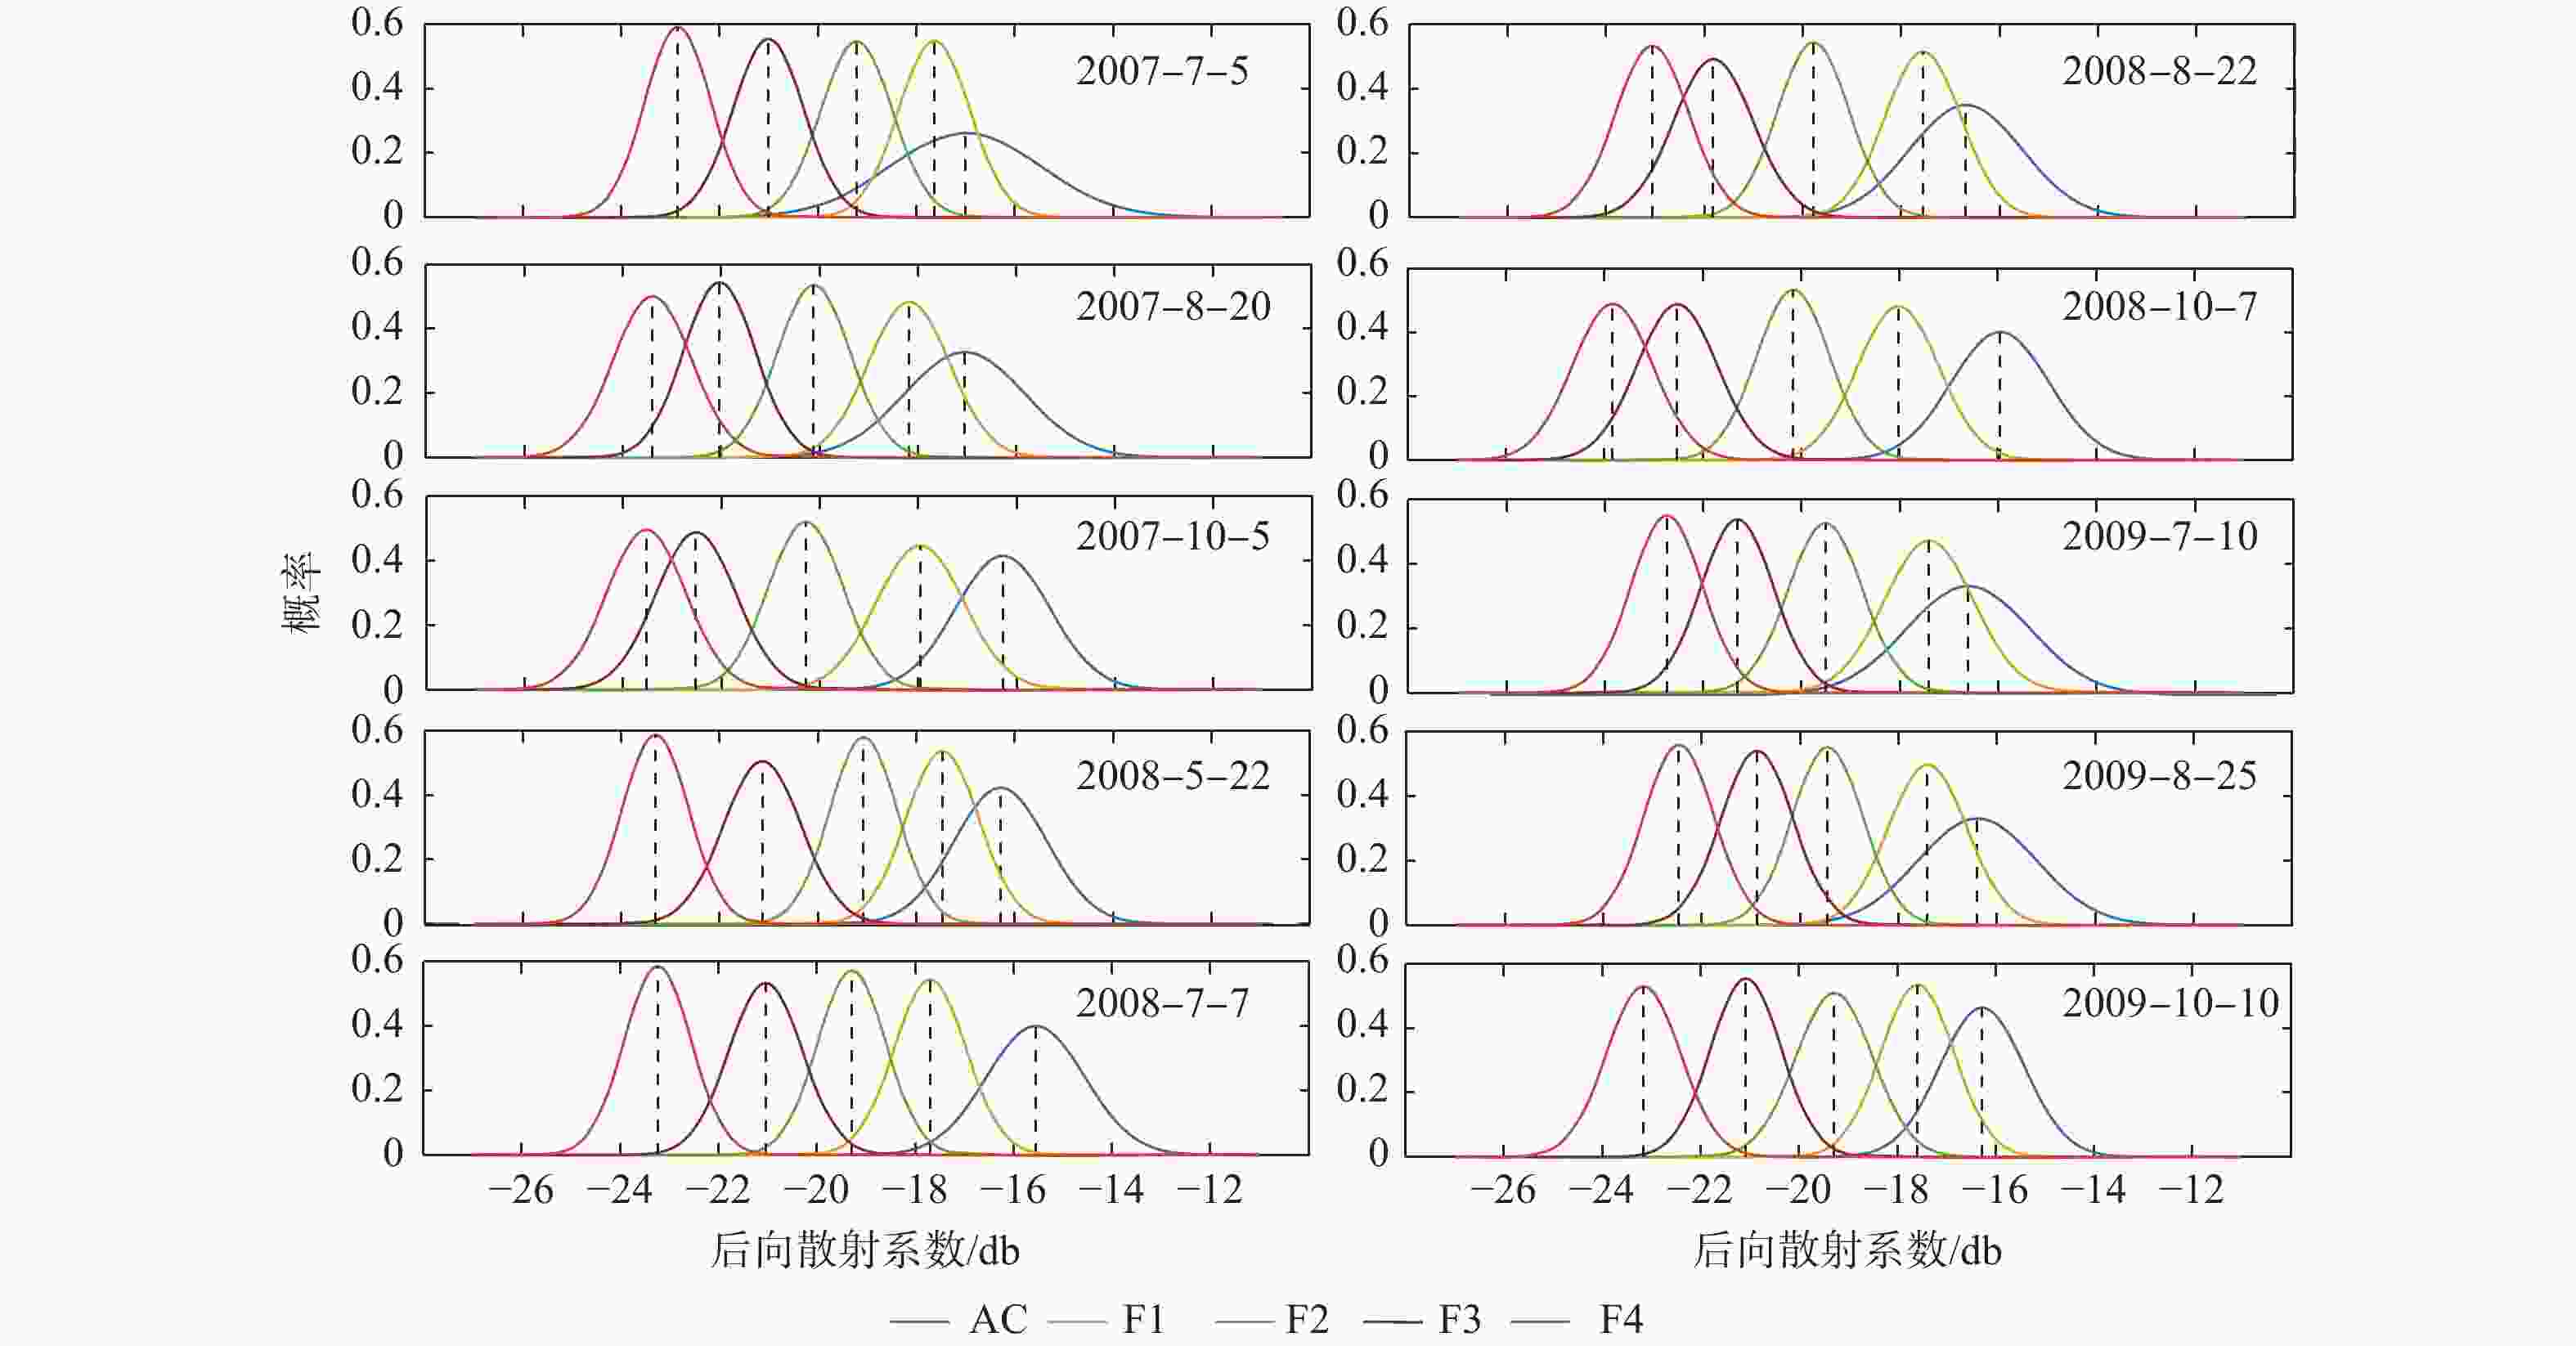
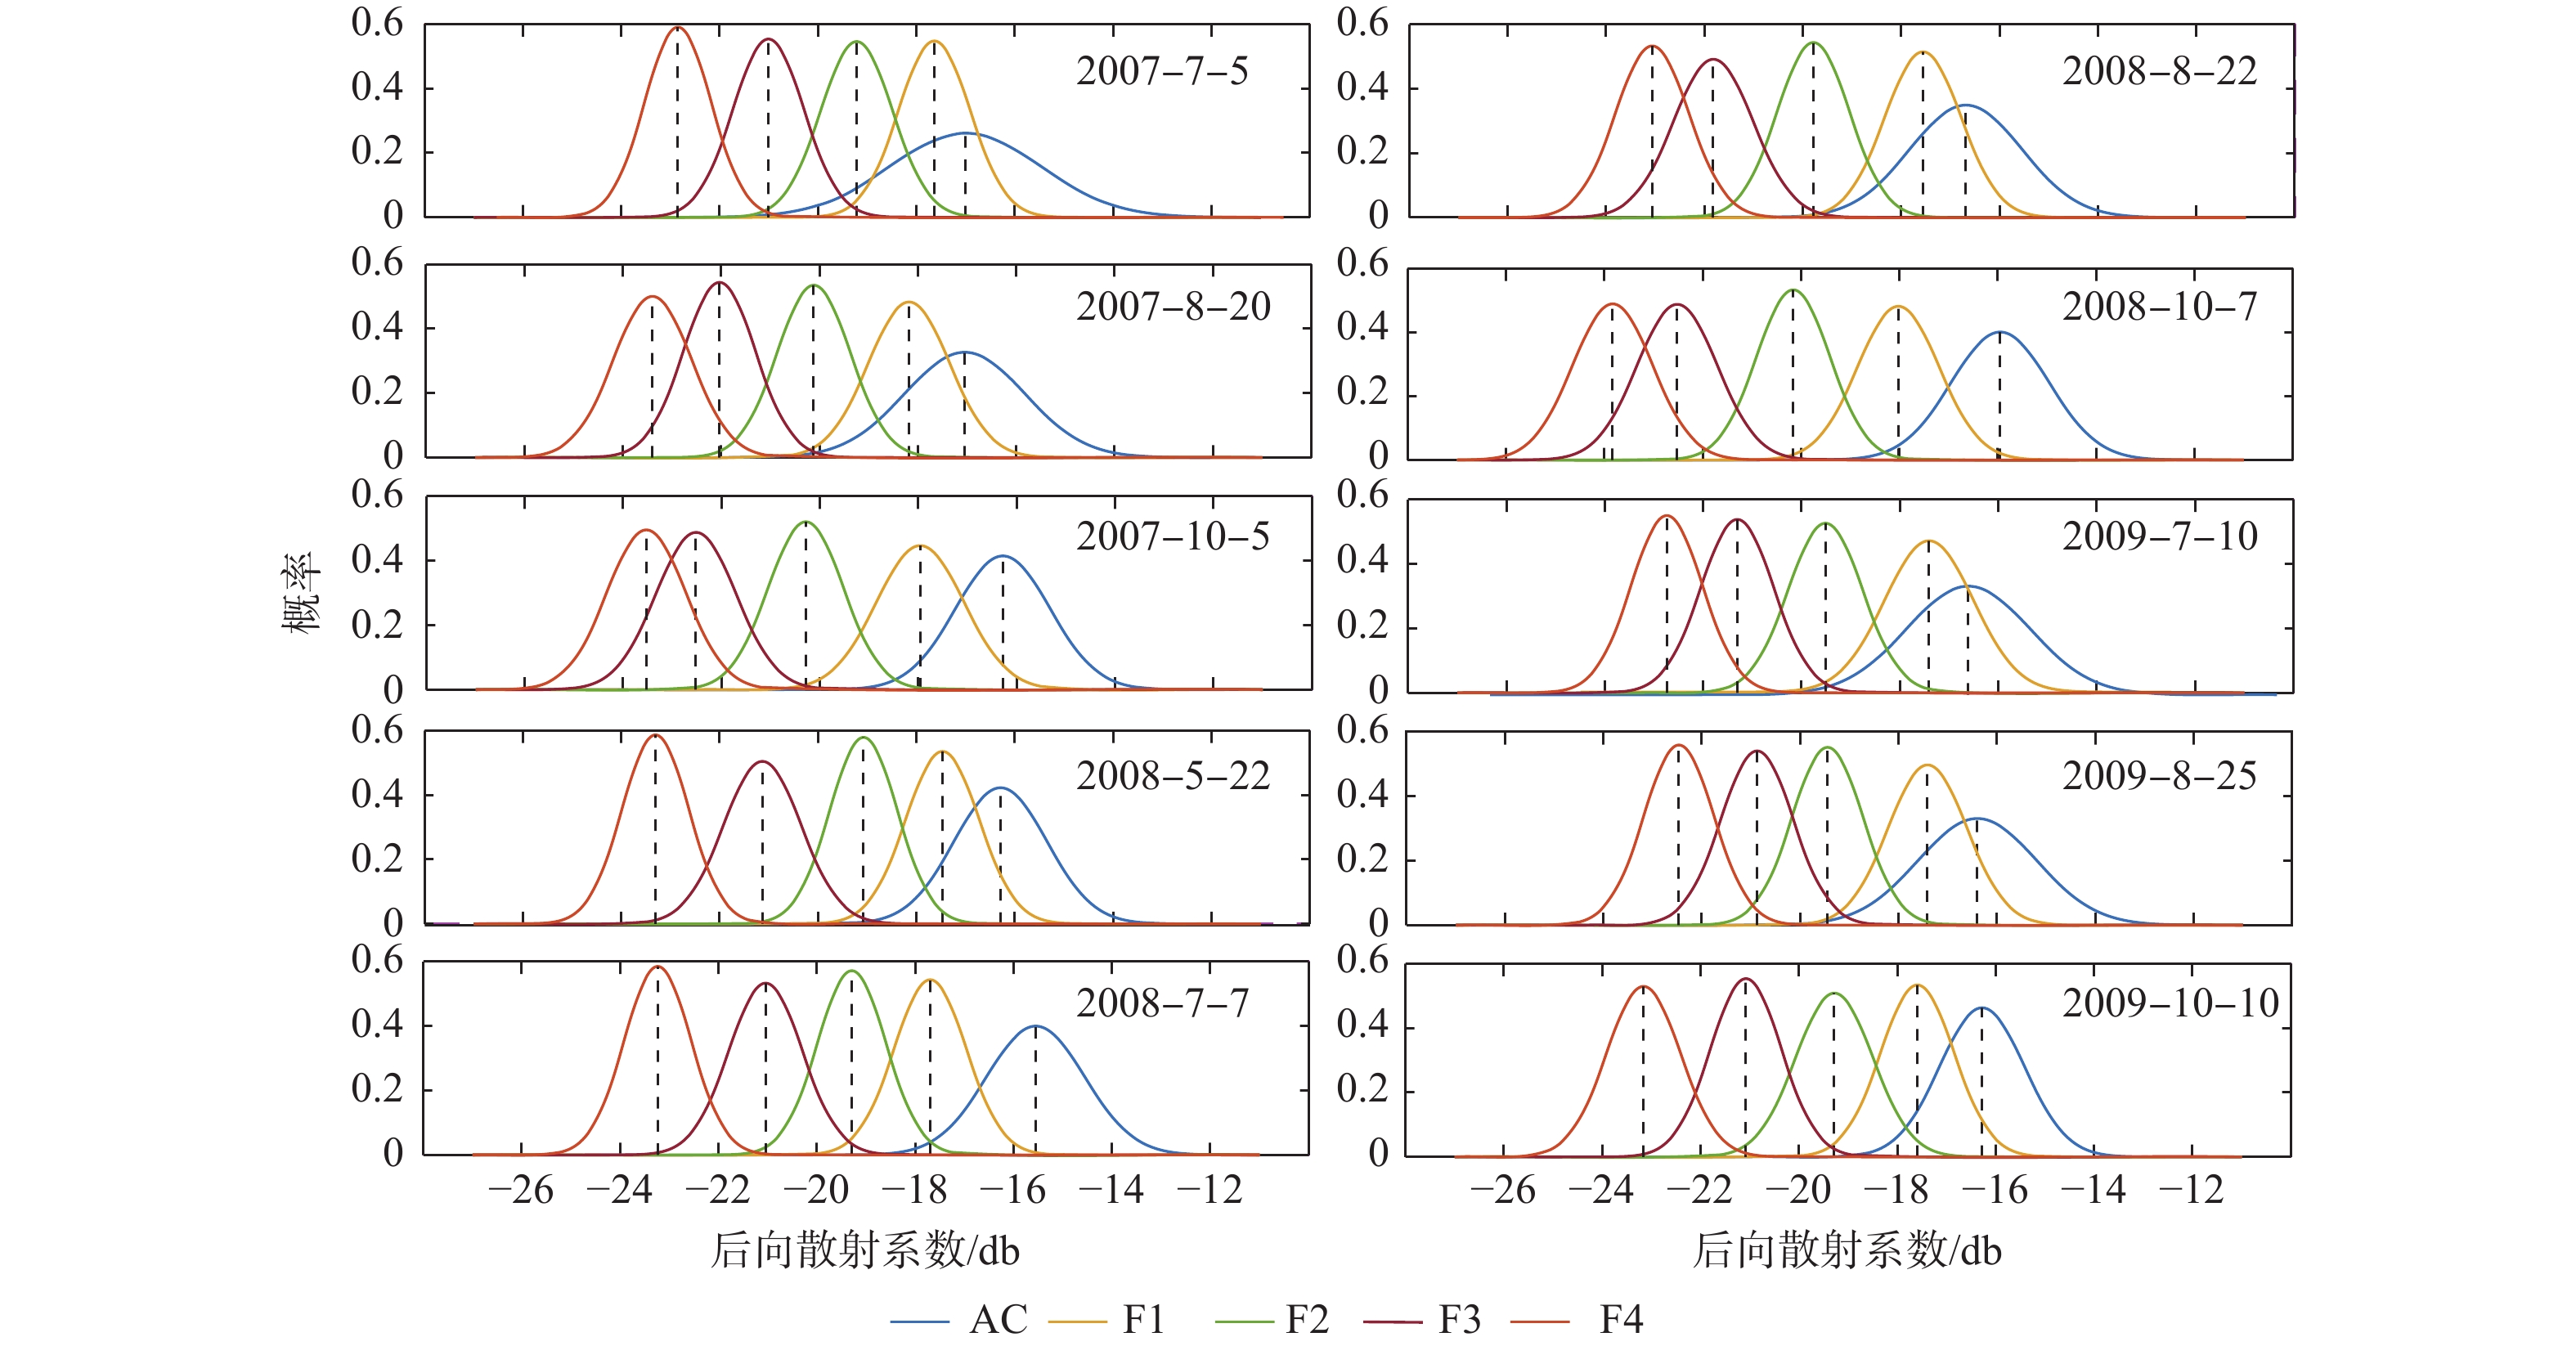
图 6 不同时相各期地貌面后向散射系数分布概率密度曲线
F1—F4对应不同期地貌面;AC为现今河床区域
Figure 6. PDF (Probability density function) of backscatter coefficient distribution on different stages of geomorphic surface at different time periods F1 to F4 correspond to different stages of landforms; AC represents the current riverbed area
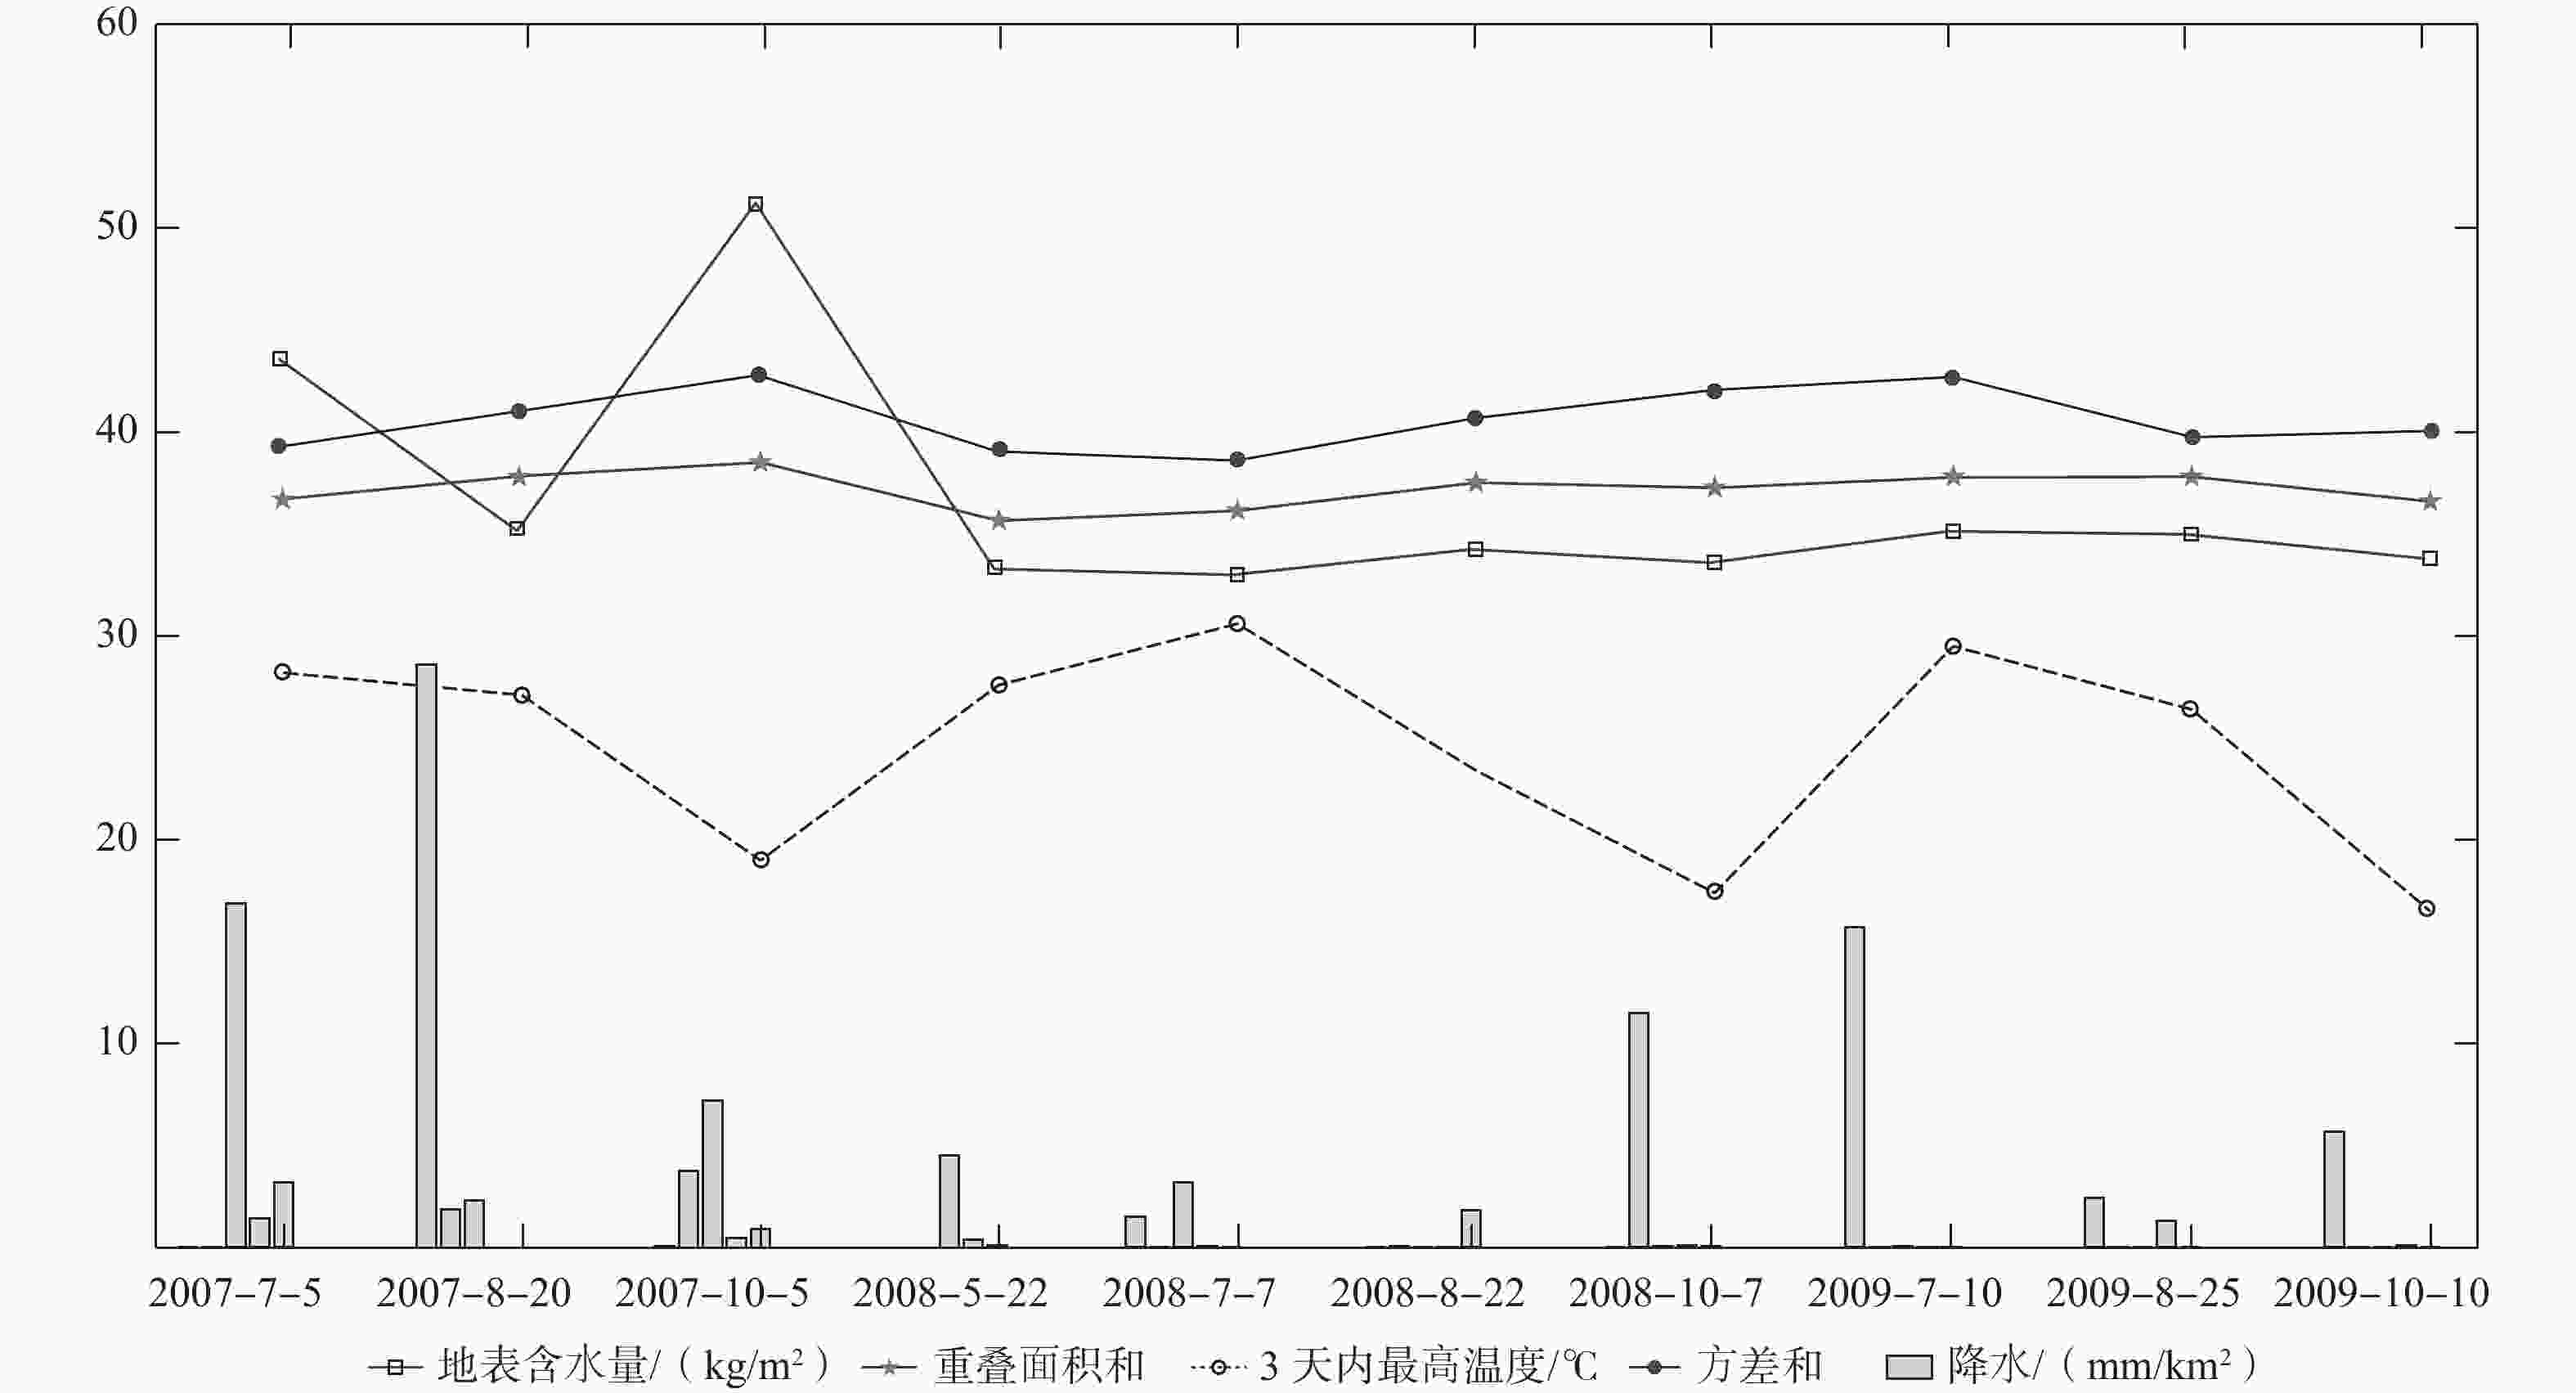
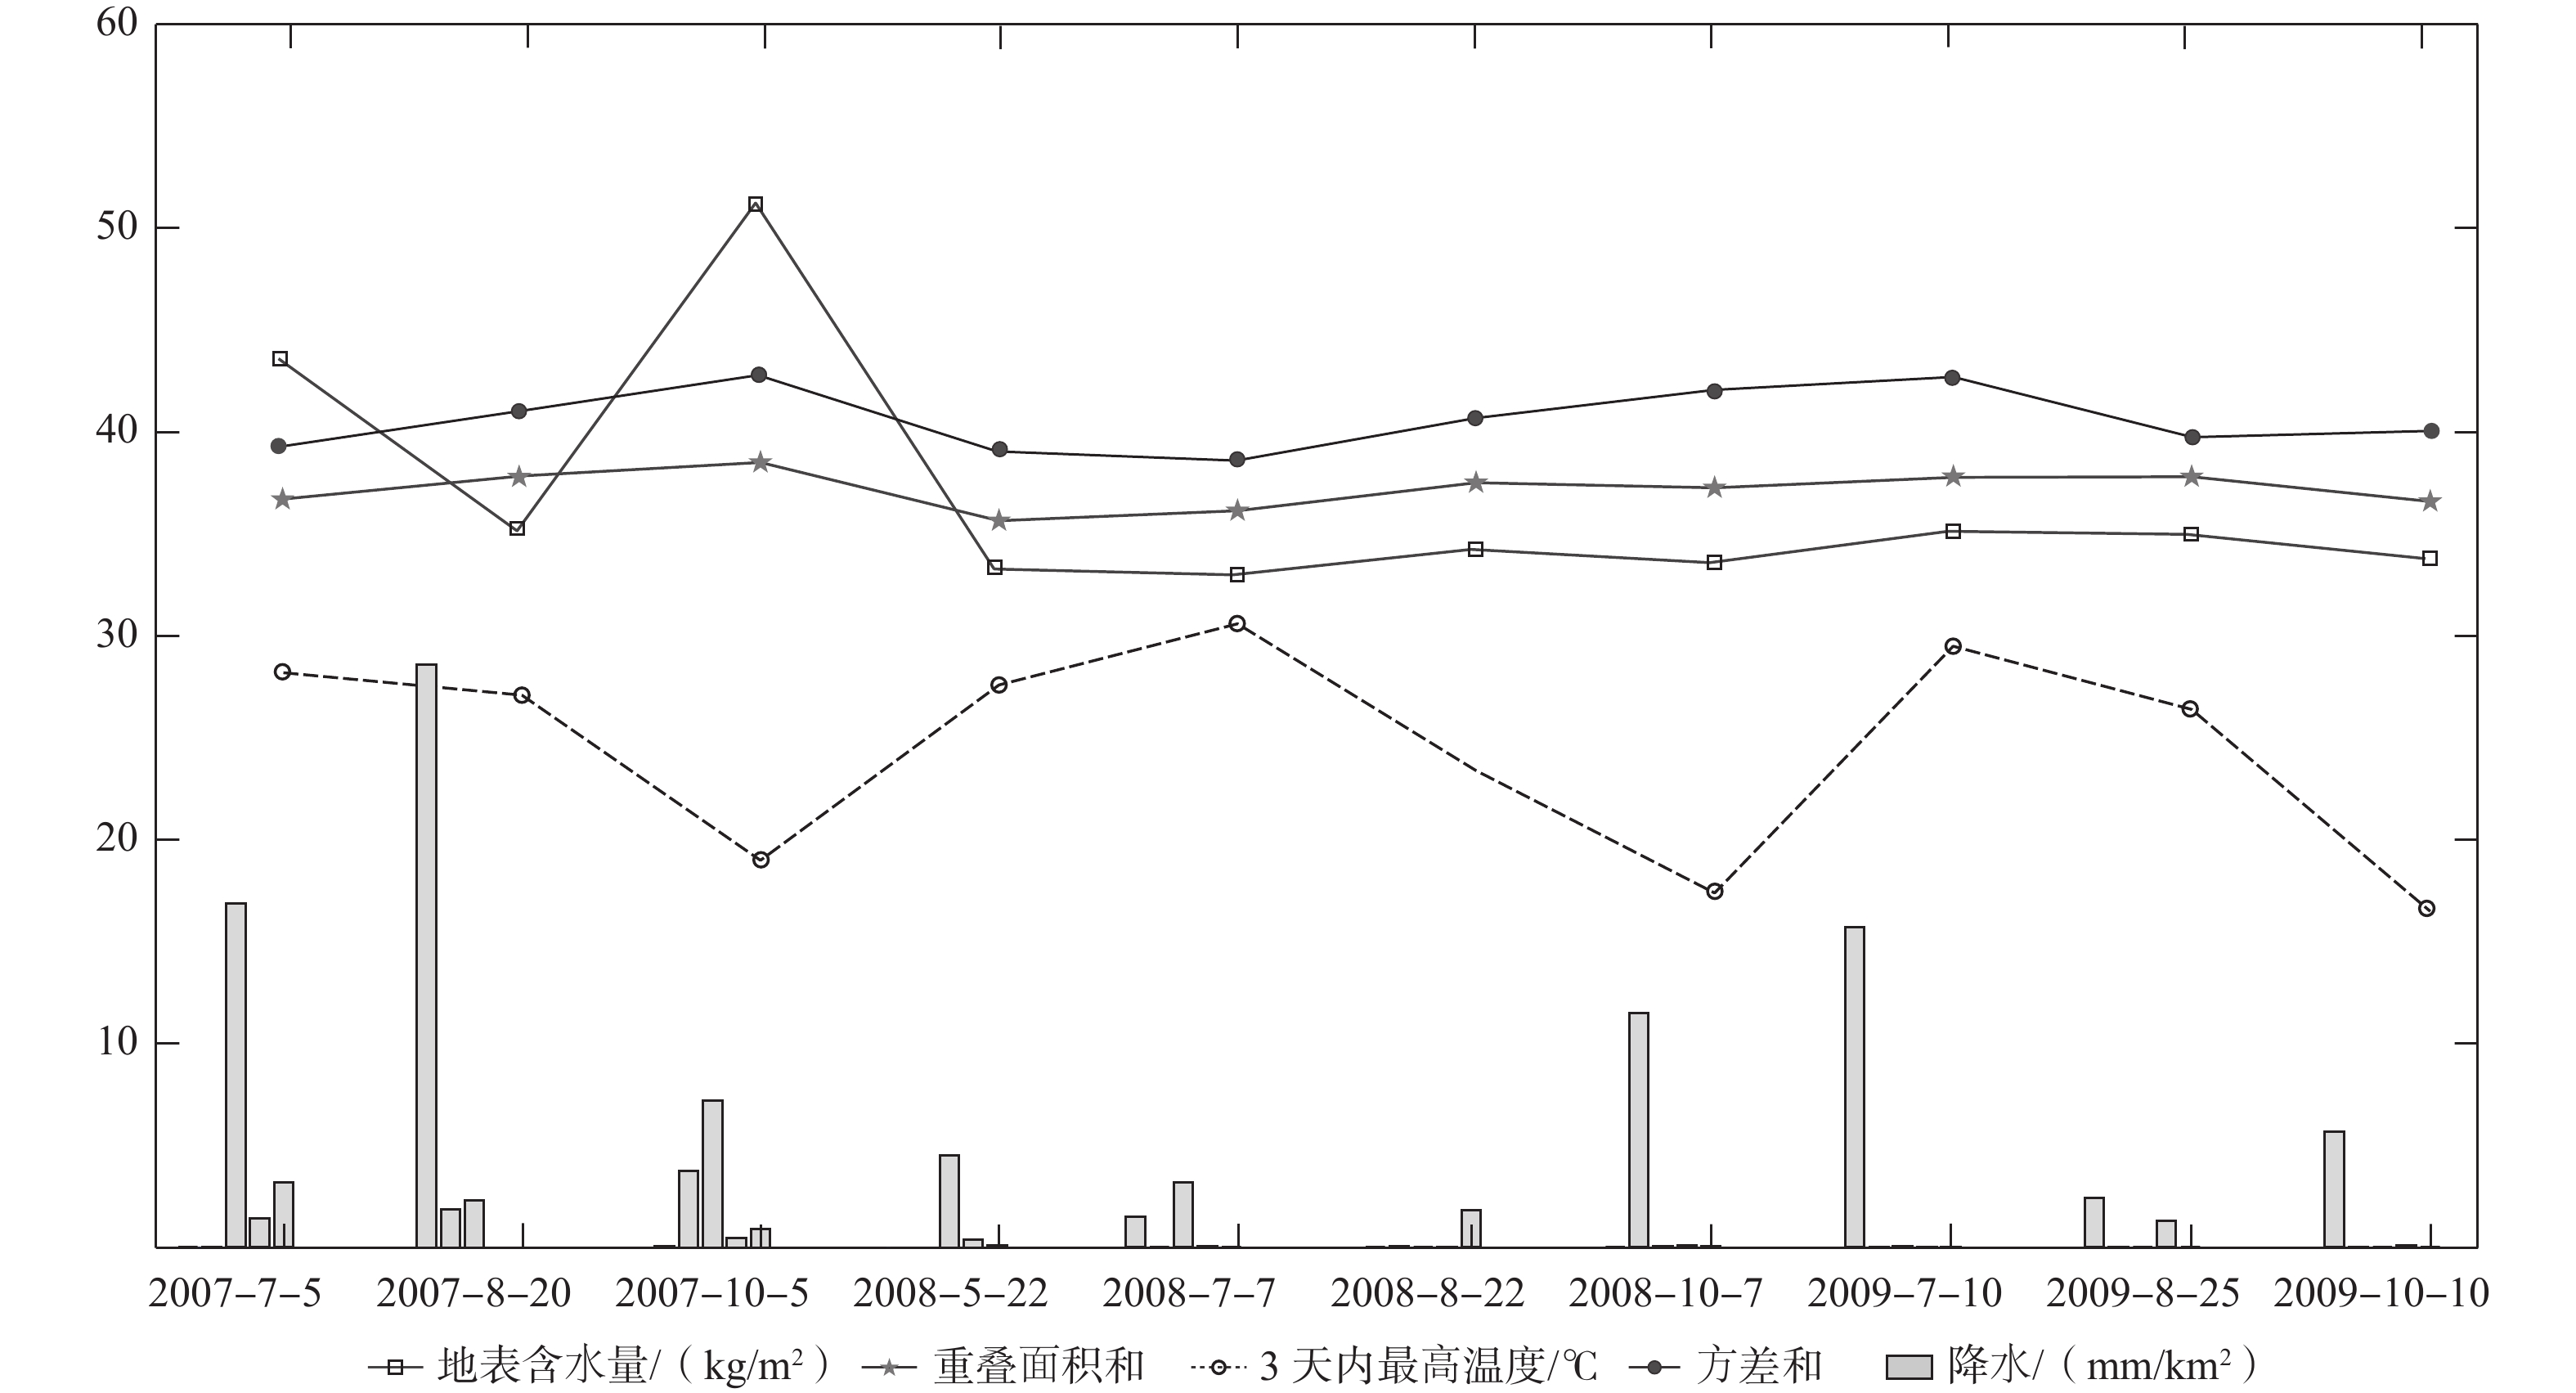
图 7 统计指标与大气条件分析
为便于对比趋势,对部分数据进行了平移和缩放,其中方差和×10;重叠面积和×10+30,地表含水量+30kg/m2
Figure 7. Statistical indicators and atmospheric condition analysis For ease of trend comparison, partial data has been shifted and scaled, where variance is multiplied by 10; overlapping area is multiplied by 10 plus 30, and surface soil moisture is increased by 30 kg/m².

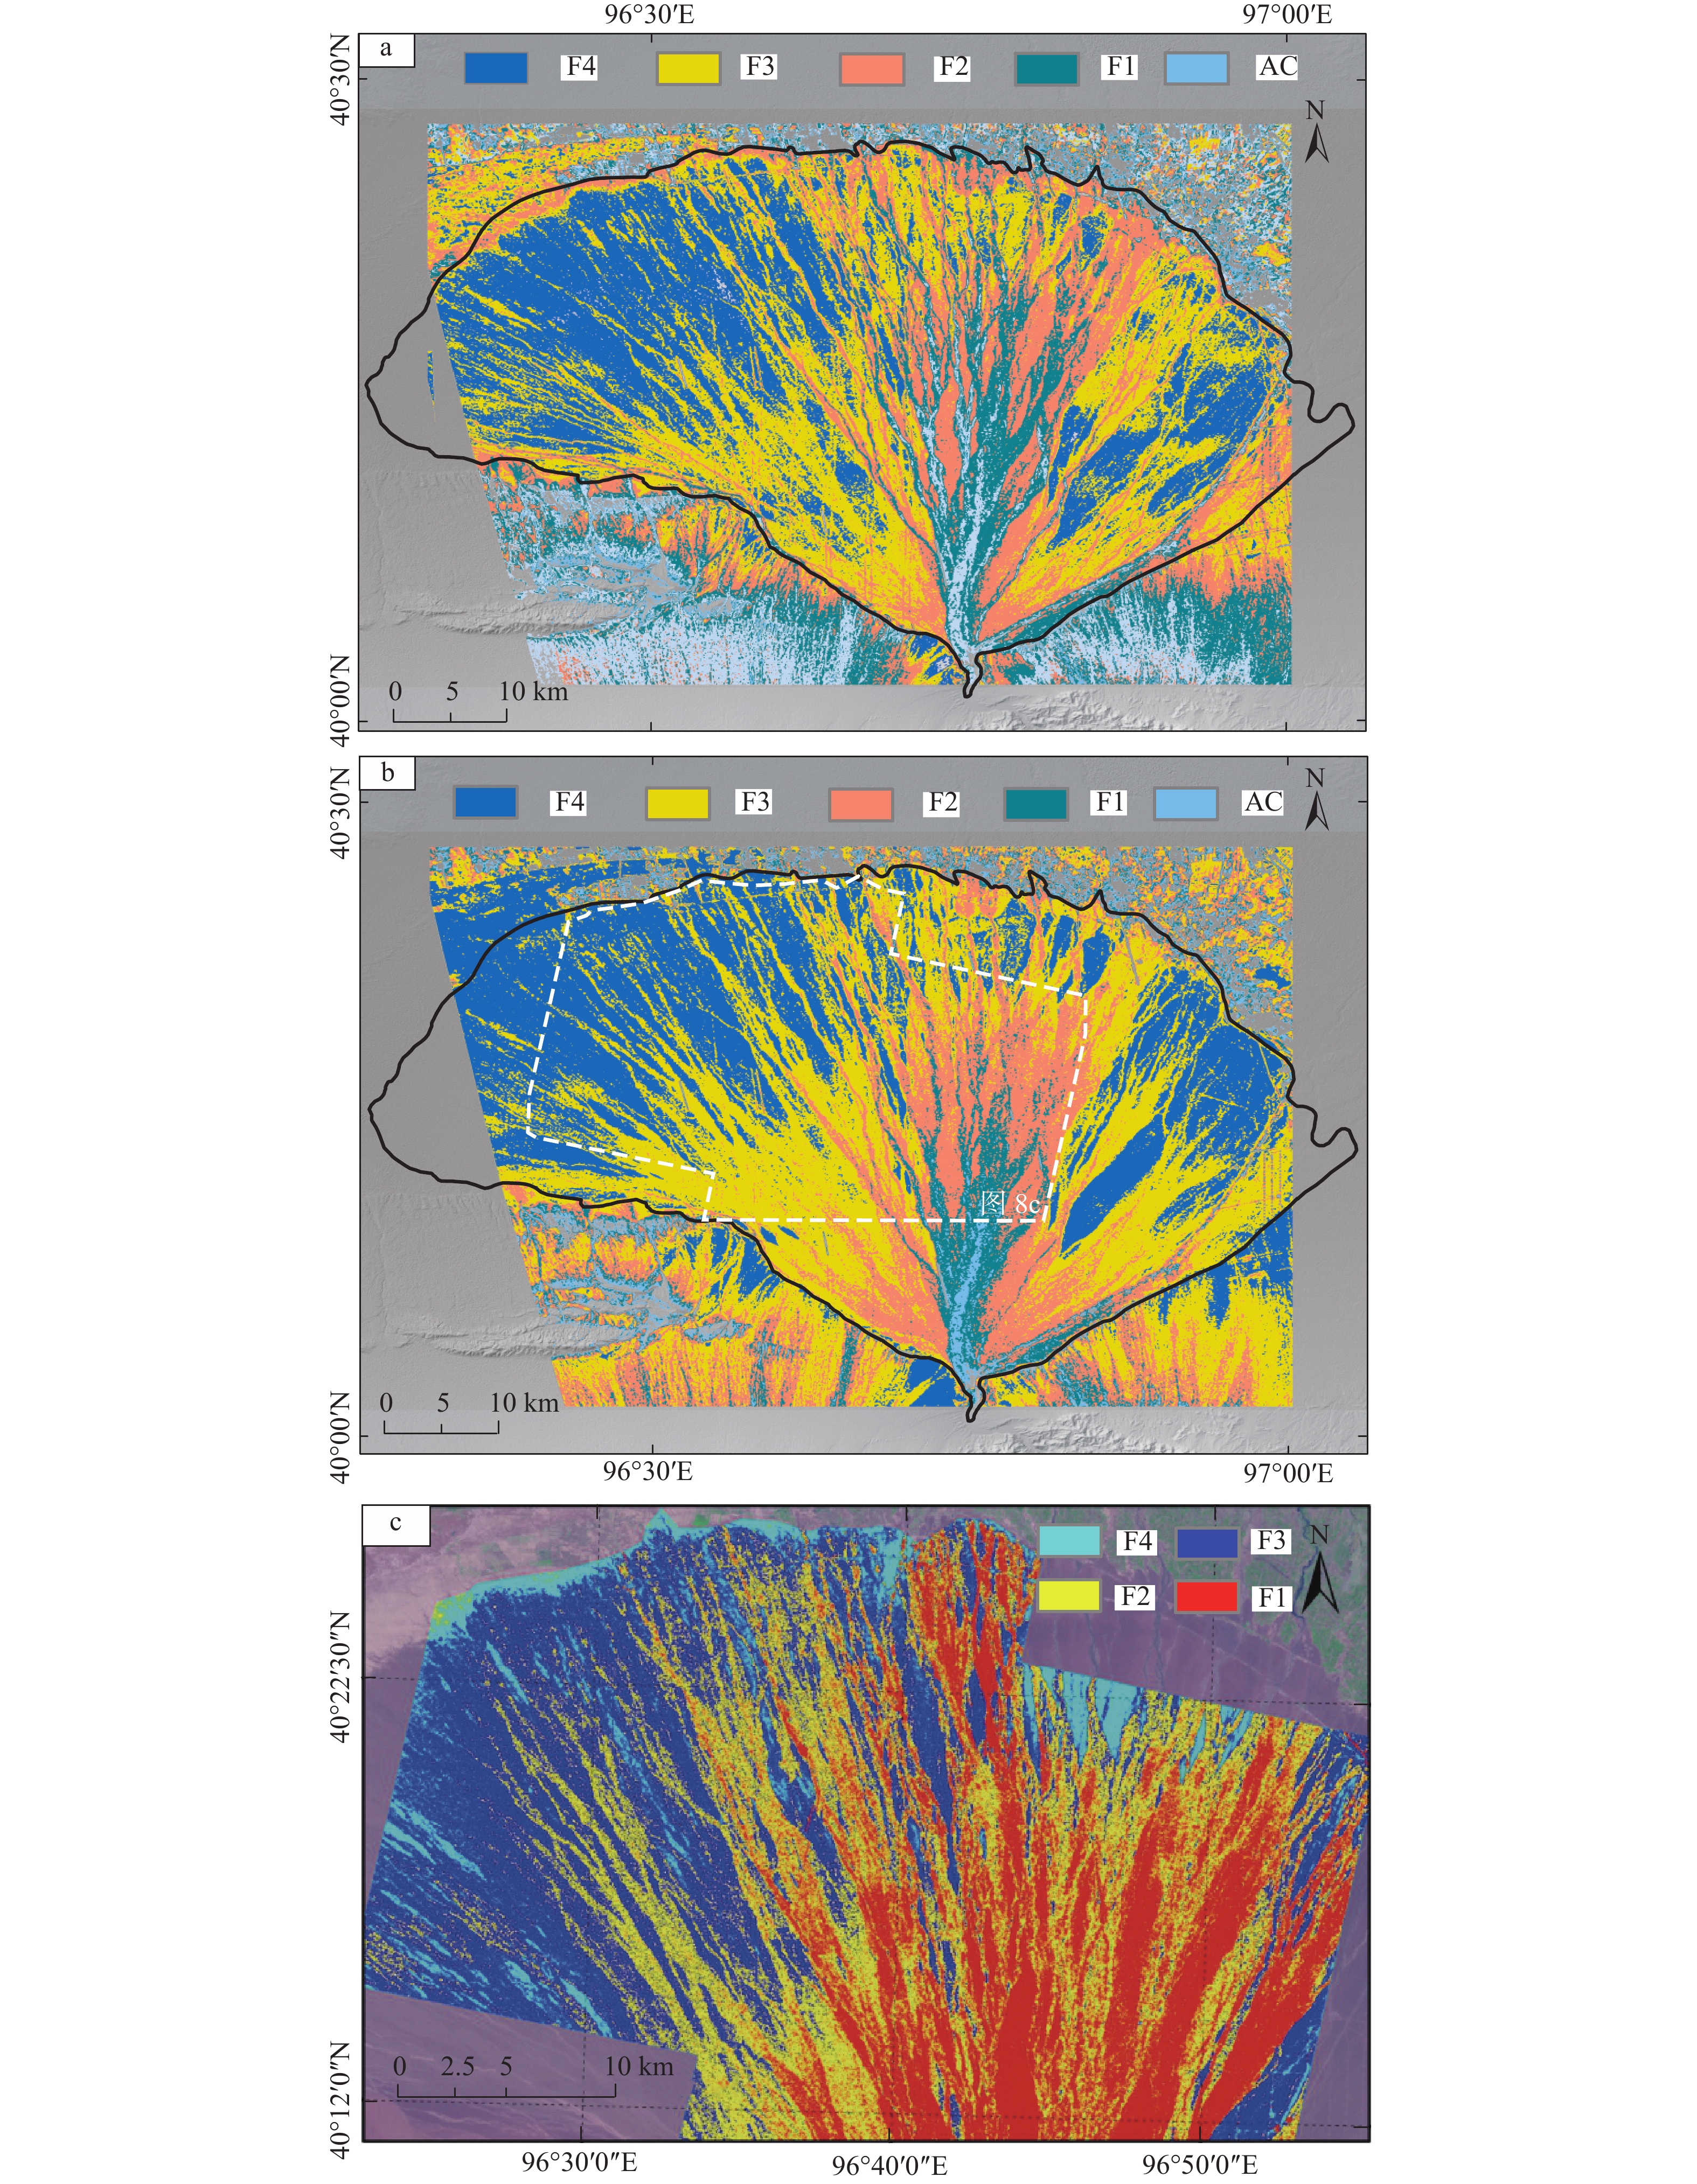
图 8 不同数据源划分的疏勒河洪积扇地貌面分期结果
F1—F4对应不同期地貌面;AC为现今河床区域a—成像时间为2007年10月5日;b—成像时间为2008年7月7日;c—C波段RADARSAT(据Zhang and Guo,2013修改)
Figure 8. Classification of the geomorphic surface of the Shule River alluvial fan
(a) Image acquisition date: October 5, 2007; (b) Image acquisition date: July 7, 2008; (c) C-band RADARSAT (modified after Zhang and Guo, 2013)F1 to F4 correspond to different stages of landforms; AC represents the current riverbed area

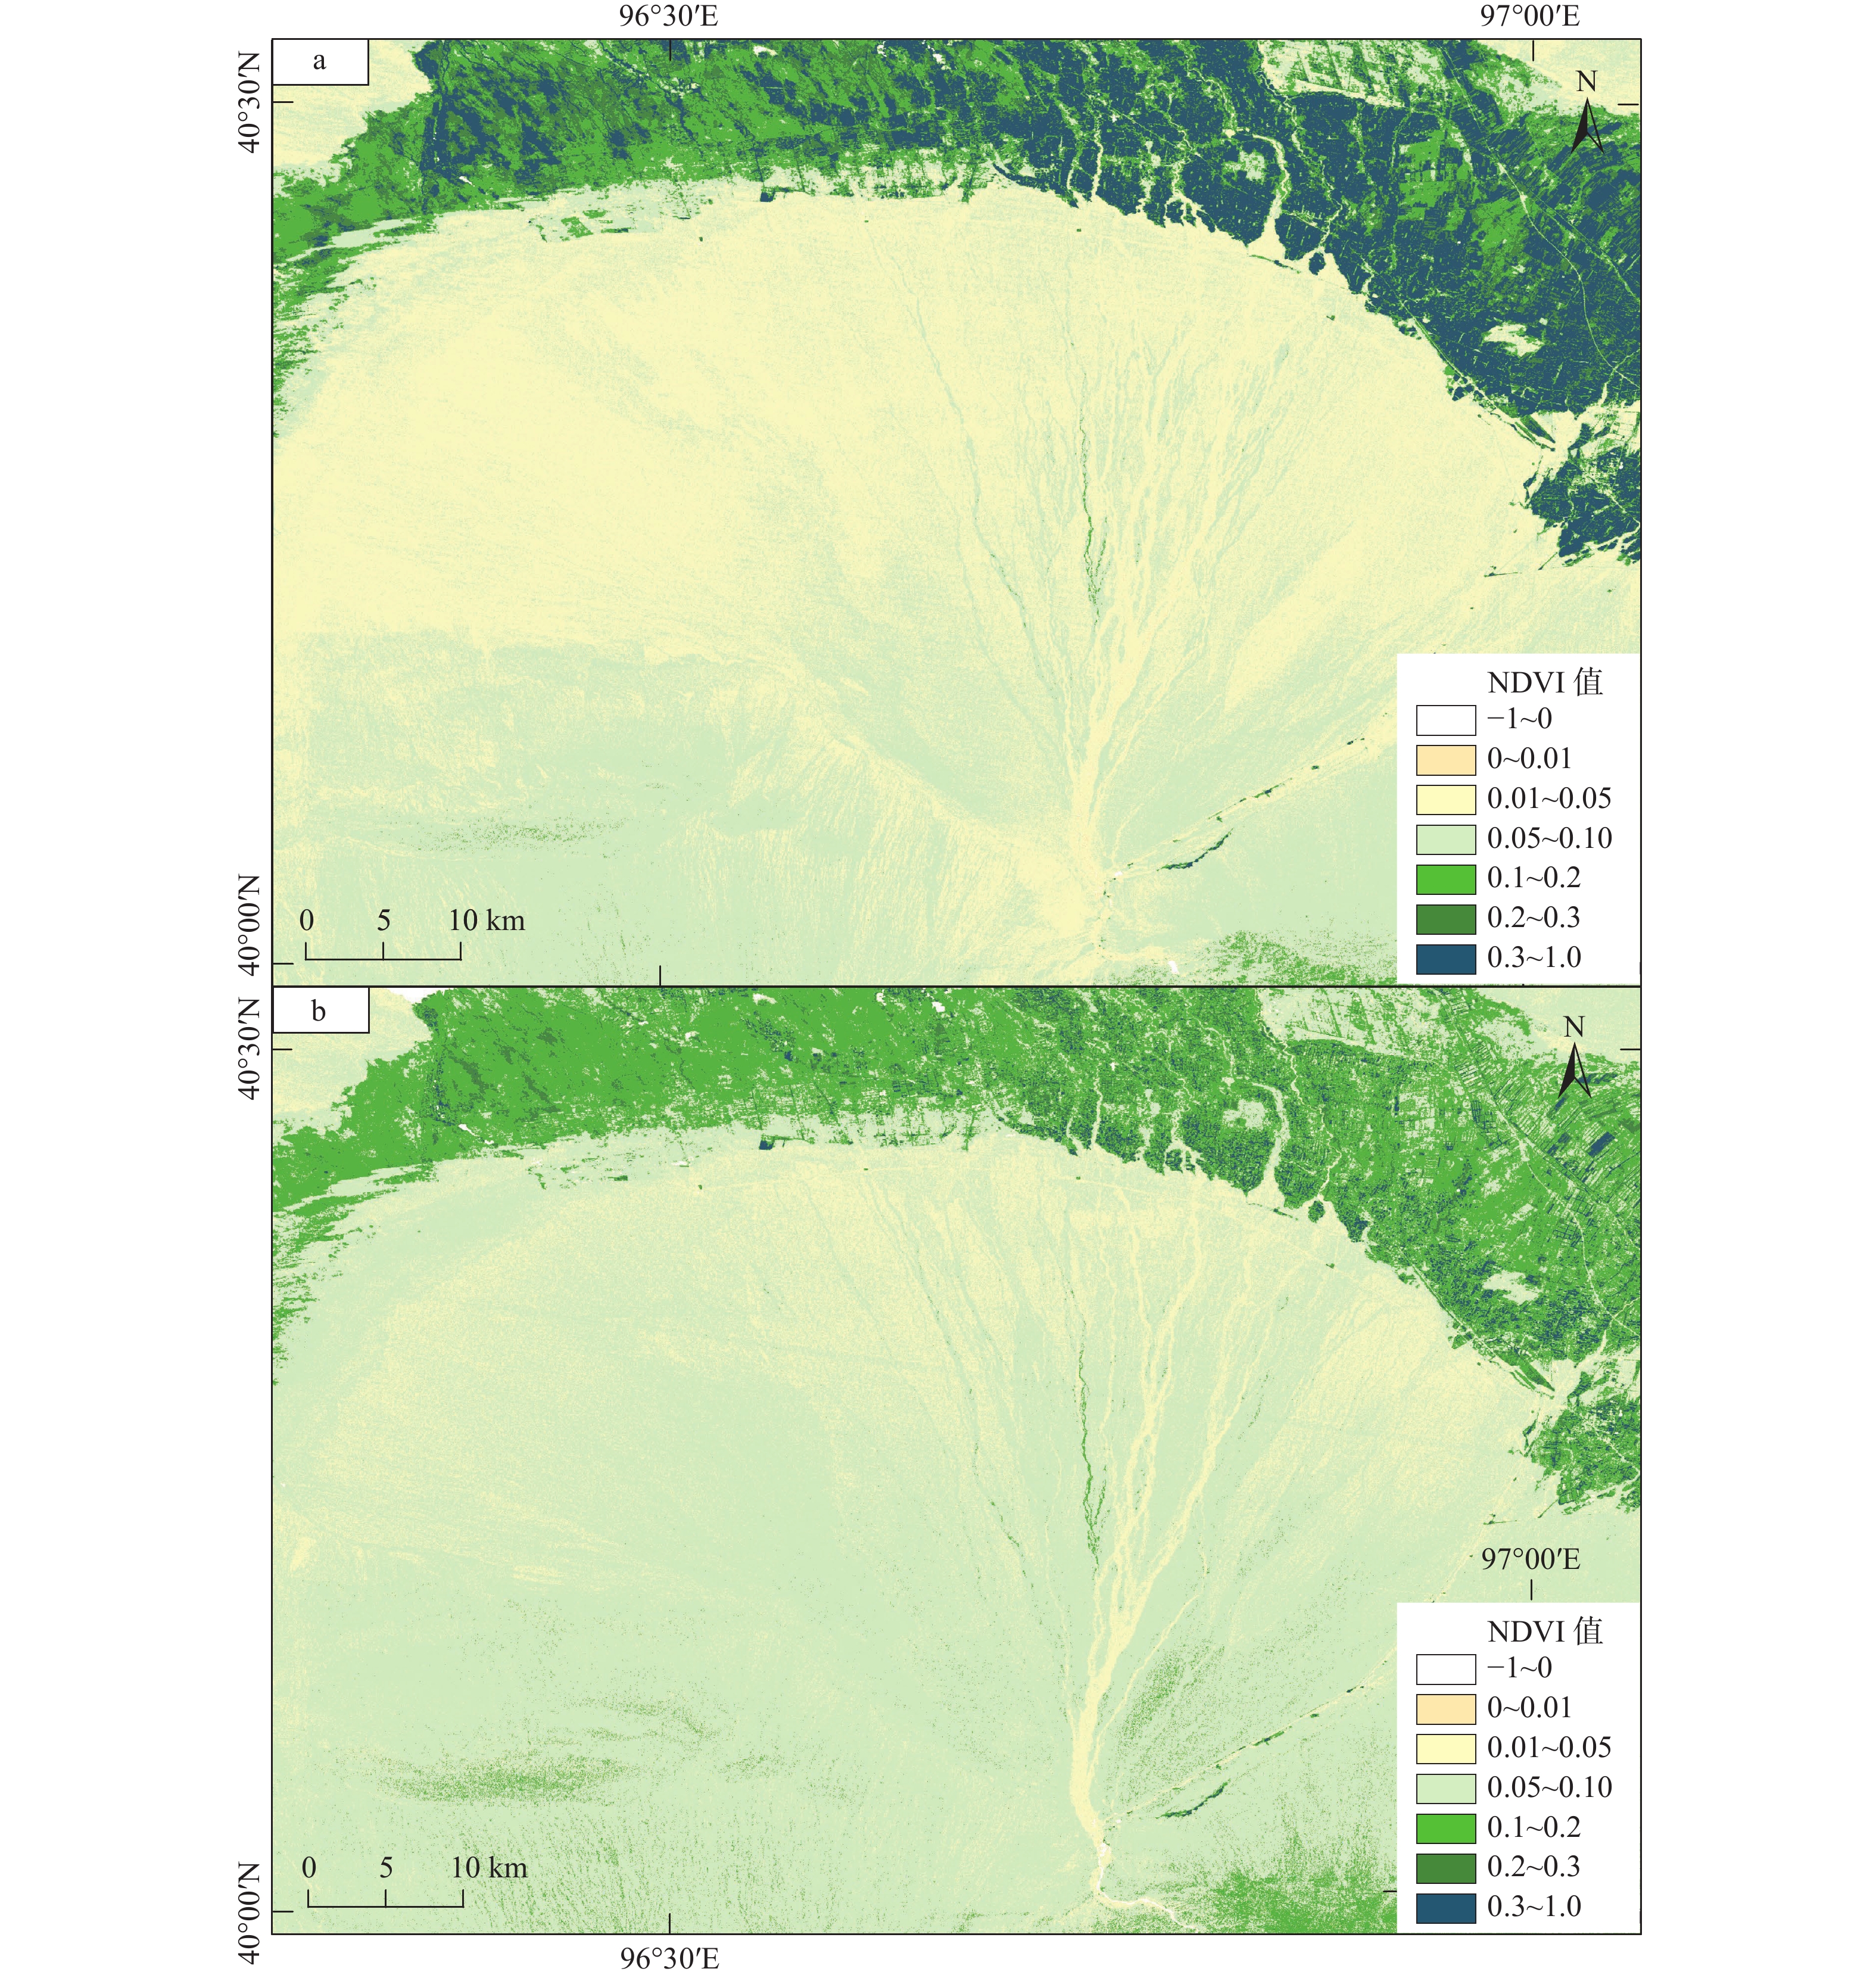
图 9 疏勒河洪积扇区域NDVI反演结果
a—2008年7月28日数据反演结果;b—2007年10月16日数据反演结果
Figure 9. The NDVI inversion results of the Shule River alluvial fan area (a) Inversion results for data acquired on July 28, 2008; (b) Inversion results for data acquired on October 16, 2007
表 1 选取的SAR影像数据信息
Table 1. Information of selected SAR images
影像名称 分辨率 极化方式 入射角 飞行方向 成像时间 轨道号 ALPSRP056830790 15 m HH/HV 38.692° 升轨 2007年7月5日 7696 ALPSRP083670790 38.705° 2007年8月20日 8367 ALPSRP090380790 38.705° 2007年10月5日 9038 ALPSRP123930790 38.689° 2008年5月22日 12393 ALPSRP130640790 38.691° 2008年7月7日 13064 ALPSRP137350790 38.669° 2008年8月22日 13735 ALPSRP144060790 38.672° 2008年10月7日 14406 ALPSRP184320790 38.685° 2009年7月10日 18432 ALPSRP191030790 38.705° 2009年8月25日 19103 ALPSRP191030790 38.692° 2009年10月10日 19774  下载: 导出CSV
表 2 不同时相各期地貌面后向散射系数分布方差
Table 2. Variance of numerical distribution of backscatter coefficients on different levels of landforms at different time periods
地貌面 2007−7−5 2007−8−20 2007−10−5 2008−5−22 2008−7−7 2008−8−22 2008−10−7 2009−7−10 2009−8−25 2009−10−10 AC 1.5245 1.2200 0.9606 0.9437 0.9969 1.1416 0.9937 1.2543 1.2041 0.8612 F1 0.7381 0.8257 0.8918 0.7449 0.7331 0.7746 0.8273 1.2045 0.8015 0.7470 F2 0.7405 0.7454 0.7653 0.6887 0.6971 0.7335 0.7472 0.7573 0.7222 0.7841 F3 0.7502 0.7334 0.8169 0.7905 0.7476 0.8111 0.8169 0.7008 0.7372 0.7205 F4 0.6851 0.7970 0.8042 0.6798 0.6812 0.7482 0.8146 0.6046 0.7129 0.7532 总和 2.9139 3.1015 3.2782 2.9039 2.8590 3.0674 3.206 3.2672 2.9738 3.0048
下载: 导出CSV
表 3 不同时相相邻地貌面后向散射系数分布重叠面积
Table 3. Overlapping area of numerical distribution of backscatter coefficients on adjacent geomorphic surfaces at different time periods
地貌面 2007−7−5 2007−8−20 2007−10−5 2008−5−22 2008−7−7 2008−8−22 2008−10−7 2009−7−10 2009−8−25 2009−10−10 F1-AC 0.6122 0.5584 0.3641 0.4786 0.2117 0.6216 0.2541 0.9063 0.5875 0.4119 F1-F2 0.2789 0.2174 0.1600 0.2628 0.2647 0.1395 0.1744 0.3071 0.1817 0.2702 F2-F3 0.2264 0.1948 0.1581 0.1638 0.2252 0.1877 0.1314 0.2316 0.3263 0.2319 F3-F4 0.1386 0.3730 0.5331 0.1388 0.1245 0.4245 0.4210 0.2282 0.2729 0.1576 总和 0.6439 0.7851 0.8512 0.5653 0.6144 0.7517 0.7268 0.7668 0.7809 0.6597
下载: 导出CSV
表 4 最大似然法获得的分类区间
Table 4. Classification interval obtained by maximum likelihood method
日期 左边界 F4−F3地貌面 F3−F2地貌面 F2−F1地貌面 F1−AC地貌面 右边界 2007−10−5 −24.9515 −23.0302 −21.3683 −19.2148 −17.1550 −15.5466 2008−7−7 −24.1847 −22.1909 −20.1365 −18.5141 −16.7880 −15.4257
下载: 导出CSV
-
[1] AUBERT M, BAGHDADI N, ZRIBI M, et al. , 2011. Analysis of TerraSAR-X data sensitivity to bare soil moisture, roughness, composition and soil crust[J]. Remote Sensing of Environment, 115(8): 1801-1810. doi: 10.1016/j.rse.2011.02.021 [2] AYARI E, KASSOUK Z, LILI-CHABAANE Z, et al. , 2021. Cereal crops soil parameters retrieval using L-band ALOS-2 and C-band sentinel-1 sensors[J]. Remote Sensing, 13(7): 1393. doi: 10.3390/rs13071393 [3] BEAUDOIN A, LE TOAN T, GWYN Q H J, 1990. SAR observations and modeling of the C-band backscatter variability due to multiscale geometry and soil moisture[J]. IEEE Transactions on Geoscience and Remote Sensing, 28(5): 886-895. doi: 10.1109/36.58978 [4] BLAIR T C, MCPHERSON J G, 1994. Alluvial fan processes and forms[M]//ABRAHAMS A D, PARSONS A J. Geomorphology of desert environments. Dordrecht: Springer: 354-402. [5] BULL W B, 1977. The alluvial-fan environment[J]. Progress in Physical Geography: Earth and Environment, 1(2): 222-270. doi: 10.1177/030913337700100202 [6] BULL W B, 1991. Geomorphic responses to climatic change[M]. New York: Oxford University Press. [7] COPPO P, LUZI G, SCHIAVON G, 1995. Understanding microwave surface backscattering of bare soil by comparing models and experimental data collected during two different airborne campaigns[C]//1995 International geoscience and remote sensing symposium, IGARSS'95. Quantitative remote sensing for science and applications. Firenze: IEEE: 1346-1348. [8] D'ARCY M, MASON P J, RODA-BOLUDA D C, et al. , 2018. Alluvial fan surface ages recorded by Landsat-8 imagery in Owens Valley, California[J]. Remote Sensing of Environment, 216: 401-414. doi: 10.1016/j.rse.2018.07.013 [9] DE JEU R, OWE M, 2012. TMI/TRMM surface soil moisture (LPRM) L3 1 day 25 km x 25 km nighttime V001, Edited by Goddard Earth Sciences Data and Information Services Center (GES DISC) (Bill Teng), Greenbelt, MD, USA, Goddard Earth Sciences Data and Information Services Center (GES DISC),doi: 10.5067/GWHRZEL8SA21. [10] ESCORIHUELA M J, KERR Y H, DE ROSNAY P, et al. , 2007. A simple model of the bare soil microwave emission at L-band[J]. IEEE Transactions on Geoscience and Remote Sensing, 45(7): 1978-1987. doi: 10.1109/TGRS.2007.894935 [11] EVANS D L, FARR T G, VAN ZYL J J, 1992. Estimates of surface roughness derived from synthetic aperture radar (SAR) data[J]. IEEE Transactions on Geoscience and Remote Sensing, 30(2): 382-389. doi: 10.1109/36.134087 [12] FAN L, ATKINSON P M, 2018. A new multi-resolution based method for estimating local surface roughness from point clouds[J]. ISPRS Journal of Photogrammetry and Remote Sensing, 144: 369-378. doi: 10.1016/j.isprsjprs.2018.08.003 [13] FRANKEL K L, DOLAN J F, 2007. Characterizing arid region alluvial fan surface roughness with airborne laser swath mapping digital topographic data[J]. Journal of Geophysical Research: Earth Surface, 112(F2): F02025. [14] FREEMAN A, 1992. SAR calibration: an overview[J]. IEEE Transactions on Geoscience and Remote Sensing, 30(6): 1107-1121. doi: 10.1109/36.193786 [15] FUNG A K, LI Z, CHEN K S, 1992. Backscattering from a randomly rough dielectric surface[J]. IEEE Transactions on Geoscience and Remote Sensing, 30(2): 356-369. doi: 10.1109/36.134085 [16] GREELEY R, LANCASTER N, SULLIVAN R J, et al. , 1988. A relationship between radar backscatter and aerodynamic roughness: preliminary results[J]. Geophysical Research Letters, 15(6): 565-568. doi: 10.1029/GL015i006p00565 [17] GUO N, 2003. Vegetation index and its advances[J]. Arid Meteorology, 21(4): 71-75. (in Chinese with English abstract) [18] GUO Q N, ZHOU Z F, WANG S, 2017. The source, flow rates, and hydrochemical evolution of groundwater in an alluvial fan of Qilian Mountain, northwest China[J]. Water, 9(12): 912. doi: 10.3390/w9120912 [19] GURALNIK B, MATMON A, AVNI Y, et al. , 2010. 10Be exposure ages of ancient desert pavements reveal Quaternary evolution of the Dead Sea drainage basin and rift margin tilting[J]. Earth and Planetary Science Letters, 290(1-2): 132-141. doi: 10.1016/j.jpgl.2009.12.012 [20] HAN L F, LIU J, YUAN Z D, et al. , 2019. Extracting features of alluvial fan and discussing landforms evolution based on high-resolution topography data: taking alluvial fan of Laohushan along Haiyuan fault zone as an instance[J]. Seismology and Geology, 41(2): 251-265. (in Chinese with English abstract) [21] HETZ G, MUSHKIN A, BLUMBERG D G, et al. , 2016. Estimating the age of desert alluvial surfaces with spaceborne radar data[J]. Remote Sensing of Environment, 184: 288-301. doi: 10.1016/j.rse.2016.07.006 [22] HOLECZ F, DWYER E, MONACO S, et al. , 2000. An operational rice field mapping tool using spaceborne SAR data[C]//ERS-ENVISAT symposium. mat. [23] HUANG F P, ZHANG H P, XIONG J G, et al. , 2021. Estimation of displacements along strike-slip fault on a million-year timescale: a case study of the AltynTagh fault system[J]. Journal of Geomechanics, 27(2): 208-217,doi: 10.12090/j.issn.1006-6616.2021.27.02.020. (in Chinese with English abstract) [24] HUFFMAN G J, STOCKER E F, BOLVIN D T, et al. , 2019. GPM IMERG final precipitation L3 1 day 0.1 degree x 0.1 degree V06, Edited by Andrey Savtchenko, Greenbelt, MD, Goddard Earth Sciences Data and Information Services Center (GES DISC), doi: 10.5067/GPM/IMERGDF/DAY/06. [25] HUGGETT R J, 2016. Fundamentals of Geomorphology [M]. Routledge, London, New York. [26] LI S, 2007. Soil moisture inversion model research of multi-band and multi-polarization SAR based on IEM[D]. Beijing: Chinese Academy of Agricultural Sciences. (in Chinese with English abstract) [27] LIN G Q, GUO H D, ZHANG L, 2013. Study on roughness inversion of alluvial fan in arid areas based on SAR data[J]. Remote Sensing Technology and Application, 28(4): 659-665. (in Chinese with English abstract) [28] LUBETKIN L K C, CLARK M M, 1988. Late Quaternary activity along the Lone Pine fault, eastern California[J]. GSA Bulletin, 100(5): 755-766. doi: 10.1130/0016-7606(1988)100<0755:LQAATL>2.3.CO;2 [29] MAO H L, ZHAO H, LU Y C, et al. , 2007. Pollen assemblages and environment evolution in Shule River alluvial fan oasis of Gansu[J]. Acta Geoscientia Sinica, 28(6): 528-534. (in Chinese with English abstract) [30] MATHER P AND TSO B, 2016. Classification methods for remotely sensed data[M]. CRC press. [31] MATMON A, SCHWARTZ D P, FINKEL R, et al. , 2005. Dating offset fans along the Mojave section of the San Andreas fault using cosmogenic 26Al and 10Be[J]. GSA Bulletin, 117(5-6): 795-807. [32] MATTIA F, LE TOAN T, SOUYRIS J C, et al. , 1997. The effect of surface roughness on multifrequency polarimetric SAR data[J]. IEEE Transactions on Geoscience and Remote Sensing, 35(4): 954-966. doi: 10.1109/36.602537 [33] REGMI NR, MCDONALD E V, BACON S N, 2014. Mapping Quaternary alluvial fans in the southwestern United States based on multiparameter surface roughness of lidar topographic data [J]. Journal of Geophysical Research: Earth Surface, 119(1): 12—27. doi: 10.1002/2012JF002711 [34] ROBINSON GU N P, ALLRED B W, JONES M O, et al. , 2017. A dynamic Landsat derived normalized difference vegetation index (NDVI) product for the conterminous United States[J]. Remote sensing, 9(8): 863. doi: 10.3390/rs9080863 [35] SADEH Y, COHEN H, MAMAN S, et al. , 2018. Evaluation of Manning’s n roughness coefficient in arid environments by using SAR backscatter[J]. Remote Sensing, 10(10): 1505. doi: 10.3390/rs10101505 [36] SHAO Y, LV Y, DONG Q, et al. , 2002. Study on soil microwave dielectric characteristic as salinity and water content[J]. Journal of Remote Sensing, 6(6): 416-423. (in Chinese with English abstract) [37] SU Q, REN J J, LIANG O B, et al. , 2020. Quantitative mapping of the Moleqie River alluvial fan morphologic units in China based on ALOS PALSAR data[J]. Seismology and Geology, 42(1): 79-94. (in Chinese with English abstract) [38] SU Q, REN J J, WANG X Y, et al. , 2023. A power-law relation of surface roughness and ages of alluvial fans in a hyperarid environment: a case study in the Dead Sea area[J]. Progress in Physical Geography: Earth and Environment, 47(3): 348-368. doi: 10.1177/03091333221118641 [39] SUN P, 2017. Modeling the water infiltration and evaporation in unsaturated zone of the extremely arid area[D]. Lanzhou: Lanzhou University. (in Chinese with English abstract) [40] ULABY F T, BRADLEY G A, DOBSON M C, 1979. Microwave backscatter dependence on surface roughness, soil moisture, and soil texture(PartⅡ): Vegetation-covered soil [J]. IEEE Transactions on Geoscience Electronics, 17(2): 33—40. doi: 10.1109/TGE.1979.294626 [41] WANG P, 2003. Development of the Shulehe alluvial-fan and its response to tectonic activity in Gansu Province, China: characteristics of neotectonic activity of the East end of the Altyn Tagh fault[D]. Beijing: Institute of Geology, China Earthquake Administration. (in Chinese with English abstract) [42] WANG P, LU Y C, DING G Y, et al. , 2004. Response of the development of the shule river alluvial fan to tectonic activity[J]. Quaternary Sciences, 24(1): 74-81. (in Chinese with English abstract) [43] WU J, YANG Q K, LI Y R, 2018. Partitioning of terrain features based on roughness[J]. Remote Sensing, 10(12): 1985. doi: 10.3390/rs10121985 [44] XU X W, TAPPONNIER P, VAN DER WOERD J, et al. , 2003. Late Quaternary sinistral slip rate along the Altyn Tagh fault and its structural transformation model [J]. Science in China Series D 33(10): 967-974. (in Chinese with English abstract) [45] YANG X, 2008. An elementary introduction to supervised and unsupervised classification of remote sensing image[J]. Acta Geologica Sichuan, 28(3): 251-254. (in Chinese with English abstract) [46] YUN L, ZHANG J, WANG J, et al. , 2021. Discovery of active faults in the southern Beishan area, NW China: implications for regional tectonics[J]. Journal of Geomechanics, 27(2): 195-207,doi: 10.12090/j.issn.1006-6616.2021.27.02.019. (in Chinese with English abstract) [47] ZELENIN E, BACHMANOV D, GARIPOVA S, et al. , 2022. The Active Faults of Eurasia Database (AFEAD): the ontology and design behind the continental-scale dataset[J]. Earth System Science Data, 14(10): 4489-4503. doi: 10.5194/essd-14-4489-2022 [48] ZHANG L, GUO H D, 2013. The temporal-spatial distribution of Shule river alluvial fan units in China based on SAR data and OSL dating[J]. Remote Sensing, 5(12): 6997-7016. doi: 10.3390/rs5126997 [49] ZHENG R Z, 2005. Tectonic uplift and deformation mechanism of the Altun structural system since the middle-late period of late Pleistocene time[D]. Beijing: Institute of Geology, China Earthquake Administration. (in Chinese with English abstract) [50] ZRIBI M, BAGHDADI N, HOLAH N, et al. , 2005. Evaluation of a rough soil surface description with ASAR-ENVISAT radar data[J]. Remote Sensing of Environment, 95(1): 67-76. doi: 10.1016/j.rse.2004.11.014 [51] ZHOU Z H, 2021. Machine learning[M]. Springer Nature. [52] 郭铌, 2003. 植被指数及其研究进展[J]. 干旱气象, 21(4): 71-75. [53] 韩龙飞, 刘静, 袁兆德, 等, 2019. 基于高分辨率地形数据的冲洪积扇特征提取与演化模式讨论: 以海原断裂带老虎山地区冲洪积扇为例[J]. 地震地质, 41(2): 251-265. doi: 10.3969/j.issn.0253-4967.2019.02.001 [54] 黄飞鹏, 张会平, 熊建国, 等, 2021. 走滑断裂百万年时间尺度位移量估计及其在阿尔金断裂系中的应用[J]. 地质力学学报, 27(2): 208-217,doi: 10.12090/j.issn.1006-6616.2021.27.02.020. [55] 李森, 2007. 基于IEM的多波段、多极化SAR土壤水分反演算法研究[D]. 北京: 中国农业科学院. [56] 林国青, 郭华东, 张露, 2013. 基于SAR数据的干旱区冲积扇地表粗糙度反演[J]. 遥感技术与应用, 28(4): 659-665. doi: 10.11873/j.issn.1004-0323.2013.4.659 [57] 毛洪亮, 赵华, 卢演俦, 等, 2007. 甘肃疏勒河冲积扇绿洲全新世孢粉组合和环境演化[J]. 地球学报, 28(6): 528-534. doi: 10.3321/j.issn:1006-3021.2007.06.003 [58] 邵芸, 吕远, 董庆, 等, 2002. 含水含盐土壤的微波介电特性分析研究[J]. 遥感学报, 6(6): 416-423. doi: 10.11834/jrs.20020604 [59] 苏强, 任俊杰, 梁欧博, 等, 2020. 基于ALOS PALSAR影像的莫勒切河洪积扇地貌面定量分期[J]. 地震地质, 42(1): 79-94. doi: 10.3969/j.issn.0253-4967.2020.01.006 [60] 孙朋, 2017. 极端干旱区沙漠包气带降水入渗与蒸发规律模拟研究[D]. 兰州: 兰州大学. [61] 王萍, 2003. 甘肃疏勒河冲积扇发育对构造活动的响应: 兼论阿尔金断裂东端新构造活动特征[D]. 北京: 中国地震局地质研究所. [62] 王萍, 卢演俦, 丁国瑜, 等, 2004. 甘肃疏勒河冲积扇发育特征及其对构造活动的响应[J]. 第四纪研究, 24(1): 74-81. doi: 10.3321/j.issn:1001-7410.2004.01.009 [63] 徐锡伟, TAPPONNIER P, VAN DER WOERD J, 等, 2003. 阿尔金断裂带晚第四纪左旋走滑速率及其构造运动转换模式讨论[J]. 中国科学(D辑), 33(10): 967-974. doi: 10.3321/j.issn:1006-9267.2003.10.007 [64] 杨鑫, 2008. 浅谈遥感图像监督分类与非监督分类[J]. 四川地质学报, 28(3): 251-254. doi: 10.3969/j.issn.1006-0995.2008.03.020 [65] 云龙, 张进, 王驹, 等, 2021. 甘肃北山南部活动断裂的发现及其区域构造意义[J]. 地质力学学报, 27(2): 195-207,doi: 10.12090/j.issn.1006-6616.2021.27.02.019. [66] 郑荣章, 2005. 阿尔金构造系晚更新世中晚期以来的构造隆升及其变形机制[D]. 北京: 中国地震局地质研究所. -

 下载:
下载:

计量
- 文章访问数: 1316
- HTML全文浏览量: 404
- PDF下载量: 37
- 被引次数: 0
