

Hazard assessment of debris flows in Kongpo Gyamda, Tibet based on FLO-2D numerical simulation
-
摘要: 工布江达县位于藏东地区,雨季区内泥石流频发,对人民基本生活和区域经济建设与发展造成了严重影响。为研究藏东地区中—小型泥石流灾害对城镇居民聚集区的危害特征和潜在危险性,运用FLO-2D软件,以西藏自治区工布江达县县城周边居民分布较为集中的5条泥石流沟为研究对象,通过模拟泥石流泥深和流速等方面的冲淤特征,以县城典型泥石流沟模拟冲出结果为基础,确定泥石流强度并划定危险性分区,分析泥石流危险分区与居民聚集区之间的拓扑关系,评估县城周边泥石流危险性,为工布江达县城的城镇规划和防灾减灾提供技术参考。Abstract: Kongpo Gyamda is located in eastern Tibet, where debris flows occur frequently in the rainy season, which has a serious impact on local people's daily life and hinders regional economic construction and development. In order to study the hazard characteristics of small to medium-sized debris flow in eastern Tibet and potential dangers to urban residential areas, the FLO-2D software was used to study five debris flow gullies with relatively concentrated residents around Kongpo Gyamda. The scouring and silting characteristics of debris flows were simulated. Based on the simulation results in terms of depth and velocity, the intensity and hazard zoning of debris flows were determined. By analyzing the topological relationship between the debris flow danger zone and the residential area, the debris flow risk around the county was evaluated. It provides technical reference for the town planning, and disaster prevention and mitigation in Kongpo Gyamda.
-
Key words:
- risk assessment /
- debris flow /
- FLO-2D /
- numerical simulation /
- Kongpo Gyamda
-

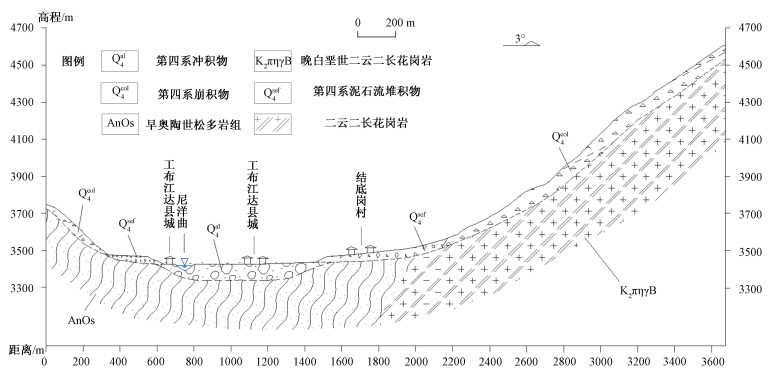
图 1 工布江达县城地理位置图
a-林芝市位置图;b-工布江达县城位置图;c-研究区地形图
Figure 1. Location of Kongpo Gyamda
(a) Location map of Nyingchi; (b) Location map of Kongpo Gyamda; (c) Topographic map of the study area

图 3 工布江达县城泥石流沟平面图
a-结底岗沟和地村沟;b-各娘朗沟;c-折西折凤普沟;d-卡热普沟;e-泥石流沟分布图
Figure 3. Plan view of the debris flow gullies in Kongpo Gyamda
(a) Jiedigang debris flow gully and Dicun debris flow gully; (b) Genianglang debris flow gully; (c) Zhexizhefengpu debris flow gully; (d) Karepu debris flow gully; (e) Distribution map of debris flow gullies

图 4 泥石流大型潜在松散物源位置图
Figure 4. Location map of the large potential loose material sources of debris flow

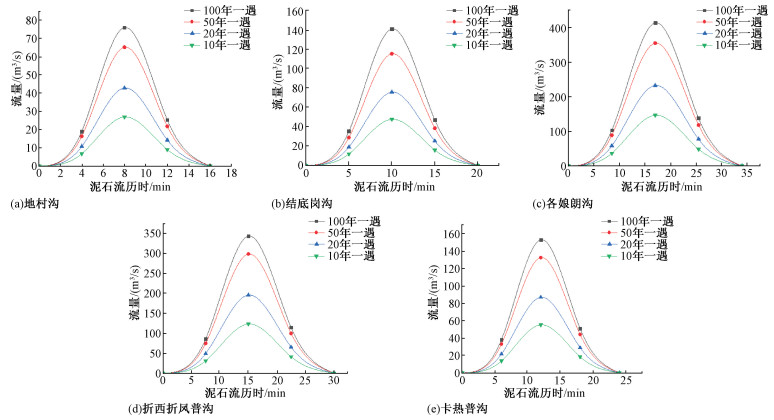
图 5 工布江达县城泥石流沟不同频率下流量过程曲线
Figure 5. The flow-process curves of the debris flow gullies in Kongpo Gyamda under different frequencies
(a) Dicun debris flow gully; (b) Jiedigang debris flow gully; (c) Genianglang debris flow gully; (d) Zhexizhefengpu debris flow gully; (e) Karepu debris flow gully

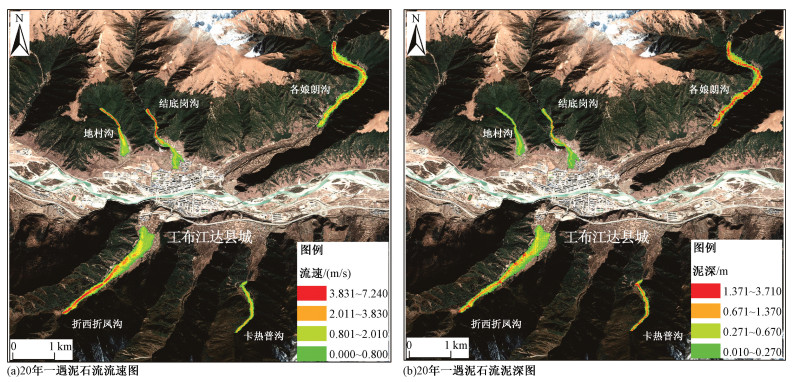
图 6 20年一遇的暴雨条件下模拟结果
Figure 6. Simulation results under the heaviest rain conditions in recent 20 years
(a) Velocity; (b) Depth

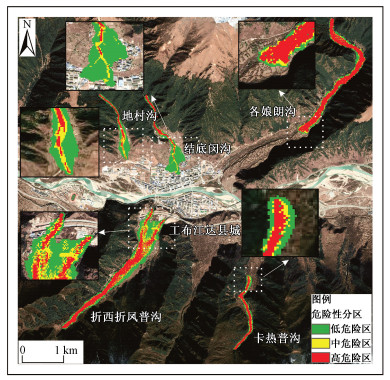
图 7 工布江达县城泥石流危险性评定标准
Figure 7. The risk assessment standard for the debris flows in Kongpo Gyamda

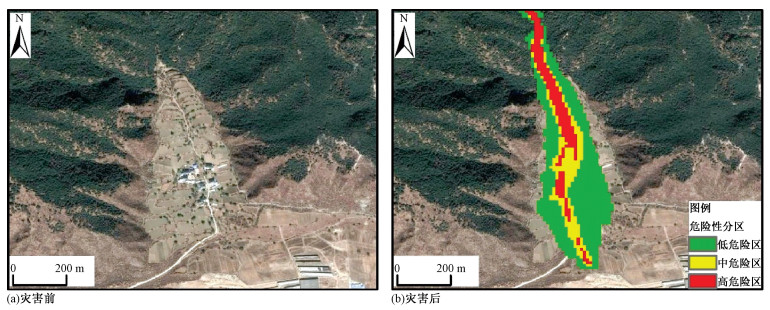
图 9 地村沟堆积扇人口聚集区灾害发生前后对比图
Figure 9. Comparison of before and after the disaster in the densely populated area of the Dicun accumulation fan
(a) Before the disaster; (b) After the disaster

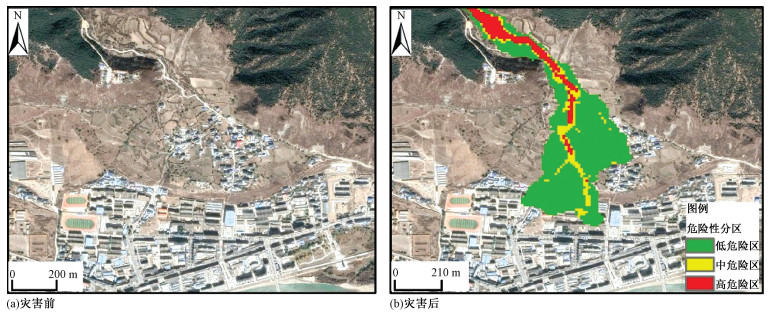
图 10 结底岗沟堆积扇人口聚集区灾害发生前后对比图
Figure 10. Comparison of before and after the disaster in the densely populated area of the Jiedigang accumulation fan
(a) Before the disaster; (b) After the disaster

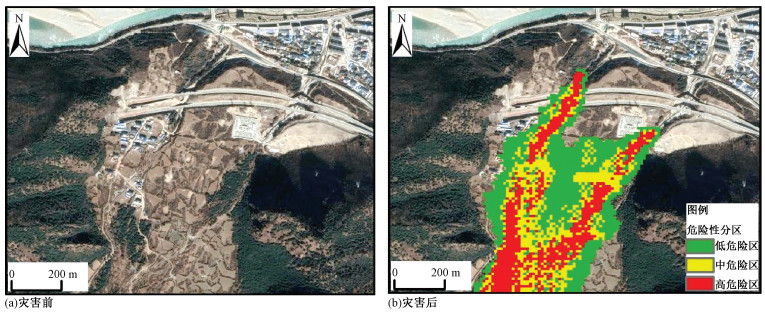
图 11 折西折凤普沟堆积扇人口聚集区灾害发生前后对比图
Figure 11. Comparison of before and after the disaster in the densely populated area of Zhexizhefengpu accumulation fan
(a) Before the disaster; (b) After the disaster
表 1 泥石流沟特征值参数
Table 1. Characteristic parameters of the five debris flow gullies
泥石流沟名 流域面积/km2 主沟长度/km 主沟平均坡降/‰ 高程差/m 潜在松散物源量/×104 m3 地村沟 2.71 3.30 102 979 80 结底岗沟 6.66 5.46 282 1690 110 各娘朗沟 53.90 15.80 102 1558 300 折西折凤普沟 33.59 11.80 223 1970 300 卡热普沟 11.20 7.00 219 1622 60  下载: 导出CSV
表 2 数值模拟涉及数据说明
Table 2. Data description of the numerical simulation
数据类型 数据说明 DEM 12.5 m分辨率ALOS数值高程模型数据 遥感影像 1 m分辨率Google Earth遥感影像 地质资料 林芝县幅1∶25万区域地质图 泥石流数据 西藏自治区工布江达县1∶5万地质灾害详细调查数据库 降雨数据 工布江达县气象局1990~2019年降雨数据 泥石流沟暴发记录 野外实地调查、访问
下载: 导出CSV
表 3 工布江达县城泥石流基础参数拟定
Table 3. Basic parameters of the five debris flow gullies in Kongpo Gyamda
泥石流沟名 易发性量化评分 重度/(t/m3) 泥沙修正系数 体积浓度/% 流域曼宁系数 泥石流历时/min 地村沟 80 1.551 0.516 34 0.10 16 结底岗沟 93 1.641 0.650 39 0.20 20 各娘朗沟 86 1.593 0.565 38 0.15 34 折西折凤普沟 93 1.641 0.650 39 0.06 30 卡热普沟 81 1.558 0.524 37 0.22 24
下载: 导出CSV
表 4 工布江达县城泥石流基础参数取值
Table 4. Values of basic parameters of debris flows in Kongpo Gyamda
参数 屈服应力/MPa 粘滞系数 层流阻力系数K α1 β1 α2 β2 数值 0.811 13.72 0.00462 11.24 2280
下载: 导出CSV
表 5 模拟结果与实际情况对比表
Table 5. Comparison between simulation results and actual conditions
泥石流沟名 堆积范围/×104 m2 冲出方量/×104 m3 模拟值 调查值 误差率/% 模拟值 调查值 误差率/% 地村沟 8.32 9.27 -10.2 2.04 2.41 -15.35 结底岗沟 7.88 7.23 9.0 1.43 1.21 18.2 各娘朗沟 21.52 26.66 -19.3 18.08 19.78 -8.6 折西折凤普沟 23.37 24.43 -4.3 7.83 8.09 -3.2 卡热普沟 0.95 2.15 -55.8 0.59 1.83 -67.8
下载: 导出CSV
表 6 不同频率下的泥石流模拟结果表
Table 6. Table of simulation results of the debris flow gullies at different frequencies
泥石流沟名 地村沟 结底岗沟 各娘朗沟 折西折凤普沟 卡热普沟 暴发频率/a 10 50 100 10 50 100 10 50 100 10 50 100 10 50 100 平均流速/(m/s) 1.02 1.21 1.27 0.74 0.90 0.92 1.25 1.71 1.78 1.34 1.57 1.67 0.56 1.15 1.17 平均堆积深度/m 0.20 0.28 0.30 0.16 0.19 0.32 0.65 1.06 1.15 0.30 0.40 0.42 0.36 0.54 0.67 堆积扇面积/×104 m2 7.97 11.50 12.99 3.84 14.26 16.89 4.27 6.58 7.62 11.37 37.53 43.05 0.16 3.23 4.19 冲出方量/×104 m3 1.59 3.22 3.90 0.61 2.78 5.40 2.78 6.97 8.76 3.87 15.01 18.08 0.06 1.74 2.81
下载: 导出CSV
表 7 泥石流强度划分表
Table 7. Table of debris flow intensity
泥石流强度 泥深/m 关系式 泥深与流速乘积/(m2/s) 高 h≥1 OR vh≥1 0.5≤h<1 AND 0.5≤vh<1 中 0≤h<0.5 AND 0.5≤h<1 0.5≤h<1 AND 0≤h<0.5 低 0≤h<0.5 AND 0≤vh<0.5
下载: 导出CSV
表 8 不同降雨频率下泥石流堆积区危险性分区统计表
Table 8. Risk zoning table of debris flow accumulation areas under different rainfall frequencies
泥石流沟名 高危险区面积/×104 m2 占比/% 中危险区面积/×104 m2 占比/% 低危险区面积/×104 m2 占比/% 地村沟 2.28 17.48 2.53 19.40 8.23 63.11 结底岗沟 0.96 5.79 1.80 10.86 13.81 83.34 各娘朗沟 5.15 67.59 0.96 12.60 1.51 19.82 折西折凤普沟 13.32 33.14 10.20 25.38 16.67 41.48 卡热普沟 1.83 42.66 0.62 14.45 1.84 42.89
下载: 导出CSV
表 9 人口聚集区受影响面积占比
Table 9. Proportion of the affected areas in densely populated area
泥石流沟名 人口聚集区 总面积/×104 m2 受影响区域 无影响区域/% 高危险性占比/% 中危险性占比/% 低危险性占比/% 地村沟 1.34 80.6 18.7 0.7 0 结底岗沟 21.15 0.5 2.8 30.4 66.3 折西折凤普沟 3.70 18.4 14.1 30.2 37.3
下载: 导出CSV
-
CAO P, HOU S S, CHEN L, et al., 2021. Risk assessment of mass debris flow based on numerical simulation: an example from the Malu River basin in Min County[J]. The Chinese Journal of Geological Hazard and Control, 32(2): 100-109. (in Chinese with English abstract) CASTELLI F, FRENI G, LENTINI V, et al., 2017. Modelling of a debris flow event in the Enna area for hazard assessment[J]. Procedia Engineering, 175: 287-292. doi: 10.1016/j.proeng.2017.01.026 CHANG M, TANG C, VAN ASCH T W J, et al., 2017. Hazard assessment of debris flows in the Wenchuan earthquake-stricken area, South West China[J]. Landslides, 14(5): 1783-1792. doi: 10.1007/s10346-017-0824-9 CHANG M, DOU X Y, TANG C, et al., 2019. Hazard assessment of typical debris flow induced by rainfall intensity[J]. Earth Science, 44(8): 2794-2802. (in Chinese with English abstract) CHANG M, LIU Y, ZHOU C, et al., 2020. Hazard assessment of a catastrophic mine waste debris flow of Hou Gully, Shimian, China[J]. Engineering Geology, 275: 105733. doi: 10.1016/j.enggeo.2020.105733 CHEN M, TANG C, GAN W, et al., 2018. Characteristics and dynamical process of debris flow at urgent steep gully in the earthquake areas: illustrated with case of Wayao gully in Wenchuan[J]. Journal of Yunnan University, 40(2): 272-278. (in Chinese with English abstract) CHEN N S, ZHOU H B, HU G S, 2011. Development rules of debris flow under the influence of climate change in nyingchi[J]. Advances in Climate Change Research, 7(6): 412-417. (in Chinese with English abstract) CONG K, LI R D, BI Y H, 2019. Benefit evaluation of debris flow control engineering based on the FLO-2D model[J]. Northwestern Geology, 52(3): 209-216. (in Chinese with English abstract) FANG Q S, TANG C, CHEN Z H, et al., 2019. A calculation method for predicting the runout volume of dam-break and non-dam-break debris flows in the Wenchuan earthquake area[J]. Geomorphology, 327: 201-214. doi: 10.1016/j.geomorph.2018.10.023 GAO B, ZHANG J J, WANG J C, et al., 2019. Formation mechanism and disaster characteristics of debris flow in the Tianmo gully in Tibet[J]. Hydrogeology and Engineering Geology, 46(5): 144-153. (in Chinese with English abstract) GONG K, YANG T, XIA C H, et al., 2017. Assessment on the hazard of debris flow based on FLO-2D: a case study of debris flow in Cutou Gully, Wenchuan, Sichuan[J]. Journal of Water Resources and Water Engineering, 28(6): 134-138. (in Chinese with English abstract) GU X Z, CHEN H K, LIU H C, 2010. Method and application of debris flow hazard assessment based on SIGA-BP neural network[J]. Journal of Chongqing Jiaotong University (Natural Science), 29(1): 98-102. (in Chinese with English abstract) HOU S S, CAO P, CHEN L, et al., 2021. Debris flow hazard assessment of the Eryang River watershed based on numerical simulation[J]. Hydrogeology and Engineering Geology, 48(2): 143-151. (in Chinese with English abstract) HU H W, 2019. Forecast the trend of large-scale debris flows along Zhouqu-Wudu section of Bailong River Basin[D]. Beijing: China University of Geosciences (Beijing). (in Chinese with English abstract) JIA T, TANG C, WANG N N, 2015. Method and application of debris flow hazard zoning based on FLO-2D and impulse model[J]. Water Resources and Power, 33(2): 152-155, 171. (in Chinese with English abstract) JIANG Q M, DENG Y E, WANG J C, et al., 2017. Comprehensive evaluation and analysis of risk of Tianmo-gully debris-flow[J]. Journal of Geological Hazards and Environment Preservation, 28(4): 7-12. (in Chinese with English abstract) Kongpo Gyamda County Local Chronicles Compilation Committee, 2008. Kongpo Gyamda county chronicles[M]. Beijing: China Tibetology Publishing House: 1-10. (in Chinese) KUANG L H, XU L R, LIU B C, et al., 2006. A new method for choosing zonation indicators of mudflow danger degrees based on the rough set theory[J]. Journal of Geomechanics, 12(2): 236-242. (in Chinese with English abstract) LI J, CHEN N S, DENG M F, 2017. Variation trend analysis on debris flow scale in Zhamunong Gully[J]. Yangtze River, 48(23): 61-65. (in Chinese with English abstract) LI K, TANG C, 2007. Progress in research on debris flow hazard assessment[J]. Journal of Catastrophology, 22(1): 106-111. (in Chinese with English abstract) LI M W, TANG C, CHEN M, et al., 2021. Formation and vulnerability analysis for debris flow occurred on 20 august 2019 in Banzi catchment, Wenchuan county, Sichuan province, China[J]. Journal of Disaster Prevention and Mitigation Engineering, 41(2): 238-245. (in Chinese with English abstract) LIANG H X, SHANG M, XU X, 2016. Research on the influence factors of flow and deposition of debris flow based on the FLO-2D simulation[J]. Journal of Engineering Geology, 24(2): 228-234. (in Chinese with English abstract) LIN J Y, YANG M D, LIN B R, 2011. Risk assessment of debris flows in Songhe Stream, Taiwan[J]. Engineering Geology, 123(1-2): 100-112. doi: 10.1016/j.enggeo.2011.07.003 LIU J J, MA C, LI C Y, 2020. Fundamental problems and prospects in the study of deposition dynamics of viscous debris flow in the gully-river junction[J]. Journal of Geomechanics, 26(4): 544-555. (in Chinese with English abstract) LU A X, DENG X F, ZHAO S X, et al., 2006. Cause of debris flow in Guxiang valley in bomi, Tibet autonomous region, 2005[J]. Journal of Glaciology and Geocryology, 28(6): 956-960. (in Chinese with English abstract) LUO G Z, XU L R, 2008. Application of fuzzy synthetic method based on rough set theory and grey theory in debris flow hazard assessment[J]. Safety and Environmental Engineering, 15(3): 1-5, 9. (in Chinese with English abstract) LUO Y T, TANG C, XIONG J, et al., 2020. Cause analysis of "8·20" debris flow and forecast of river-blocking range in Xiazhuang gully of Wenchuan county, Sichuan province[J]. Bulletin of Soil and Water Conservation, 40(6): 193-199. (in Chinese with English abstract) Ministry of Land and Resources of the People's Republic of China, 2006. Specification of geological investigation for debris flow stabilization: DZ/T 0220-2006[S]. Beijing: Standards Press of China. (in Chinese) O′Brien, 2009. FLO-2D reference manual[R]. Sichuan Provincial Department of Water Conservancy and Electric Power, 1984. Handbook of storm flood calculation in small and medium watersheds in Sichuan Province[R]. (in Chinese) TANG C, ZHOU J Q, ZHU J, et al., 1994. A study on the risk zoning of debris flow on alluvial fans by applying technology of numerical simulation[J]. Journal of Catastrophology, 9(4): 7-13. (in Chinese with English abstract) TIE Y B, TANG C, 2006. Application of AHP in single debris flow risk assessment[J]. The Chinese Journal of Geological Hazard and Control, 17(4): 79-84. (in Chinese with English abstract) WANG G F, CHEN Z L, MAO J R, et al., 2020. Debris flow risk assessment in Bailong River Basin under different engineering scenarios and rainfall frequency conditions[J]. Journal of Shandong University of Science and Technology (Natural Science), 39(5): 30-40. (in Chinese with English abstract) WANG J, DING M T, MIAO C, et al., 2014. Hazard assessment of debris flow based on GIS and AHP in Lushan earthquake disaster area[J]. Resources and Environment in the Yangtze Basin, 23(11): 1580-1587. (in Chinese with English abstract) WANG J, DING M T, HUANG Y, 2016. Debris flow motion feature and control measures of Lianhexi valley based on FLO-2 D[J]. Journal of Southwest University of Science and Technology, 31(2): 59-66. (in Chinese with English abstract) WANG N N, TANG C, 2014. Numerical simulation of Huangyang gully debris flow Longchi town Dujiangyan city based on FLO-2D[J]. Journal of Geological Hazards and Environment Preservation, 25(1): 107-112. (in Chinese with English abstract) WANG X B, WANG X Z, WANG Y, 2000. The evaluation and prevention on the debris flow risk in Dianhuying of Yuanshi county of Hebei province[J]. The Chinese Journal of Geological Hazard and Control, 11(3): 93-97. (in Chinese with English abstract) XU H L, 2018. The run-out scale prediction of therapid-steep channel debris-flow based on FLO-2D[D]. Chengdu: Chengdu University of Technology. (in Chinese with English abstract) YALCIN A, 2008. GIS-based landslide susceptibility mapping using analytical hierarchy process and bivariate statistics in Ardesen (Turkey): comparisons of results and confirmations[J]. CATENA, 72(1): 1-12. doi: 10.1016/j.catena.2007.01.003 YANG T, TANG C, FANG Q S, et al., 2017. Modeling of dam-breaking debris flow using FLO-2D model[J]. Journal of Sediment Research, 42(4): 60-66. (in Chinese with English abstract) YANG T, TANG C, CHANG M, et al., 2018. Hazard assessment of debris flow in small watershed based on numerical simulation[J]. Resources and Environment in the Yangtze Basin, 27(1): 197-204. (in Chinese with English abstract) YU B, 2010. Study on the method for deposition depth calculation of debris flow with different densities[J]. Journal of Disaster Prevention and Mitigation Engineering, 30(2): 207-211. (in Chinese with English abstract) ZHANG C S, ZHANG Y C, ZHANG L H, 2004. Danger assessment of collapses, landslides and debris flows of geological hazards in China[J]. Journal of Geomechanics, 10(1): 27-32. (in Chinese with English abstract) ZHANG F X, ZHANG L Q, ZHOU J, et al., 2019. Risk assessment of debris flow in Ruoru Village, Tibet Based on FLO-2D[J]. Journal of Water Resources and Water Engineering, 30(5): 95-102. (in Chinese with English abstract) ZHANG J J, LIU J K, GAO B, et al., 2018. Characteristics of material sources of Galongqu glacial debris flow and the influence to Zhamo road[J]. Journal of Geomechanics, 24(1): 106-115. (in Chinese with English abstract) ZHANG J S, 2020. Characteristics of Xiaojiagou debris flow source evolution and inrushing scales in Wenchuan earthquake area[J]. Yangtze River, 51(8): 37-43. (in Chinese with English abstract) ZHANG P, MA J Z, SHU H P, et al., 2014. Numerical simulation of erosion and deposition debris flow based on FLO-2D Model[J]. Journal of Lanzhou University (Natural Sciences), 50(3): 363-368, 375. (in Chinese with English abstract) ZHAO D L, LAN C Z M, HOU G L, et al., 2021. Assessment of geological disaster susceptibility in the Hehuang Valley of Qinghai Province[J]. Journal of Geomechanics, 27(1): 83-95. (in Chinese with English abstract) ZHONG X, ZHAO D J, LI H F, 2018. Development features and danger assessment of Kadagou debris flow in Bomi, Tibet[J]. Yangtze River, 49(S2): 103-107. (in Chinese with English abstract) 曹鹏, 侯圣山, 陈亮, 等, 2021. 基于数值模拟的群发性泥石流危险性评价: 以甘肃岷县麻路河流域为例[J]. 中国地质灾害与防治学报, 32(2): 100-109. https://www.cnki.com.cn/Article/CJFDTOTAL-ZGDH202102014.htm 常鸣, 窦向阳, 唐川, 等, 2019. 降雨驱动泥石流危险性评价[J]. 地球科学, 44(8): 2794-2802. https://www.cnki.com.cn/Article/CJFDTOTAL-DQKX201908023.htm 陈明, 唐川, 甘伟, 等, 2018. 震区急陡沟道型泥石流特征及动力过程研究: 以汶川瓦窑沟为例[J]. 云南大学学报(自然科学版), 40(2): 272-278. https://www.cnki.com.cn/Article/CJFDTOTAL-YNDZ201802012.htm 陈宁生, 周海波, 胡桂胜, 2011. 气候变化影响下林芝地区泥石流发育规律研究[J]. 气候变化研究进展, 7(6): 412-417. doi: 10.3969/j.issn.1673-1719.2011.06.005 丛凯, 李瑞冬, 毕远宏, 2019. 基于FLO-2D模型的泥石流治理工程效益评价[J]. 西北地质, 52(3): 209-216. https://www.cnki.com.cn/Article/CJFDTOTAL-XBDI201903021.htm 高波, 张佳佳, 王军朝, 等, 2019. 西藏天摩沟泥石流形成机制与成灾特征[J]. 水文地质工程地质, 46(5): 144-153. https://www.cnki.com.cn/Article/CJFDTOTAL-SWDG201905020.htm 工布江达县地方志编纂委员会, 2008. 工布江达县志[M]. 北京: 中国藏学出版社: 1-10. 龚柯, 杨涛, 夏晨皓, 等, 2017. 基于FLO-2D的泥石流危险性评价: 以四川省汶川县绵虒镇簇头沟为例[J]. 水资源与水工程学报, 28(6): 134-138. https://www.cnki.com.cn/Article/CJFDTOTAL-XBSZ201706023.htm 谷秀芝, 陈洪凯, 刘厚成, 2010. 泥石流危险性SIGA-BP神经网络评价方法及应用[J]. 重庆交通大学学报(自然科学版), 29(1): 98-102. https://www.cnki.com.cn/Article/CJFDTOTAL-CQJT201001027.htm 侯圣山, 曹鹏, 陈亮, 等, 2021. 基于数值模拟的耳阳河流域泥石流灾害危险性评价[J]. 水文地质工程地质, 48(2): 143-151. https://www.cnki.com.cn/Article/CJFDTOTAL-SWDG202102017.htm 胡宏伟, 2019. 白龙江流域舟曲-武都段大型泥石流活动趋势预测[D]. 北京: 中国地质大学(北京). 贾涛, 唐川, 王纳纳, 2015. 基于FLO-2D与冲量模型的泥石流危险度分区方法及应用[J]. 水电能源科学, 33(2): 152-155, 171. https://www.cnki.com.cn/Article/CJFDTOTAL-SDNY201502040.htm 蒋清明, 邓英尔, 王军朝, 等, 2017. 天磨沟泥石流危险性综合评判及风险性分析[J]. 地质灾害与环境保护, 28(4): 7-12. https://www.cnki.com.cn/Article/CJFDTOTAL-DZHB201704002.htm 匡乐红, 徐林荣, 刘宝琛, 等, 2006. 基于粗糙集原理的泥石流危险度区划指标选取方法[J]. 地质力学学报, 12(2): 236-242. doi: 10.3969/j.issn.1006-6616.2006.02.017 李俊, 陈宁生, 邓明枫, 2017. 西藏林芝扎木弄沟泥石流规模变化趋势研究[J]. 人民长江, 48(23): 61-65. https://www.cnki.com.cn/Article/CJFDTOTAL-RIVE201723013.htm 李阔, 唐川, 2007. 泥石流危险性评价研究进展[J]. 灾害学, 22(1): 106-111. https://www.cnki.com.cn/Article/CJFDTOTAL-ZHXU200701023.htm 李明威, 唐川, 陈明, 等, 2021. 四川省汶川县板子沟8·20泥石流成因与易损强度分析[J]. 防灾减灾工程学报, 41(2): 238-245. https://www.cnki.com.cn/Article/CJFDTOTAL-DZXK202102006.htm 梁鸿熙, 尚敏, 徐鑫, 2016. 基于FLO-2D数值模拟的泥石流流动与堆积影响因素研究[J]. 工程地质学报, 24(2): 228-234. https://www.cnki.com.cn/Article/CJFDTOTAL-GCDZ201602010.htm 刘晶晶, 马春, 李春雨, 2020. 粘性泥石流入汇区河床堆积动力学研究的问题与展望[J]. 地质力学学报, 26(4): 544-555. doi: 10.12090/j.issn.1006-6616.2020.26.04.047 鲁安新, 邓晓峰, 赵尚学, 等, 2006. 2005年西藏波密古乡沟泥石流暴发成因分析[J]. 冰川冻土, 28(6): 956-960. https://www.cnki.com.cn/Article/CJFDTOTAL-BCDT200606022.htm 罗冠枝, 徐林荣, 2008. 基于粗糙集和灰色理论的模糊综合定权法在泥石流危险性评价中的应用[J]. 安全与环境工程, 15(3): 1-5, 9. https://www.cnki.com.cn/Article/CJFDTOTAL-KTAQ200803000.htm 罗玉婷, 唐川, 熊江, 等, 2020. 四川省汶川县下庄沟"8·20"泥石流成因分析及堵江范围预测[J]. 水土保持通报, 40(6): 193-199. https://www.cnki.com.cn/Article/CJFDTOTAL-STTB202006028.htm 四川省水利电力厅, 1984. 四川省中小流域暴雨洪水计算手册[R]. (查阅所有网上资料, 未找到出版信息, 请作者确认). 唐川, 周钜乾, 朱静, 等, 1994. 泥石流堆积扇危险度分区评价的数值模拟研究[J]. 灾害学, 9(4): 7-13. https://www.cnki.com.cn/Article/CJFDTOTAL-ZHXU404.001.htm 铁永波, 唐川, 2006. 层次分析法在单沟泥石流危险度评价中的应用[J]. 中国地质灾害与防治学报, 17(4): 79-84. https://www.cnki.com.cn/Article/CJFDTOTAL-ZGDH200604017.htm 王高峰, 陈宗良, 毛佳睿, 等, 2020. 不同工程情景和降雨频率工况下白龙江流域泥石流危险性评价[J]. 山东科技大学学报(自然科学版), 39(5): 30-40. https://www.cnki.com.cn/Article/CJFDTOTAL-SDKY202005004.htm 王骏, 丁明涛, 庙成, 等, 2014. 基于GIS和AHP的芦山地震灾区泥石流危险性评价[J]. 长江流域资源与环境, 23(11): 1580-1587. https://www.cnki.com.cn/Article/CJFDTOTAL-CJLY201411014.htm 王骏, 丁明涛, 黄英, 2016. 基于FLO-2D的联合溪沟泥石流运动特征及防治对策[J]. 西南科技大学学报, 31(2): 59-66. https://www.cnki.com.cn/Article/CJFDTOTAL-XNGX201602014.htm 王纳纳, 唐川, 2014. 基于FLO-2D的都江堰市龙池镇黄央沟泥石流数值模拟[J]. 地质灾害与环境保护, 25(1): 107-112. https://www.cnki.com.cn/Article/CJFDTOTAL-DZHB201401026.htm 王欣宝, 王昕洲, 王艳, 2000. 河北元氏县佃户营泥石流危险性评价与防治[J]. 中国地质灾害与防治学报, 11(3): 93-97. https://www.cnki.com.cn/Article/CJFDTOTAL-ZGDH200003022.htm 徐惠梁, 2018. 基于FLO-2D急陡沟道泥石流冲出规模预测研究[D]. 成都: 成都理工大学. 杨涛, 唐川, 方群生, 等, 2017. 基于FLO-2D的溃决型泥石流模拟研究[J]. 泥沙研究, 42(4): 60-66. https://www.cnki.com.cn/Article/CJFDTOTAL-NSYJ201704009.htm 杨涛, 唐川, 常鸣, 等, 2018. 基于数值模拟的小流域泥石流危险性评价研究[J]. 长江流域资源与环境, 27(1): 197-204. https://www.cnki.com.cn/Article/CJFDTOTAL-CJLY201801022.htm 余斌, 2010. 不同容重的泥石流淤积厚度计算方法研究[J]. 防灾减灾工程学报, 30(2): 207-211. https://www.cnki.com.cn/Article/CJFDTOTAL-DZXK201002017.htm 张春山, 张业成, 张立海, 2004. 中国崩塌、滑坡、泥石流灾害危险性评价[J]. 地质力学学报, 10(1): 27-32. https://journal.geomech.ac.cn/article/id/a0b0308f-42aa-41b4-b5af-ad12fb6ff00b 张奋翔, 张路青, 周剑, 等, 2019. 基于FLO-2D的西藏若如村泥石流危险性分析[J]. 水资源与水工程学报, 30(5): 95-102. https://www.cnki.com.cn/Article/CJFDTOTAL-XBSZ201905015.htm 张佳佳, 刘建康, 高波, 等, 2018. 藏东南嘎龙曲冰川泥石流的物源特征及其对扎墨公路的影响[J]. 地质力学学报, 24(1): 106-115. doi: 10.12090/j.issn.1006-6616.2018.24.01.012 张建石, 2020. 汶川县肖家沟泥石流物源演变及冲出规模研究[J]. 人民长江, 51(8): 37-43. https://www.cnki.com.cn/Article/CJFDTOTAL-RIVE202008007.htm 张鹏, 马金珠, 舒和平, 等, 2014. 基于FLO-2D模型的泥石流运动冲淤数值模拟[J]. 兰州大学学报(自然科学版), 50(3): 363-368, 375. https://www.cnki.com.cn/Article/CJFDTOTAL-LDZK201403013.htm 赵东亮, 兰措卓玛, 侯光良, 等, 2021. 青海省河湟谷地地质灾害易发性评价[J]. 地质力学学报, 27(1): 83-95. doi: 10.12090/j.issn.1006-6616.2021.27.01.009 中华人民共和国国土资源部, 2006. 泥石流灾害防治工程勘查规范: DZ/T 0220-2006[S]. 北京: 中国标准出版社. 钟鑫, 赵德军, 黎厚富, 2018. 西藏波密县卡达沟泥石流发育特征及危险性评价[J]. 人民长江, 49(S2): 103-107. https://www.cnki.com.cn/Article/CJFDTOTAL-RIVE2018S2026.htm -

 下载:
下载:


计量
- 文章访问数: 1502
- HTML全文浏览量: 501
- PDF下载量: 115
- 被引次数: 0
