

PETROLEUM ACCUMULATION CHARACTERISTICS AND PRESERVATION CONDITIONS OF LIANYUAN SAG IN THE CENTRAL HUNAN
-
摘要: 针对湘中涟源凹陷油气藏成藏期次和时间以及油气藏破坏、改造等进行详细研究, 发现存在多期油气充注。利用沥青、包裹体分析, 印支之前曾有过油的充注, 在印支早期、晚期共发生二期天然气充注。印支期既是高成熟天然气充注期, 又是构造圈闭形成时期, 燕山期只对前期气藏起破坏、改造作用。总结了4种油气藏破坏、改造、保存样式, 即原生油气藏后期无改造样式, 原生油气藏后期简单改造样式, 原生油气藏后期多期改造样式, 原生油气藏后期完全破坏样式。分析认为涟源凹陷3个构造带油气藏保存条件各异, 西部构造带保存最差, 中部较好, 东部最好。Abstract: Based on the analysis of asphalts and inclusions in Lianyuan sag of Central Hunan, a study on the accumulation periods, destruction and transformation of oil and gas reservoirs has been researched. The result shows that the oil and gas charging occurred during pre-Indo-China movement, with earlier Indo-China movement and later Indo-China movement two times charging naturally. Indo-China Stage was not only high-matured gas time but also structural traps formed time, while Yanshan Stage played a destructive and transformative role on earlier traps and reservoirs. Four destruction, transformation and preservation models of reservoir are proposed, such as original reservoirs without destruction, original reservoirs with little destruction, original reservoirs with serious destruction, and original reservoirs with total destruction. Finally, it comes to a conclusion that three tectonic zones of Lianyuan sag have different preserving conditions, from west to east, the conditions become better and better.
-
Key words:
- Lianyuan sag /
- preserve condition /
- destroying method of reservoirs
-

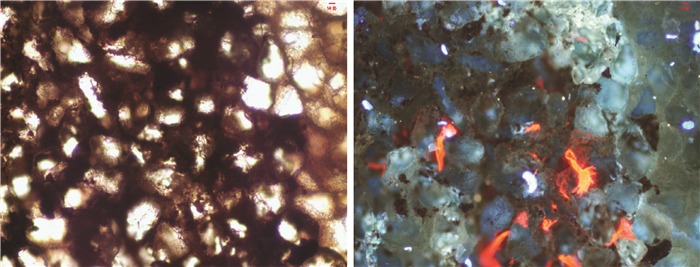
图 2 金竹山-1 C1d2细砂岩(粒间见大量不发荧光沥青和发火红色荧光沥青)
Figure 2. Finding lots of bitumen with no fluorescence or red fluorescence in the C1d2 of Jinzhu Mountain

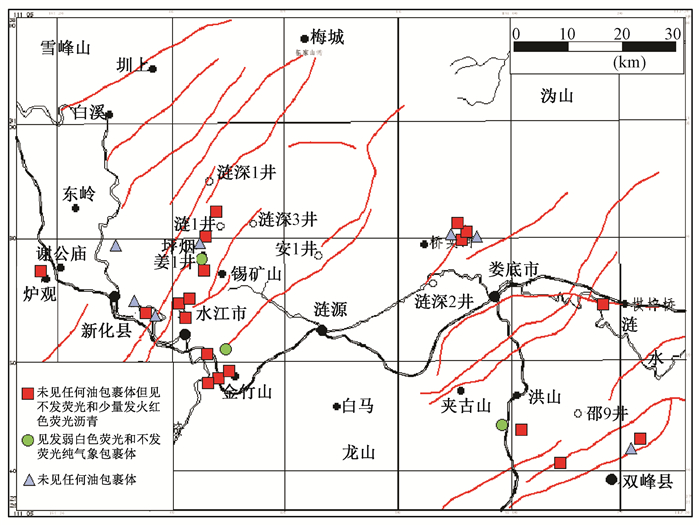
图 3 涟源凹陷石炭系沥青及包裹体荧光特征分布图
Figure 3. Distribution of fluid inclusion samples with fluorescence and bitumen from Carboniferous, Lianyuan sag

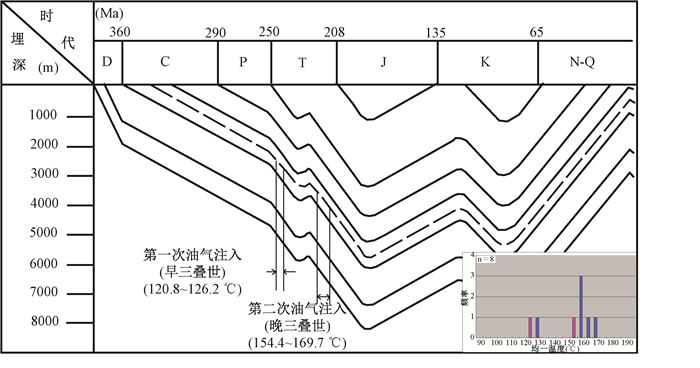
图 4 涟源凹陷锡矿山C1d1油气注入期次(埋藏史据涟8井)
Figure 4. C1d1 hydrocarbon charge in Shidengzi Formation in Xikuangshan, Lianyuan sag

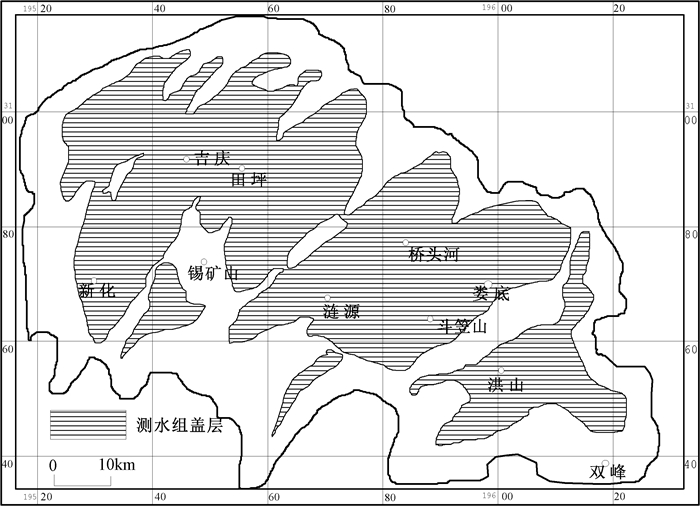
图 6 涟源凹陷下石炭统测水组盖层分布图
Figure 6. Seals distribution map of the Lower Carboniferous Ceshui Formation

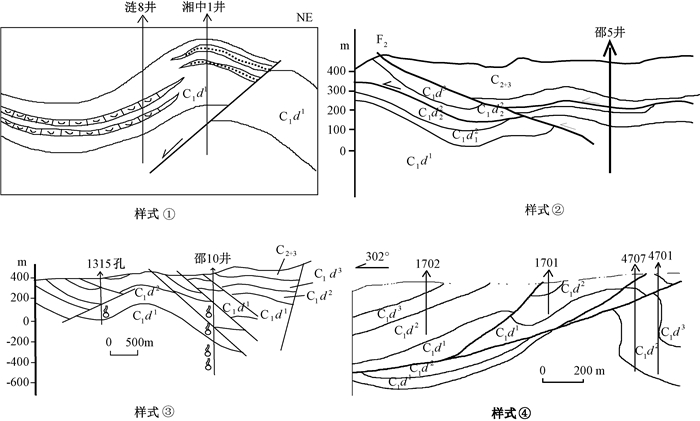
图 7 涟源凹陷油气藏破坏、改造、保存样式
Figure 7. Destruction, transformation and preservation models of hydrocarbon reservoirs in the Lianyuan sag
表 1 涟源凹陷断裂破坏油气藏形式
Table 1. The models of breaking the hydrocarbon reservoirs by faults in the Lianyuan sag
样式 断裂 断裂发育类型 油气散失结果 破坏形式 构造运动导致
断裂活动后生
断裂挤压型断裂 

A 拉张型断裂 

B 起分散效应的断裂 

C 起集中效应的断裂 

D 伸入、未切穿盖层的断裂 

E 盖层顶部的断裂 

F 其他原因引起
断裂活动先生
断裂构造活动使得断裂重新活动、封闭性变差 
G  下载: 导出CSV
-
[1] 邓忠凡, 王兆熙, 等. 湖南省涟源凹陷下石炭统天然气远景初步预测[R]. 新乡: 地质部第五石油普查勘探指挥部, 1982.DENG Zhong-fan, WANG Zhao-xi, et al. Preliminary prospective prediction of natural gas in the Lower Carboniferous in Lianyuan depression, Hunan Province[R]. Xinxiang: No. 5 Petroleum reconnaissance and Exploration Directorate, 1982. [2] 赵宗举, 朱琰, 李大成, 等.中国南方构造形变对油气藏的控制作用[J].石油与天然气地质, 2002, 23(1): 19~26. doi: 10.11743/ogg20020104ZHAO Zong-jun, ZHU Yan, LI Da-cheng, et al. Control affect of tectonic deformation to oil-gas pools in southern China[J]. Oil & Gas Geology, 2002, 23(1): 19~26. doi: 10.11743/ogg20020104 [3] 张抗.改造型盆地及其油气地质意义[J].新疆石油地质, 1999, 20(1): 65~70. http://www.cnki.com.cn/Article/CJFDTOTAL-XJSD901.019.htmZHANG Kang. Reformed basin and its significance in petroleum geology[J]. Xinjiang Petroleum Geology, 1999, 20(1): 65~70. http://www.cnki.com.cn/Article/CJFDTOTAL-XJSD901.019.htm [4] 云武, 徐志斌, 杨雄庭.湖南涟源凹陷西部滑脱带构造特征[J].中国矿业大学学报, 1994, 23(1): 16~25. http://www.cnki.com.cn/Article/CJFDTOTAL-ZGKD401.002.htmYUN Wu, XU Zhi-bin, YANG Xiong-ting. Characteristics of detachment structures in the west of Lianyuan depression[J]. Journal of China Universtiy of Mining and Technology, 1994, 23(1): 16~25. http://www.cnki.com.cn/Article/CJFDTOTAL-ZGKD401.002.htm [5] 周进高, 邓红婴, 冯加良.湖南涟源凹陷构造演化与油气成藏研究[J].地质科学, 2003, 38(1): 44~51. http://www.cnki.com.cn/Article/CJFDTOTAL-DZKX200301005.htmZHOU Jin-gao, DENG Hong-ying, FENG Jia-liang. Tectonic evolution and forming of hydrocarbon reservoir in the Lianyuan depression, Hunan[J]. Scientia Geologica Sinica, 2003, 38(1): 44~51. http://www.cnki.com.cn/Article/CJFDTOTAL-DZKX200301005.htm [6] 刘德汉.包裹体研究——盆地流体追踪的有力工具[J].地学前缘, 1995, 2(3/4): 149~153. http://www.cnki.com.cn/Article/CJFDTOTAL-DXQY504.002.htmLIU De-han. Fluid inclusion studies: An effective means for basin fluid investigation[J]. Earth Science Frontiers, 1995, 2(3/4): 149~153. http://www.cnki.com.cn/Article/CJFDTOTAL-DXQY504.002.htm [7] 孙樯, 谢鸿森, 郭捷, 等.含油气沉积盆地包裹体及应用[J].吉林大学学报:地球科学版, 2000, 30(1): 42~45. http://www.cnki.com.cn/Article/CJFDTOTAL-CCDZ200001010.htmSUN Qiang, XIE Hong-sen, GUO Jie, et al. Fluid inclusions in sedimentary basins generating petroleum and their application[J]. Journal of Jinlin University: Earth Science Edition, 2000, 30(1): 42~45. http://www.cnki.com.cn/Article/CJFDTOTAL-CCDZ200001010.htm [8] 孙岩, 沈修志, 施泽进, 等.湘中地区造山运动期后的拉伸作用[J].南京大学学报:自然科学版, 1990, 26(4): 711~719. http://www.cnki.com.cn/Article/CJFDTOTAL-NJDZ199004021.htmSUN Yan, SHEN Xiu-zhi, SHI Ze-jin, et al. A tensile action after the orogeny period in the central Hunan area[J]. Journal of Nanjing University: Natural Sciences Edition, 1990, 26(4): 711~719. http://www.cnki.com.cn/Article/CJFDTOTAL-NJDZ199004021.htm [9] Surdam R C. Seals, traps, and the petroleum system[J]. AAPG Memoir, 1997, 67: 31~48, 57~84. http://ci.nii.ac.jp/ncid/BA33915154 -

 下载:
下载:

计量
- 文章访问数: 447
- HTML全文浏览量: 202
- PDF下载量: 19
- 被引次数: 0
